Southwick neighborhood in Des Moines, Iowa (IA), 50315 detailed profile
Settings
X


Business Search - 14 Million verified businesses
Area: 0.047 square miles
Population: 259
Population density:
| Southwick: | 5,482 people per square mile |
| Des Moines: | 2,783 people per square mile |

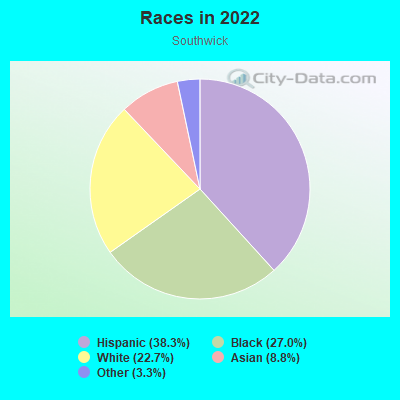
- 15238.3%Hispanic or Latino
- 10727.0%Black
- 9022.7%White
- 358.8%Asian
- 133.3%Some other race
Distribution of median household income
![Distribution of median household income]()
- 11Less than $10,000
- 15$10,000 to $19,999
- 14$20,000 to $29,999
- 8$30,000 to $39,999
- 8$40,000 to $49,999
- 3$50,000 to $59,999
- 12$60,000 to $74,999
- 26$75,000 to $99,999
- 6$100,000 to $124,999
- 10$125,000 to $149,999
- 3$150,000 to $199,999
- 6$200,000 or more

Distribution of owner-occupied house/condo value
![Distribution of owner-occupied house/condo value]()
- 15Less than $50,000
- 45$50,000 to $99,999
- 17$100,000 to $149,999
- 6$150,000 to $199,999
- 7$200,000 to $249,999
- 2$250,000 to $299,999

Distribution of rent paid by renters
![Distribution of rent paid by renters]()
- 2Less than $100
- 1$100 to $199
- 4$200 to $299
- 2$300 to $399
- 5$400 to $499
- 6$600 to $699
- 20$700 to $799
- 13$800 to $899
- 11$900 to $999
- 5$1,000 to $1,249
- 1$1,500 to $1,999

Median rent in 2022:
| Southwick: | $773 |
| Des Moines: | $873 |
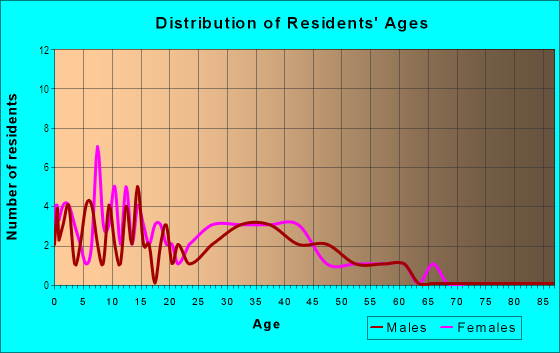
| Males: | 136 |
| Females: | 123 |
Males:
| This neighborhood: | 36.0 years |
| Whole city: | 34.7 years |
| This neighborhood: | 30.5 years |
| Whole city: | 35.5 years |
Average household size:
| Southwick: | 2.9 people |
| Des Moines: | 2.2 people |
Percentage of family households:
| Southwick: | 60.0% |
| Des Moines: | 40.8% |
| Here: | 32.0% |
| Des Moines: | 32.7% |
Percentage of married-couple families with children (among all households):
| Southwick: | 17.7% |
| Des Moines: | 26.2% |
Percentage of single-mother households (among all households):
| Southwick: | 11.6% |
| Des Moines: | 14.0% |
Percentage of never married males 15 years old and over:
Percentage of never married females 15 years old and over:
| Southwick: | 35.2% |
| Des Moines: | 21.4% |
Percentage of never married females 15 years old and over:
| Southwick: | 19.3% |
| city: | 19.3% |
Percentage of people that speak English not well or not at all:
| Southwick: | 12.4% |
| Des Moines: | 5.0% |
Percentage of people born in this state:
Percentage of people born in another U.S. state:
Percentage of native residents but born outside the U.S.:
Percentage of foreign born residents:
| Here: | 64.7% |
| Des Moines: | 64.1% |
Percentage of people born in another U.S. state:
| Southwick: | 22.0% |
| Des Moines: | 19.2% |
Percentage of native residents but born outside the U.S.:
| Here: | 0.2% |
| city: | 0.5% |
Percentage of foreign born residents:
| Here: | 13.1% |
| Des Moines: | 16.2% |
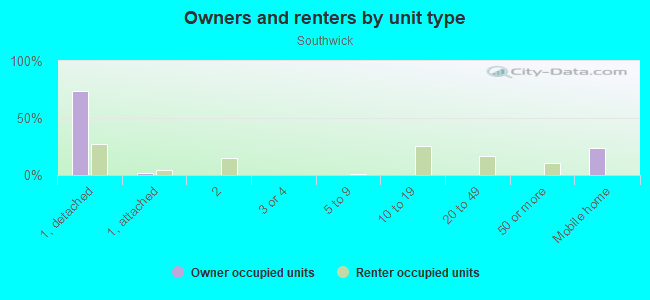
Owner-occupied
Renter-occupied

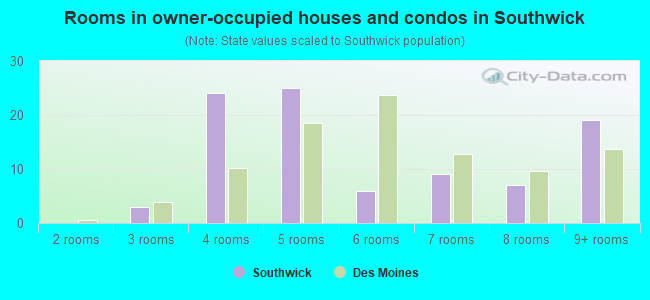
- Rooms in owner-occupied houses and condos in Southwick
- 01 room
- 02 rooms
- 33 rooms
- 244 rooms
- 255 rooms
- 66 rooms
- 97 rooms
- 78 rooms
- 199+ rooms
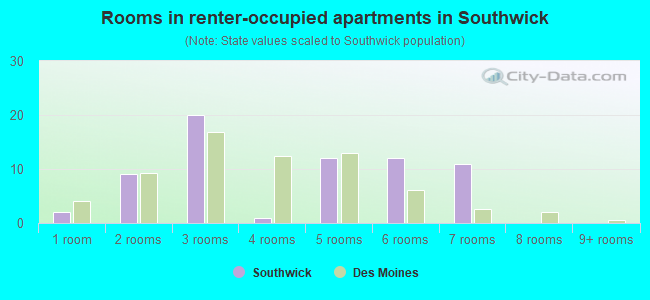
- Rooms in renter-occupied apartments in Southwick
- 21 room
- 92 rooms
- 203 rooms
- 14 rooms
- 125 rooms
- 126 rooms
- 117 rooms
- 08 rooms
- 09+ rooms
Owner-occupied
Renter-occupied
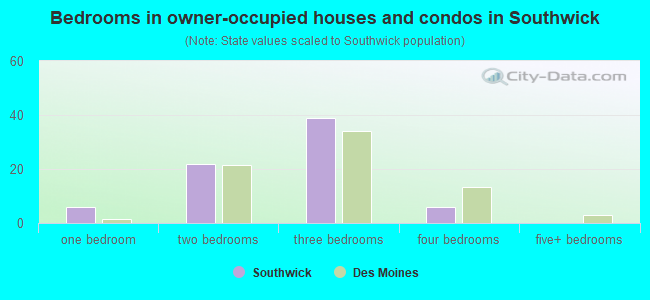
- Bedrooms in owner-occupied houses and condos in Southwick
- 0no bedroom
- 61 bedroom
- 222 bedrooms
- 393 bedrooms
- 64 bedrooms
- 05+ bedrooms
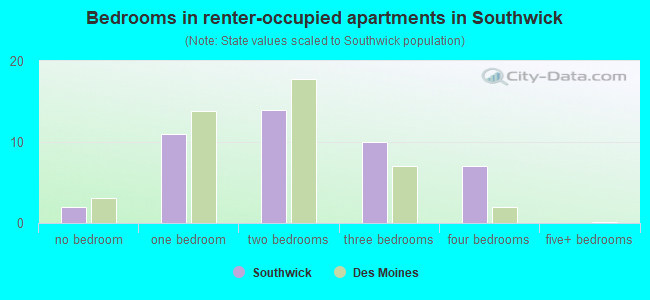
- Bedrooms in renter-occupied apartments in Southwick
- 2no bedroom
- 111 bedroom
- 142 bedrooms
- 103 bedrooms
- 74 bedrooms
- 05+ bedrooms
Average number of cars or other vehicles available in houses/condos:
Average number of cars or other vehicles available in apartments:
| This neighborhood: | 2.1 |
| Des Moines: | 1.9 |
Average number of cars or other vehicles available in apartments:
| Here: | 1.9 |
| city: | 1.2 |
Percentage of units with a mortgage:
| Southwick: | 87.2% |
| Des Moines: | 69.7% |
Average estimated value of detached houses in 2022 (98.9% of all units):
| Southwick: | $98,845 |
| Des Moines: | $201,532 |
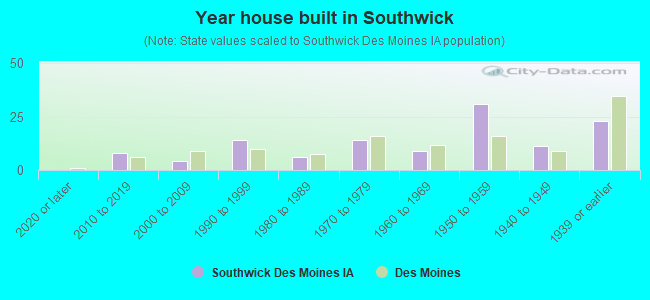
- Year house built in Southwick
- 02020 or later
- 82010 to 2019
- 42000 to 2009
- 141990 to 1999
- 61980 to 1989
- 141970 to 1979
- 91960 to 1969
- 311950 to 1959
- 111940 to 1949
- 231939 or earlier
City-data.com crime index for city in 2020 (higher means more crime):
| City: | 422.4 |
| U.S. average: | 219.5 |
Travel time to work (commute)
![Travel time to work (commute)]()
- 155 to 9 minutes
- 1410 to 14 minutes
- 1415 to 19 minutes
- 3220 to 24 minutes
- 1425 to 29 minutes
- 1630 to 34 minutes
- 440 to 44 minutes
- 145 to 59 minutes
- 390 or more minutes

Means of transportation to work
![Means of transportation to work]()
- 91.5%150Drove a car alone
- 5.5%9Carpooled
- 0.6%1Bus
- 1.8%3Taxi
- 0.6%1Bicycle
- 1.8%3Walked
- 3.7%6Worked at home

Time leaving home to go to work
![Time leaving home to go to work]()
- 612:00 a.m. to 4:59 a.m.
- 45:00 a.m. to 5:29 a.m.
- 55:30 a.m. to 5:59 a.m.
- 116:00 a.m. to 6:29 a.m.
- 196:30 a.m. to 6:59 a.m.
- 137:00 a.m. to 7:29 a.m.
- 87:30 a.m. to 7:59 a.m.
- 48:00 a.m. to 8:29 a.m.
- 28:30 a.m. to 8:59 a.m.
- 89:00 a.m. to 9:59 a.m.
- 510:00 a.m. to 10:59 a.m.
- 111:00 a.m. to 11:59 a.m.
- 912:00 p.m. to 3:59 p.m.
- 144:00 p.m. to 11:59 p.m.

Occupations of males:
- Percentage of males in management occupations (except farmers):
Here: 26.6% city: 9.3%
- Percentage of males in architecture and engineering occupations:
Here: 5.7% city: 2.3%
- Percentage of males in education, training, and library occupations:
Here: 6.4% city: 2.1%
- Percentage of males in service occupations:
Here: 26.8% city: 13.1%
- Percentage of males in sales and office occupations:
Here: 4.1% city: 15.2%
- Percentage of males in construction, extraction, and maintenance occupations:
Here: 19.4% city: 10.0%
- Percentage of males in production occupations:
Here: 3.0% city: 9.9%
- Percentage of males in material moving occupations:
Here: 5.9% city: 7.2%
Occupations of females:
- Percentage of females in business and financial operations occupations:
Here: 7.8% city: 7.3%
- Percentage of females in education, training, and library occupations:
Here: 4.0% city: 7.0%
- Percentage of females in healthcare practitioners and technical occupations:
Here: 3.3% city: 7.6%
- Percentage of females in service occupations:
Here: 25.1% city: 23.4%
- Percentage of females in sales and office occupations:
Here: 47.5% city: 27.7%
- Percentage of females in farming, fishing, and forestry occupations:
Here: 5.2% city: 0.1%
- Percentage of females in production occupations:
Here: 6.6% city: 5.0%
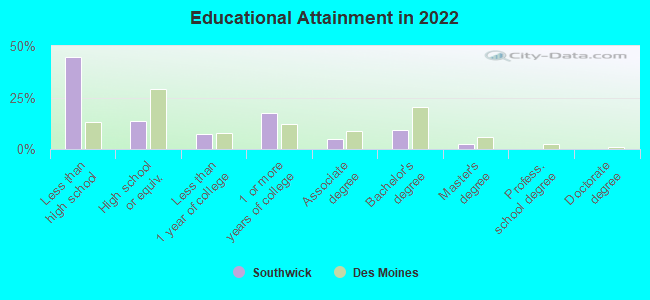
Education in this neighborhood (subdivision or community):
- Percentage of people 3 years and older in K-12 schools:
Southwick: 42.4% Des Moines: 17.5%
- Percentage of people 3 years and older in undergraduate colleges:
Southwick: 2.3% Des Moines: 3.7%
- Percentage of people 3 years and older in grad. or professional schools:
Southwick: 0.0% Des Moines: 1.6%
- Percentage of students K-12 enrolled in private schools:
Southwick: 5.5% Des Moines: 6.9%
Percentage of population below poverty level:
| Southwick: | 11.3% |
| Des Moines: | 14.7% |
Median year owner moved in (as recorded in 2022):
Median year renter moved in (as recorded in 2022):
| Southwick: | 2009 |
| Des Moines: | 2011 |
Median year renter moved in (as recorded in 2022):
| Southwick: | 2011 |
| Des Moines: | 2020 |
Percentage of married-couple families with both working:
| Southwick: | 92.8% |
| Des Moines: | 73.4% |
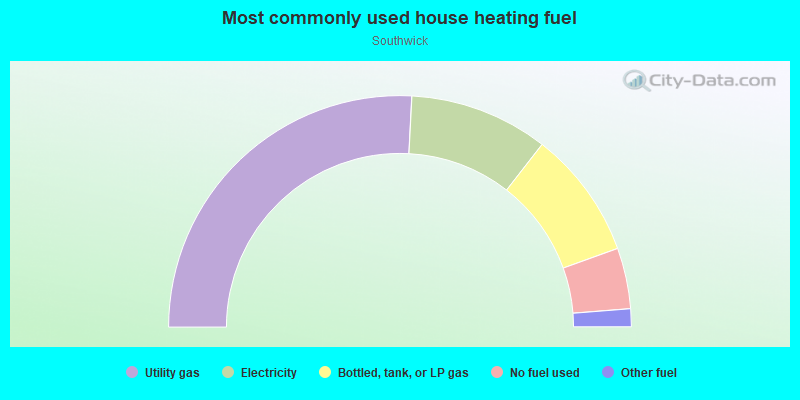
- 51.6%Utility gas
- 19.4%Electricity
- 17.9%Bottled, tank, or LP gas
- 8.5%No fuel used
- 2.5%Other fuel
Roads and streets:
SE Diehl Ave (E Diehl Ave)
Length: 0.33 miles
Direction: E-W
Address range: 200 to 399
Direction: E-W
Address range: 200 to 399
SE Wall Ave (E Wall Ave)
Length: 0.33 miles
Direction: E-W
Address range: 200 to 399
Direction: E-W
Address range: 200 to 399
SE 2nd St
Length: 0.12 miles
Direction: N-S
Address range: 5600 to 5799
Direction: N-S
Address range: 5600 to 5799
SE 4th St
Length: 0.06 miles
Direction: N-S
Address range: 5700 to 5799
Direction: N-S
Address range: 5700 to 5799
SE 3rd St
Length: 0.06 miles
Direction: N-S
Address range: 5700 to 5799
Direction: N-S
Address range: 5700 to 5799
SE Porter Ave (E Porter Ave)
Length: 0.04 miles
Direction: E-W
Address range: 100 to 199
Direction: E-W
Address range: 100 to 199