Spring Garden Industrial Area neighborhood in Baltimore, Maryland (MD), 21230 detailed profile
Settings
X


Business Search - 14 Million verified businesses
Area: 0.246 square miles
Population: 838
Population density:
| Spring Garden Industrial Area: | 3,402 people per square mile |
| Baltimore: | 7,053 people per square mile |

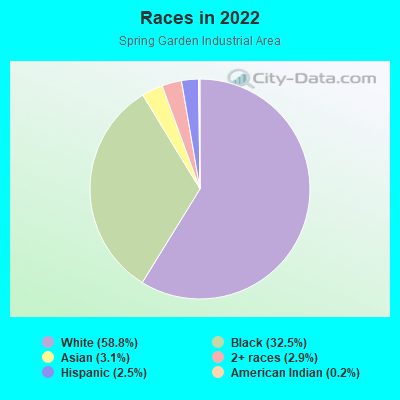
- 49058.8%White
- 27132.5%Black
- 263.1%Asian
- 242.9%Two or more races
- 212.5%Hispanic or Latino
- 20.2%American Indian
Median household income in 2022:
| Spring Garden Industrial Area: | $97,758 |
| Baltimore: | $55,198 |
Distribution of median household income
![Distribution of median household income]()
- 31Less than $10,000
- 48$10,000 to $19,999
- 46$20,000 to $29,999
- 148$30,000 to $39,999
- 17$40,000 to $49,999
- 23$50,000 to $59,999
- 40$60,000 to $74,999
- 82$75,000 to $99,999
- 40$100,000 to $124,999
- 105$125,000 to $149,999
- 43$150,000 to $199,999
- 45$200,000 or more

Distribution of owner-occupied house/condo value
![Distribution of owner-occupied house/condo value]()
- 141Less than $50,000
- 19$50,000 to $99,999
- 12$100,000 to $149,999
- 33$150,000 to $199,999
- 11$200,000 to $249,999
- 26$250,000 to $299,999
- 16$300,000 to $399,999
- 39$400,000 to $499,999
- 11$500,000 to $749,999
- 18$1,000,000 or more

Distribution of rent paid by renters
![Distribution of rent paid by renters]()
- 2Less than $100
- 152$100 to $199
- 34$200 to $299
- 3$300 to $399
- 8$500 to $599
- 7$700 to $799
- 2$800 to $899
- 27$900 to $999
- 341$1,000 to $1,249
- 9$1,250 to $1,499
- 115$1,500 to $1,999
- 194$2,000 or more

Median rent in 2022:
| Spring Garden Industrial Area: | $2,025 |
| Baltimore: | $1,043 |
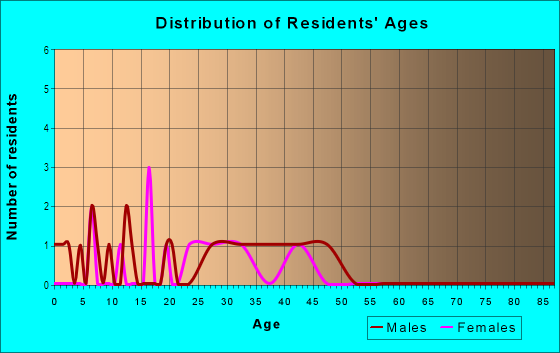
| Males: | 368 |
| Females: | 469 |
Males:
| This neighborhood: | 29.9 years |
| Whole city: | 35.0 years |
| This neighborhood: | 31.1 years |
| Whole city: | 38.2 years |
Average household size:
| Spring Garden Industrial Area: | 1.7 people |
| Baltimore: | 2.2 people |
Percentage of family households:
| Spring Garden Industrial Area: | 20.0% |
| Baltimore: | 34.2% |
| Here: | 12.4% |
| Baltimore: | 23.3% |
Percentage of married-couple families with children (among all households):
| Spring Garden Industrial Area: | 38.2% |
| Baltimore: | 22.4% |
Percentage of single-mother households (among all households):
| Spring Garden Industrial Area: | 21.7% |
| Baltimore: | 18.7% |
Percentage of never married males 15 years old and over:
Percentage of never married females 15 years old and over:
| Spring Garden Industrial Area: | 22.7% |
| Baltimore: | 25.1% |
Percentage of never married females 15 years old and over:
| Spring Garden Industrial Area: | 36.2% |
| city: | 27.5% |
Percentage of people that speak English not well or not at all:
| Spring Garden Industrial Area: | 0.1% |
| Baltimore: | 2.3% |
Percentage of people born in this state:
Percentage of people born in another U.S. state:
Percentage of native residents but born outside the U.S.:
Percentage of foreign born residents:
| Here: | 47.2% |
| Baltimore: | 64.4% |
Percentage of people born in another U.S. state:
| Spring Garden Industrial Area: | 42.0% |
| Baltimore: | 25.0% |
Percentage of native residents but born outside the U.S.:
| Here: | 1.7% |
| city: | 0.9% |
Percentage of foreign born residents:
| Here: | 9.2% |
| Baltimore: | 9.7% |
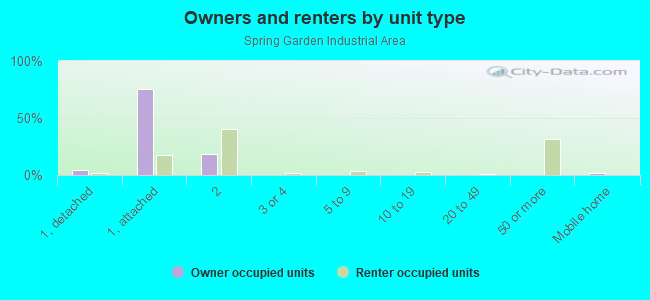
Owner-occupied
Renter-occupied

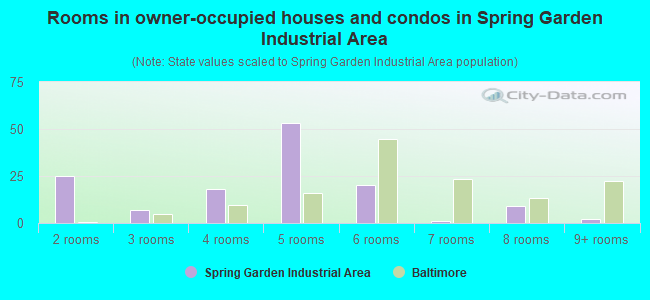
- Rooms in owner-occupied houses and condos in Spring Garden Industrial Area
- 01 room
- 252 rooms
- 73 rooms
- 184 rooms
- 535 rooms
- 206 rooms
- 17 rooms
- 98 rooms
- 29+ rooms
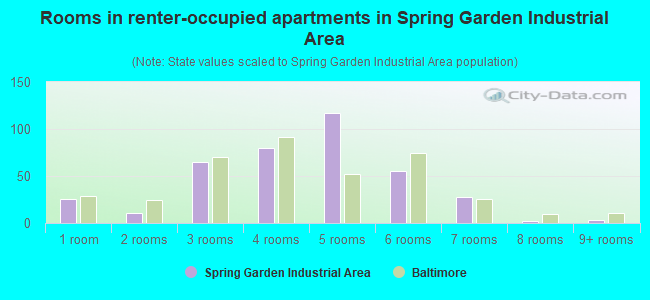
- Rooms in renter-occupied apartments in Spring Garden Industrial Area
- 261 room
- 112 rooms
- 653 rooms
- 804 rooms
- 1175 rooms
- 556 rooms
- 287 rooms
- 28 rooms
- 39+ rooms
Owner-occupied
Renter-occupied
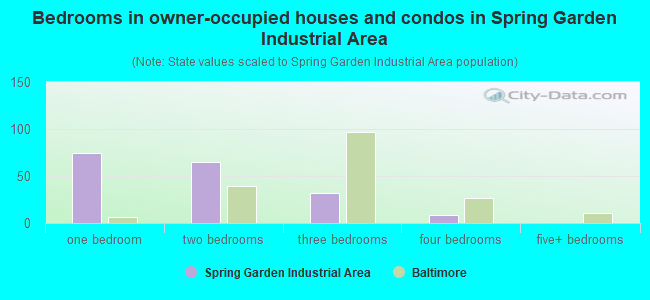
- Bedrooms in owner-occupied houses and condos in Spring Garden Industrial Area
- 0no bedroom
- 741 bedroom
- 652 bedrooms
- 323 bedrooms
- 94 bedrooms
- 05+ bedrooms
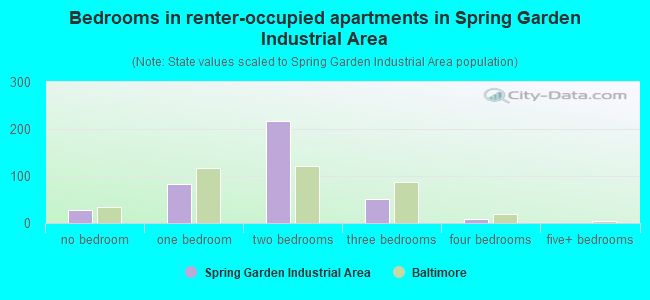
- Bedrooms in renter-occupied apartments in Spring Garden Industrial Area
- 27no bedroom
- 821 bedroom
- 2172 bedrooms
- 523 bedrooms
- 84 bedrooms
- 05+ bedrooms
Average number of cars or other vehicles available in houses/condos:
Average number of cars or other vehicles available in apartments:
| This neighborhood: | 1.6 |
| Baltimore: | 1.5 |
Average number of cars or other vehicles available in apartments:
| Here: | 1.4 |
| city: | 0.8 |
Percentage of units with a mortgage:
| Spring Garden Industrial Area: | 82.9% |
| Baltimore: | 64.3% |
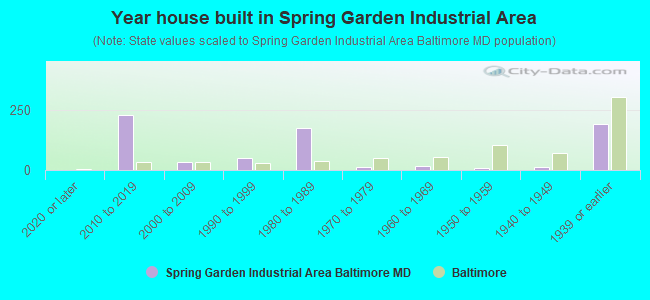
- Year house built in Spring Garden Industrial Area
- 12020 or later
- 2292010 to 2019
- 322000 to 2009
- 511990 to 1999
- 1741980 to 1989
- 121970 to 1979
- 151960 to 1969
- 81950 to 1959
- 121940 to 1949
- 1911939 or earlier
Travel time to work (commute)
![Travel time to work (commute)]()
- 2Less than 5 minutes
- 315 to 9 minutes
- 2910 to 14 minutes
- 6815 to 19 minutes
- 9120 to 24 minutes
- 4625 to 29 minutes
- 7630 to 34 minutes
- 1635 to 39 minutes
- 1040 to 44 minutes
- 2545 to 59 minutes
- 5460 to 89 minutes
- 690 or more minutes

Means of transportation to work
![Means of transportation to work]()
- 74.2%451Drove a car alone
- 4.6%28Carpooled
- 1.0%6Bus
- 0.3%2Subway or elevated rail
- 0.8%5Long-distance train or commuter rail
- 0.7%4Light rail, streetcar or trolley
- 0.3%2Taxi
- 5.3%32Bicycle
- 1.6%10Walked
- 1.5%9Other means
- 15.8%96Worked at home

Time leaving home to go to work
![Time leaving home to go to work]()
- 512:00 a.m. to 4:59 a.m.
- 15:00 a.m. to 5:29 a.m.
- 745:30 a.m. to 5:59 a.m.
- 366:00 a.m. to 6:29 a.m.
- 606:30 a.m. to 6:59 a.m.
- 607:00 a.m. to 7:29 a.m.
- 497:30 a.m. to 7:59 a.m.
- 728:00 a.m. to 8:29 a.m.
- 728:30 a.m. to 8:59 a.m.
- 479:00 a.m. to 9:59 a.m.
- 1010:00 a.m. to 10:59 a.m.
- 711:00 a.m. to 11:59 a.m.
- 1512:00 p.m. to 3:59 p.m.
- 144:00 p.m. to 11:59 p.m.

Occupations of males:
- Percentage of males in management occupations (except farmers):
Here: 17.6% city: 10.7%
- Percentage of males in business and financial operations occupations:
Here: 23.6% city: 5.9%
- Percentage of males in computer and mathematical occupations:
Here: 12.6% city: 6.1%
- Percentage of males in architecture and engineering occupations:
Here: 6.8% city: 2.9%
- Percentage of males in life, physical, and social science occupations:
Here: 4.5% city: 2.3%
- Percentage of males in legal occupations:
Here: 2.2% city: 1.8%
- Percentage of males in arts, design, entertainment, sports, and media occupations:
Here: 1.4% city: 2.8%
- Percentage of males in healthcare practitioners and technical occupations:
Here: 1.8% city: 4.0%
- Percentage of males in service occupations:
Here: 7.3% city: 14.7%
- Percentage of males in sales and office occupations:
Here: 14.7% city: 14.2%
- Percentage of males in construction, extraction, and maintenance occupations:
Here: 2.0% city: 5.6%
- Percentage of males in production occupations:
Here: 3.6% city: 4.2%
Occupations of females:
- Percentage of females in management occupations (except farmers):
Here: 26.6% city: 10.1%
- Percentage of females in business and financial operations occupations:
Here: 16.1% city: 6.6%
- Percentage of females in computer and mathematical occupations:
Here: 1.5% city: 2.4%
- Percentage of females in architecture and engineering occupations:
Here: 2.7% city: 0.9%
- Percentage of females in life, physical, and social science occupations:
Here: 2.6% city: 2.5%
- Percentage of females in community and social services occupations:
Here: 3.7% city: 3.6%
- Percentage of females in legal occupations:
Here: 3.1% city: 1.8%
- Percentage of females in education, training, and library occupations:
Here: 8.1% city: 10.7%
- Percentage of females in arts, design, entertainment, sports, and media occupations:
Here: 9.7% city: 2.4%
- Percentage of females in healthcare practitioners and technical occupations:
Here: 11.9% city: 9.8%
- Percentage of females in service occupations:
Here: 9.5% city: 20.4%
- Percentage of females in sales and office occupations:
Here: 3.1% city: 22.3%
Percentage of people 16-64 in Armed Forces:
| Spring Garden Industrial Area: | 1.4% |
| Baltimore: | 0.4% |
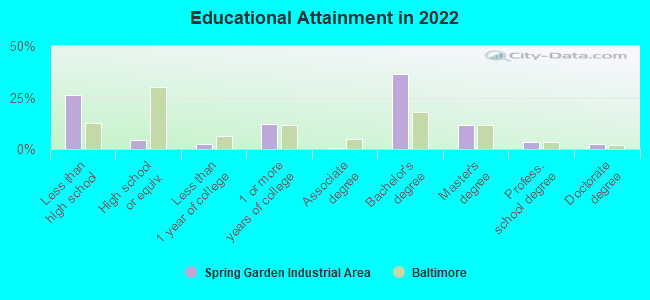
Education in this neighborhood (subdivision or community):
- Percentage of people 3 years and older in K-12 schools:
Spring Garden Industrial Area: 60.4% Baltimore: 14.7%
- Percentage of people 3 years and older in undergraduate colleges:
Spring Garden Industrial Area: 3.5% Baltimore: 6.0%
- Percentage of people 3 years and older in grad. or professional schools:
Spring Garden Industrial Area: 5.3% Baltimore: 2.8%
- Percentage of students K-12 enrolled in private schools:
Spring Garden Industrial Area: 26.3% Baltimore: 12.7%
Percentage of population below poverty level:
| Spring Garden Industrial Area: | 12.4% |
| Baltimore: | 18.5% |
Median year owner moved in (as recorded in 2022):
| Spring Garden Industrial Area: | 2016 |
| Baltimore: | 2009 |
Percentage of married-couple families with both working:
| Spring Garden Industrial Area: | 8.7% |
| Baltimore: | 79.2% |
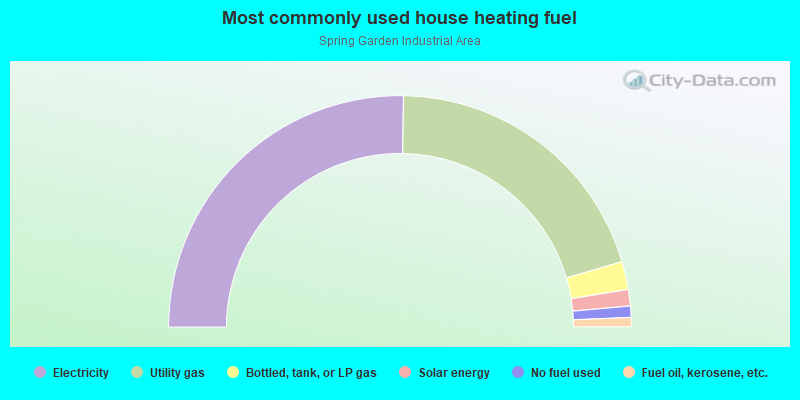
- 50.5%Electricity
- 40.4%Utility gas
- 3.9%Bottled, tank, or LP gas
- 2.3%Solar energy
- 1.6%No fuel used
- 1.3%Fuel oil, kerosene, etc.
Limited-access highways (interstate or state) in this neighborhood:
I- 95
Length: 0.66 miles
Direction: E-W
Direction: E-W
Highways in this neighborhood:
State Hwy 2 (S Hanover St)
Length: 0.44 miles
Direction: N-S
Address range: 1885 to 2599
Direction: N-S
Address range: 1885 to 2599
Roads and streets:
Race St
Length: 0.58 miles
Directions: N-S, SE-NW, SW-NE
Address range: 1326 to 2199
Directions: N-S, SE-NW, SW-NE
Address range: 1326 to 2199
Leadenhall St
Length: 0.49 miles
Direction: N-S
Address range: 1300 to 1899
Direction: N-S
Address range: 1300 to 1899
W Dickman St
Length: 0.41 miles
Directions: E-W, N-S, SE-NW, SW-NE
Address range: 1 to 209
Directions: E-W, N-S, SE-NW, SW-NE
Address range: 1 to 209
Donaldson St
Length: 0.21 miles
Direction: E-W
Address range: 100 to 199
Direction: E-W
Address range: 100 to 199
W Mc Comas St
Length: 0.17 miles
Direction: E-W
Address range: 100 to 299
Direction: E-W
Address range: 100 to 299
W Fort Ave
Length: 0.13 miles
Direction: E-W
Address range: 200 to 299
Direction: E-W
Address range: 200 to 299
W Ostend St
Length: 0.11 miles
Direction: E-W
Address range: 145 to 160
Direction: E-W
Address range: 145 to 160
Creek Aly
Length: 0.07 miles
Direction: N-S
Address range: 1300 to 1399
Direction: N-S
Address range: 1300 to 1399
Peach St
Length: 0.04 miles
Direction: SW-NE
Address range: 1300 to 1399
Direction: SW-NE
Address range: 1300 to 1399
Railroad features:
Baltimore and Ohio RR
Length: 0.79 miles
Directions: E-W, N-S, SE-NW, SW-NE
Directions: E-W, N-S, SE-NW, SW-NE
Western Maryland Rlwy
Length: 0.24 miles
Direction: E-W
Direction: E-W