Spring Hill neighborhood in Naperville, Illinois (IL), 60563 detailed profile
Settings
X


Business Search - 14 Million verified businesses
Area: 0.163 square miles
Population: 312
Population density:
| Spring Hill: | 1,914 people per square mile |
| Naperville: | 4,198 people per square mile |

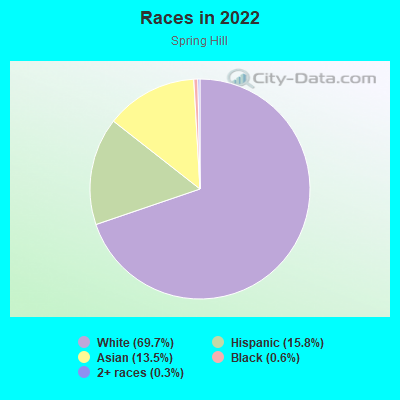
- 21669.7%White
- 4915.8%Hispanic or Latino
- 4213.5%Asian
- 20.6%Black
- 10.3%Two or more races
Median household income in 2022:
| Spring Hill: | $143,529 |
| Naperville: | $140,831 |
Distribution of median household income
![Distribution of median household income]()
- 4Less than $10,000
- 4$10,000 to $19,999
- 4$20,000 to $29,999
- 7$30,000 to $39,999
- 6$40,000 to $49,999
- 9$50,000 to $59,999
- 16$60,000 to $74,999
- 4$75,000 to $99,999
- 7$100,000 to $124,999
- 13$125,000 to $149,999
- 21$150,000 to $199,999
- 31$200,000 or more

Distribution of owner-occupied house/condo value
![Distribution of owner-occupied house/condo value]()
- 4Less than $50,000
- 2$50,000 to $99,999
- 8$150,000 to $199,999
- 6$200,000 to $249,999
- 2$250,000 to $299,999
- 22$300,000 to $399,999
- 43$400,000 to $499,999
- 4$500,000 to $749,999
- 8$750,000 to $999,999
- 5$1,000,000 or more

Distribution of rent paid by renters
![Distribution of rent paid by renters]()
- 2Less than $100
- 6$100 to $199
- 8$600 to $699
- 7$700 to $799
- 8$800 to $899
- 2$900 to $999
- 3$1,000 to $1,249
- 2$1,250 to $1,499
- 5$1,500 to $1,999
- 24$2,000 or more

Median rent in 2022:
| Spring Hill: | $2,159 |
| Naperville: | $1,609 |
| Males: | 153 |
| Females: | 159 |
Males:
| This neighborhood: | 44.4 years |
| Whole city: | 39.6 years |
| This neighborhood: | 43.3 years |
| Whole city: | 42.4 years |
Average household size:
| Spring Hill: | 2.8 people |
| Naperville: | 2.7 people |
Percentage of family households:
| Spring Hill: | 59.9% |
| Naperville: | 57.7% |
| Here: | 72.5% |
| Naperville: | 66.6% |
Percentage of married-couple families with children (among all households):
| Spring Hill: | 24.6% |
| Naperville: | 31.4% |
Percentage of single-mother households (among all households):
| Spring Hill: | 8.8% |
| Naperville: | 4.5% |
Percentage of never married males 15 years old and over:
Percentage of never married females 15 years old and over:
| Spring Hill: | 17.7% |
| Naperville: | 14.0% |
Percentage of never married females 15 years old and over:
| Spring Hill: | 6.3% |
| city: | 12.1% |
Percentage of people that speak English not well or not at all:
| Spring Hill: | 300.0% |
| Naperville: | 2.5% |
Percentage of people born in this state:
Percentage of people born in another U.S. state:
Percentage of native residents but born outside the U.S.:
Percentage of foreign born residents:
| Here: | 58.3% |
| Naperville: | 53.1% |
Percentage of people born in another U.S. state:
| Spring Hill: | 19.9% |
| Naperville: | 23.5% |
Percentage of native residents but born outside the U.S.:
| Here: | 0.7% |
| city: | 1.4% |
Percentage of foreign born residents:
| Here: | 21.1% |
| Naperville: | 22.0% |
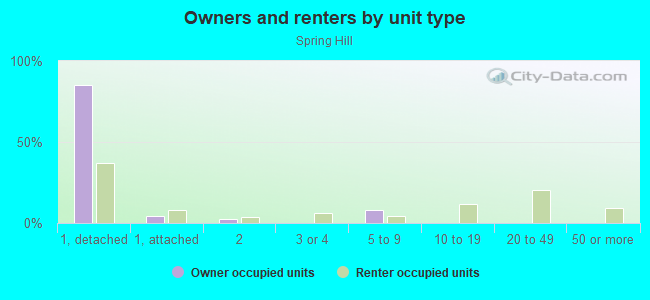
Owner-occupied
Renter-occupied

- Rooms in owner-occupied houses and condos in Spring Hill
- 01 room
- 12 rooms
- 73 rooms
- 14 rooms
- 165 rooms
- 86 rooms
- 217 rooms
- 218 rooms
- 209+ rooms
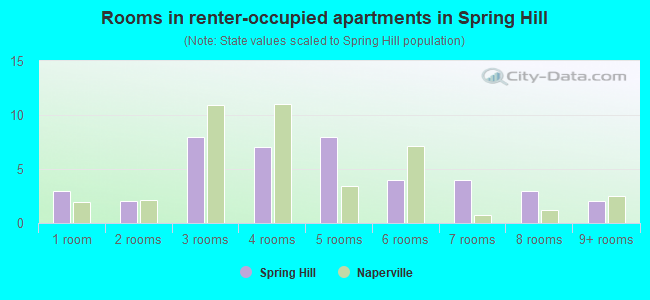
- Rooms in renter-occupied apartments in Spring Hill
- 31 room
- 22 rooms
- 83 rooms
- 74 rooms
- 85 rooms
- 46 rooms
- 47 rooms
- 38 rooms
- 29+ rooms
Owner-occupied
Renter-occupied
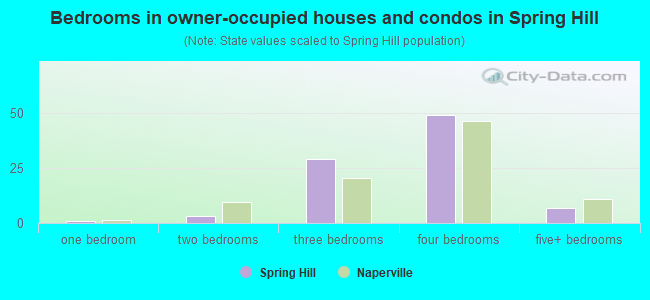
- Bedrooms in owner-occupied houses and condos in Spring Hill
- 0no bedroom
- 11 bedroom
- 32 bedrooms
- 293 bedrooms
- 494 bedrooms
- 75+ bedrooms
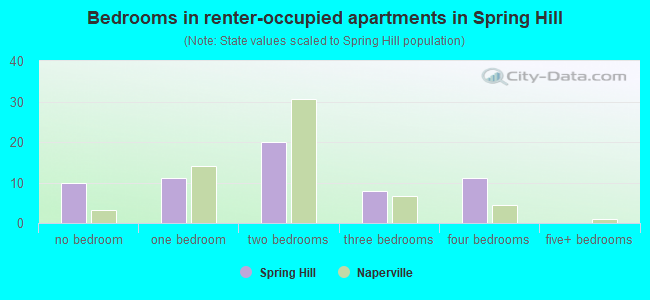
- Bedrooms in renter-occupied apartments in Spring Hill
- 10no bedroom
- 111 bedroom
- 202 bedrooms
- 83 bedrooms
- 114 bedrooms
- 05+ bedrooms
Average number of cars or other vehicles available in houses/condos:
Average number of cars or other vehicles available in apartments:
| This neighborhood: | 2.2 |
| Naperville: | 2.1 |
Average number of cars or other vehicles available in apartments:
| Here: | 2.0 |
| city: | 1.4 |
Percentage of units with a mortgage:
| Spring Hill: | 69.7% |
| Naperville: | 62.5% |
Housing prices:
- Average estimated value of detached houses in 2022 (90.9% of all units):
Spring Hill: $418,457 Naperville: $552,530
- Average estimated '22 value of housing units in 5-or-more-unit structures (3.6% of all units):
Spring Hill: $139,076 Naperville: $165,976
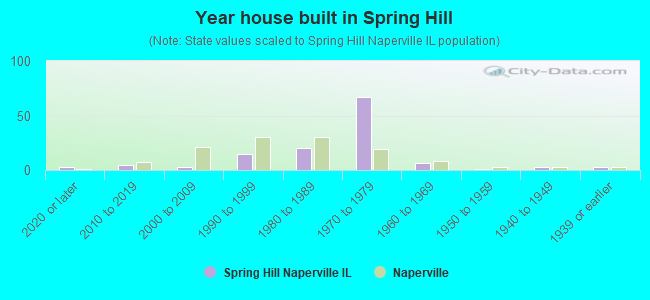
- Year house built in Spring Hill
- 32020 or later
- 52010 to 2019
- 32000 to 2009
- 151990 to 1999
- 201980 to 1989
- 671970 to 1979
- 61960 to 1969
- 11950 to 1959
- 31940 to 1949
- 31939 or earlier
City-data.com crime index for city in 2020 (higher means more crime):
| City: | 122.2 |
| U.S. average: | 219.5 |
Travel time to work (commute)
![Travel time to work (commute)]()
- 175 to 9 minutes
- 1710 to 14 minutes
- 2415 to 19 minutes
- 2520 to 24 minutes
- 1325 to 29 minutes
- 5230 to 34 minutes
- 435 to 39 minutes
- 1540 to 44 minutes
- 545 to 59 minutes
- 960 to 89 minutes
- 390 or more minutes

Means of transportation to work
![Means of transportation to work]()
- 73.5%123Drove a car alone
- 8.4%14Carpooled
- 1.2%2Bus
- 2.4%4Subway or elevated rail
- 0.6%1Long-distance train or commuter rail
- 2.4%4Walked
- 1.2%2Other means
- 12.5%21Worked at home

Time leaving home to go to work
![Time leaving home to go to work]()
- 312:00 a.m. to 4:59 a.m.
- 85:00 a.m. to 5:29 a.m.
- 45:30 a.m. to 5:59 a.m.
- 236:00 a.m. to 6:29 a.m.
- 156:30 a.m. to 6:59 a.m.
- 367:00 a.m. to 7:29 a.m.
- 417:30 a.m. to 7:59 a.m.
- 448:00 a.m. to 8:29 a.m.
- 158:30 a.m. to 8:59 a.m.
- 39:00 a.m. to 9:59 a.m.
- 410:00 a.m. to 10:59 a.m.
- 111:00 a.m. to 11:59 a.m.
- 812:00 p.m. to 3:59 p.m.
- 34:00 p.m. to 11:59 p.m.

Occupations of males:
- Percentage of males in management occupations (except farmers):
Here: 7.9% city: 21.9%
- Percentage of males in business and financial operations occupations:
Here: 5.2% city: 11.0%
- Percentage of males in computer and mathematical occupations:
Here: 18.3% city: 12.3%
- Percentage of males in architecture and engineering occupations:
Here: 3.5% city: 6.1%
- Percentage of males in life, physical, and social science occupations:
Here: 5.6% city: 1.7%
- Percentage of males in community and social services occupations:
Here: 109.5% city: 1.1%
- Percentage of males in legal occupations:
Here: 1.7% city: 2.2%
- Percentage of males in education, training, and library occupations:
Here: 7.9% city: 3.6%
- Percentage of males in arts, design, entertainment, sports, and media occupations:
Here: 1.7% city: 1.6%
- Percentage of males in healthcare practitioners and technical occupations:
Here: 1.7% city: 3.6%
- Percentage of males in service occupations:
Here: 11.2% city: 6.2%
- Percentage of males in sales and office occupations:
Here: 19.2% city: 16.9%
- Percentage of males in construction, extraction, and maintenance occupations:
Here: 12.3% city: 2.1%
- Percentage of males in production occupations:
Here: 1.9% city: 2.5%
- Percentage of males in transportation occupations:
Here: 92.3% city: 3.9%
- Percentage of males in material moving occupations:
Here: 261.5% city: 1.9%
Occupations of females:
- Percentage of females in management occupations (except farmers):
Here: 18.5% city: 13.7%
- Percentage of females in business and financial operations occupations:
Here: 7.8% city: 10.1%
- Percentage of females in computer and mathematical occupations:
Here: 2.4% city: 4.5%
- Percentage of females in architecture and engineering occupations:
Here: 2.4% city: 1.3%
- Percentage of females in life, physical, and social science occupations:
Here: 3.0% city: 1.3%
- Percentage of females in community and social services occupations:
Here: 2.7% city: 2.5%
- Percentage of females in legal occupations:
Here: 332.7% city: 1.8%
- Percentage of females in education, training, and library occupations:
Here: 11.3% city: 11.8%
- Percentage of females in arts, design, entertainment, sports, and media occupations:
Here: 1492.5% city: 2.6%
- Percentage of females in healthcare practitioners and technical occupations:
Here: 17.0% city: 11.4%
- Percentage of females in service occupations:
Here: 15.2% city: 12.4%
- Percentage of females in sales and office occupations:
Here: 19.7% city: 22.7%
- Percentage of females in production occupations:
Here: 313.1% city: 1.7%
- Percentage of females in transportation occupations:
Here: 2.0% city: 1.2%
- Percentage of females in material moving occupations:
Here: 274.6% city: 0.8%
Education in this neighborhood (subdivision or community):
- Percentage of people 3 years and older in K-12 schools:
Spring Hill: 14.5% Naperville: 19.5%
- Percentage of people 3 years and older in undergraduate colleges:
Spring Hill: 3.0% Naperville: 3.6%
- Percentage of people 3 years and older in grad. or professional schools:
Spring Hill: 1.7% Naperville: 1.7%
- Percentage of students K-12 enrolled in private schools:
Spring Hill: 9.3% Naperville: 14.4%
Percentage of population below poverty level:
| Spring Hill: | 5.3% |
| Naperville: | 4.1% |
Median year owner moved in (as recorded in 2022):
Median year renter moved in (as recorded in 2022):
| Spring Hill: | 2003 |
| Naperville: | 2010 |
Median year renter moved in (as recorded in 2022):
| Spring Hill: | 2019 |
| Naperville: | 2020 |
Percentage of married-couple families with both working:
| Spring Hill: | 93.1% |
| Naperville: | 73.0% |
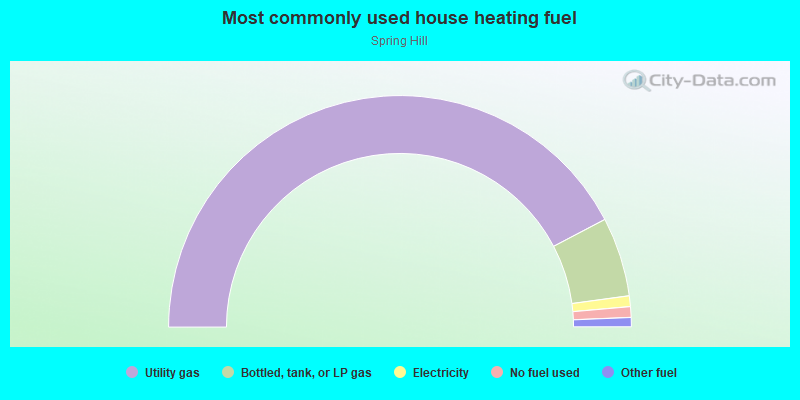
- 84.7%Utility gas
- 11.1%Bottled, tank, or LP gas
- 1.5%Electricity
- 1.5%No fuel used
- 1.3%Other fuel
Roads and streets:
Springhill Cir
Length: 0.64 miles
Directions: E-W, N-S, SE-NW, SW-NE
Address range: 532 to 884
Directions: E-W, N-S, SE-NW, SW-NE
Address range: 532 to 884
Greenfield Dr
Length: 0.57 miles
Directions: E-W, N-S, SW-NE
Address range: 1100 to 1220
Directions: E-W, N-S, SW-NE
Address range: 1100 to 1220
Needham Rd
Length: 0.45 miles
Directions: E-W, SW-NE
Address range: 1100 to 1223
Directions: E-W, SW-NE
Address range: 1100 to 1223
Haverhill Cir
Length: 0.43 miles
Directions: E-W, N-S, SE-NW, SW-NE
Address range: 1250 to 1336
Directions: E-W, N-S, SE-NW, SW-NE
Address range: 1250 to 1336
Milton Dr
Length: 0.38 miles
Directions: E-W, SE-NW, SW-NE
Address range: 500 to 777
Directions: E-W, SE-NW, SW-NE
Address range: 500 to 777
Brookline Ct
Length: 0.18 miles
Directions: E-W, N-S, SW-NE
Address range: 1200 to 1399
Directions: E-W, N-S, SW-NE
Address range: 1200 to 1399
Hageman Pl
Length: 0.14 miles
Direction: SE-NW
Address range: 721 to 750
Direction: SE-NW
Address range: 721 to 750
Andover Ct
Length: 0.07 miles
Direction: SW-NE
Address range: 1128 to 1150
Direction: SW-NE
Address range: 1128 to 1150
Wakefield Ct
Length: 0.05 miles
Direction: SE-NW
Address range: 582 to 599
Direction: SE-NW
Address range: 582 to 599
Railroad features:
Burlington Northern RR
Length: 0.72 miles
Directions: E-W, SW-NE
Directions: E-W, SW-NE
Burlington Northern Santa Fe RR
Length: 0.48 miles
Directions: E-W, SW-NE
Directions: E-W, SW-NE