Story Road neighborhood in San Jose, California (CA), 95116, 95122, 95127 detailed profile
Settings
X


Business Search - 14 Million verified businesses
Area: 0.184 square miles
Population: 2,380
Population density:
| Story Road: | 12,958 people per square mile |
| San Jose: | 5,554 people per square mile |

- 1,54362.9%Hispanic or Latino
- 65226.6%Asian
- 1556.3%Black
- 552.2%White
- 321.3%Some other race
- 160.7%Two or more races

Distribution of median household income
![Distribution of median household income]()
- 42Less than $10,000
- 48$10,000 to $19,999
- 29$20,000 to $29,999
- 34$30,000 to $39,999
- 32$40,000 to $49,999
- 19$50,000 to $59,999
- 91$60,000 to $74,999
- 61$75,000 to $99,999
- 65$100,000 to $124,999
- 41$125,000 to $149,999
- 93$150,000 to $199,999
- 71$200,000 or more

Distribution of owner-occupied house/condo value
![Distribution of owner-occupied house/condo value]()
- 22Less than $50,000
- 29$50,000 to $99,999
- 13$100,000 to $149,999
- 12$150,000 to $199,999
- 8$200,000 to $249,999
- 6$250,000 to $299,999
- 40$300,000 to $399,999
- 33$400,000 to $499,999
- 42$500,000 to $749,999
- 223$750,000 to $999,999
- 48$1,000,000 or more

Distribution of rent paid by renters
![Distribution of rent paid by renters]()
- 5Less than $100
- 5$100 to $199
- 34$200 to $299
- 12$300 to $399
- 10$400 to $499
- 28$500 to $599
- 17$600 to $699
- 10$700 to $799
- 18$800 to $899
- 11$900 to $999
- 20$1,000 to $1,249
- 18$1,250 to $1,499
- 84$1,500 to $1,999
- 123$2,000 or more

Median rent in 2022:
| Story Road: | $3,005 |
| San Jose: | $2,001 |
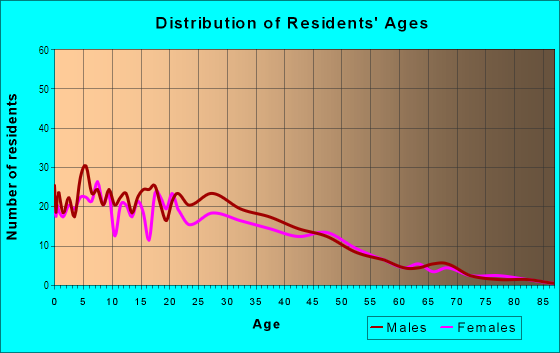
| Males: | 1,203 |
| Females: | 1,176 |
Males:
| This neighborhood: | 45.6 years |
| Whole city: | 37.6 years |
| This neighborhood: | 56.6 years |
| Whole city: | 39.1 years |
Average household size:
| Story Road: | 6.3 people |
| San Jose: | 2.9 people |
Percentage of family households:
| Story Road: | 62.3% |
| San Jose: | 49.9% |
| Here: | 42.6% |
| San Jose: | 53.0% |
Percentage of married-couple families with children (among all households):
| Story Road: | 12.1% |
| San Jose: | 25.8% |
Percentage of single-mother households (among all households):
| Story Road: | 14.6% |
| San Jose: | 5.2% |
Percentage of never married males 15 years old and over:
Percentage of never married females 15 years old and over:
| Story Road: | 23.4% |
| San Jose: | 20.9% |
Percentage of never married females 15 years old and over:
| Story Road: | 19.9% |
| city: | 16.7% |
Percentage of people that speak English not well or not at all:
| Story Road: | 18.2% |
| San Jose: | 11.4% |
Percentage of people born in this state:
Percentage of people born in another U.S. state:
Percentage of native residents but born outside the U.S.:
Percentage of foreign born residents:
| Here: | 43.5% |
| San Jose: | 46.1% |
Percentage of people born in another U.S. state:
| Story Road: | 3.8% |
| San Jose: | 10.4% |
Percentage of native residents but born outside the U.S.:
| Here: | 1.8% |
| city: | 1.7% |
Percentage of foreign born residents:
| Here: | 50.9% |
| San Jose: | 41.8% |
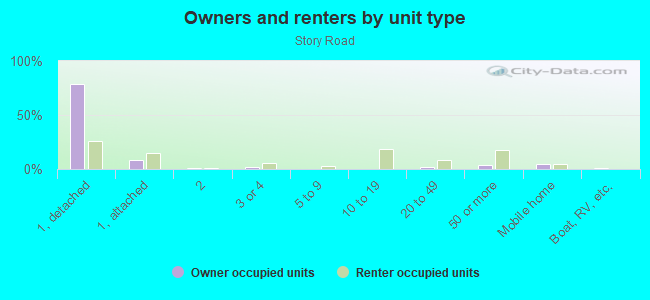
Owner-occupied
Renter-occupied

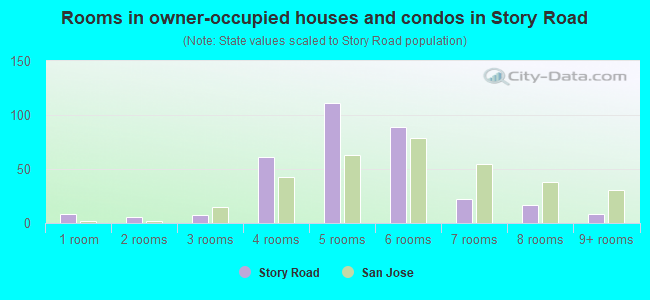
- Rooms in owner-occupied houses and condos in Story Road
- 81 room
- 62 rooms
- 73 rooms
- 614 rooms
- 1115 rooms
- 896 rooms
- 227 rooms
- 178 rooms
- 89+ rooms
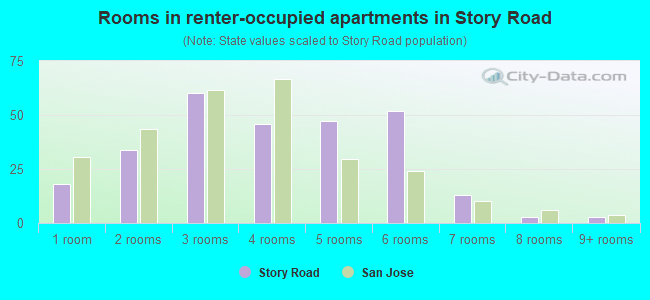
- Rooms in renter-occupied apartments in Story Road
- 181 room
- 342 rooms
- 603 rooms
- 464 rooms
- 475 rooms
- 526 rooms
- 137 rooms
- 38 rooms
- 39+ rooms
Owner-occupied
Renter-occupied
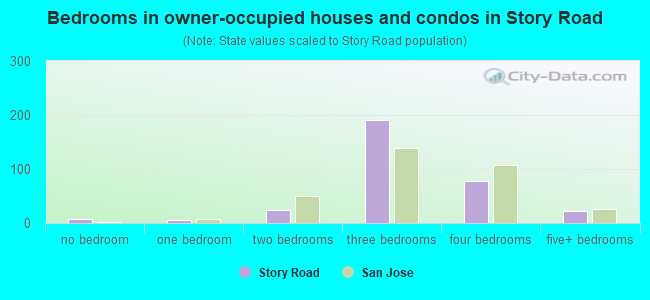
- Bedrooms in owner-occupied houses and condos in Story Road
- 8no bedroom
- 61 bedroom
- 252 bedrooms
- 1913 bedrooms
- 784 bedrooms
- 235+ bedrooms
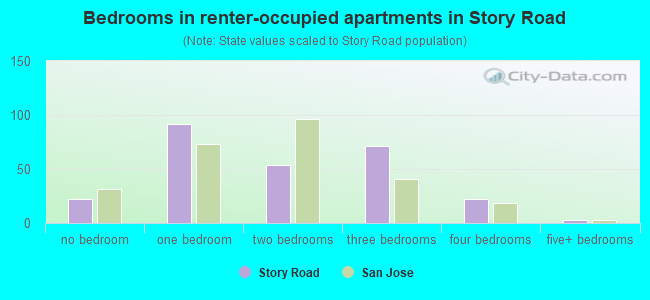
- Bedrooms in renter-occupied apartments in Story Road
- 22no bedroom
- 921 bedroom
- 542 bedrooms
- 713 bedrooms
- 224 bedrooms
- 35+ bedrooms
Average number of cars or other vehicles available in houses/condos:
Average number of cars or other vehicles available in apartments:
| This neighborhood: | 2.7 |
| San Jose: | 2.3 |
Average number of cars or other vehicles available in apartments:
| Here: | 2.3 |
| city: | 1.6 |
Percentage of units with a mortgage:
| Story Road: | 74.1% |
| San Jose: | 66.9% |
Average estimated value of detached houses in 2022 (66.0% of all units):
| Story Road: | $917,482 |
| San Jose: | $1,532,815 |
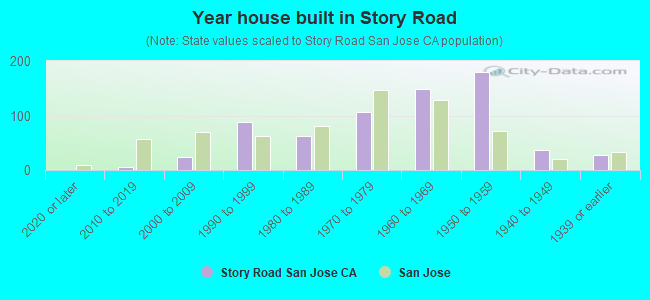
- Year house built in Story Road
- 02020 or later
- 62010 to 2019
- 232000 to 2009
- 881990 to 1999
- 631980 to 1989
- 1071970 to 1979
- 1481960 to 1969
- 1791950 to 1959
- 361940 to 1949
- 281939 or earlier
City-data.com crime index for city in 2020 (higher means more crime):
| City: | 268.4 |
| U.S. average: | 219.5 |
Travel time to work (commute)
![Travel time to work (commute)]()
- 11Less than 5 minutes
- 255 to 9 minutes
- 8010 to 14 minutes
- 13115 to 19 minutes
- 17220 to 24 minutes
- 4425 to 29 minutes
- 15530 to 34 minutes
- 1435 to 39 minutes
- 3740 to 44 minutes
- 10945 to 59 minutes
- 4760 to 89 minutes
- 2890 or more minutes

Means of transportation to work
![Means of transportation to work]()
- 71.5%906Drove a car alone
- 16.3%206Carpooled
- 3.2%40Bus
- 1.1%14Long-distance train or commuter rail
- 0.5%6Light rail, streetcar or trolley
- 0.6%8Taxi
- 2.5%32Bicycle
- 1.4%18Walked
- 2.9%37Other means
- 5.2%66Worked at home

Time leaving home to go to work
![Time leaving home to go to work]()
- 4812:00 a.m. to 4:59 a.m.
- 465:00 a.m. to 5:29 a.m.
- 525:30 a.m. to 5:59 a.m.
- 776:00 a.m. to 6:29 a.m.
- 556:30 a.m. to 6:59 a.m.
- 937:00 a.m. to 7:29 a.m.
- 667:30 a.m. to 7:59 a.m.
- 948:00 a.m. to 8:29 a.m.
- 598:30 a.m. to 8:59 a.m.
- 589:00 a.m. to 9:59 a.m.
- 3810:00 a.m. to 10:59 a.m.
- 911:00 a.m. to 11:59 a.m.
- 7912:00 p.m. to 3:59 p.m.
- 324:00 p.m. to 11:59 p.m.

Occupations of males:
- Percentage of males in management occupations (except farmers):
Here: 2.2% city: 13.0%
- Percentage of males in business and financial operations occupations:
Here: 1.1% city: 4.6%
- Percentage of males in computer and mathematical occupations:
Here: 4.0% city: 13.6%
- Percentage of males in architecture and engineering occupations:
Here: 2.5% city: 10.2%
- Percentage of males in life, physical, and social science occupations:
Here: 1.7% city: 1.1%
- Percentage of males in education, training, and library occupations:
Here: 1.1% city: 2.8%
- Percentage of males in service occupations:
Here: 31.3% city: 12.7%
- Percentage of males in sales and office occupations:
Here: 17.8% city: 12.8%
- Percentage of males in construction, extraction, and maintenance occupations:
Here: 16.5% city: 7.8%
- Percentage of males in production occupations:
Here: 8.5% city: 5.5%
- Percentage of males in transportation occupations:
Here: 3.4% city: 3.6%
- Percentage of males in material moving occupations:
Here: 4.8% city: 3.1%
Occupations of females:
- Percentage of females in management occupations (except farmers):
Here: 6.3% city: 11.0%
- Percentage of females in business and financial operations occupations:
Here: 6.6% city: 8.6%
- Percentage of females in computer and mathematical occupations:
Here: 1.1% city: 5.4%
- Percentage of females in architecture and engineering occupations:
Here: 1.1% city: 2.8%
- Percentage of females in community and social services occupations:
Here: 4.3% city: 1.8%
- Percentage of females in education, training, and library occupations:
Here: 1.9% city: 8.1%
- Percentage of females in healthcare practitioners and technical occupations:
Here: 6.9% city: 6.8%
- Percentage of females in service occupations:
Here: 44.0% city: 21.7%
- Percentage of females in sales and office occupations:
Here: 22.3% city: 22.0%
- Percentage of females in production occupations:
Here: 3.4% city: 4.0%
Percentage of people 16-64 in Armed Forces:
| Story Road: | 0.3% |
| San Jose: | 0.0% |
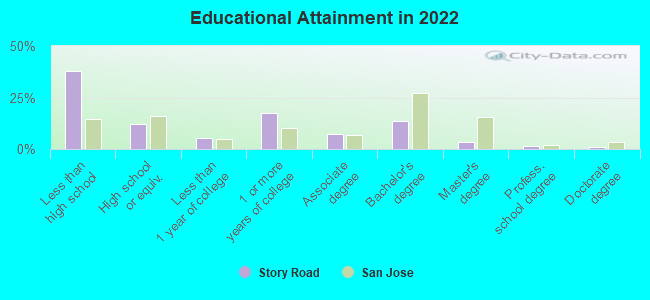
Education in this neighborhood (subdivision or community):
- Percentage of people 3 years and older in K-12 schools:
Story Road: 19.1% San Jose: 16.1%
- Percentage of people 3 years and older in undergraduate colleges:
Story Road: 8.8% San Jose: 6.5%
- Percentage of people 3 years and older in grad. or professional schools:
Story Road: 1.5% San Jose: 2.0%
- Percentage of students K-12 enrolled in private schools:
Story Road: 35.0% San Jose: 14.9%
Percentage of population below poverty level:
| Story Road: | 9.5% |
| San Jose: | 9.0% |
Median year owner moved in (as recorded in 2022):
Median year renter moved in (as recorded in 2022):
| Story Road: | 2953 |
| San Jose: | 2008 |
Median year renter moved in (as recorded in 2022):
| Story Road: | 2969 |
| San Jose: | 2020 |
Percentage of married-couple families with both working:
| Story Road: | 68.6% |
| San Jose: | 72.5% |

- 48.5%Utility gas
- 39.8%Electricity
- 4.8%No fuel used
- 2.9%Bottled, tank, or LP gas
- 2.9%Solar energy
- 1.1%Wood
Limited-access highways (interstate or state) in this neighborhood:
E Capitol Expy (Capitol Expy)
Length: 0.03 miles
Directions: N-S, SE-NW
Address range: 900 to 1099
Directions: N-S, SE-NW
Address range: 900 to 1099
Roads and streets:
Story Rd
Length: 2.02 miles
Direction: SW-NE
Address range: 1551 to 2999
Direction: SW-NE
Address range: 1551 to 2999
Sleepy Hollow Ln
Length: 0.24 miles
Directions: E-W, SW-NE
Address range: 2300 to 2549
Directions: E-W, SW-NE
Address range: 2300 to 2549
Angie Ave
Length: 0.22 miles
Direction: SW-NE
Address range: 2100 to 2299
Direction: SW-NE
Address range: 2100 to 2299
Poco Way
Length: 0.17 miles
Directions: N-S, SW-NE
Address range: 1800 to 1999
Directions: N-S, SW-NE
Address range: 1800 to 1999
S Jackson Ave
Length: 0.06 miles
Direction: SE-NW
Address range: 1000 to 1199
Direction: SE-NW
Address range: 1000 to 1199
Diana Ave
Length: 0.06 miles
Direction: SE-NW
Address range: 981 to 999
Direction: SE-NW
Address range: 981 to 999
S Sunset Ave
Length: 0.06 miles
Direction: SE-NW
Address range: 1072 to 1099
Direction: SE-NW
Address range: 1072 to 1099
Galahad Ave
Length: 0.06 miles
Direction: SE-NW
Address range: 1000 to 1099
Direction: SE-NW
Address range: 1000 to 1099
Mc Creery Ave
Length: 0.06 miles
Direction: SE-NW
Address range: 1092 to 1099
Direction: SE-NW
Address range: 1092 to 1099
Other features:
Silver Crk
Length: 0.04 miles
Direction: SE-NW
Direction: SE-NW