The Point (Point) neighborhood in Salem, Massachusetts (MA), 01970 detailed profile
Settings
X


Business Search - 14 Million verified businesses
Area: 0.191 square miles
Population: 2,354
Population density:
| The Point (Point): | 12,355 people per square mile |
| Salem: | 5,496 people per square mile |

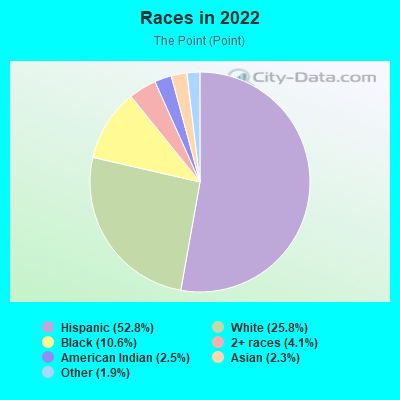
- 1,31352.8%Hispanic or Latino
- 64125.8%White
- 26410.6%Black
- 1024.1%Two or more races
- 632.5%American Indian
- 562.3%Asian
- 471.9%Some other race
Distribution of median household income
![Distribution of median household income]()
- 185Less than $10,000
- 180$10,000 to $19,999
- 122$20,000 to $29,999
- 85$30,000 to $39,999
- 75$40,000 to $49,999
- 43$50,000 to $59,999
- 118$60,000 to $74,999
- 101$75,000 to $99,999
- 116$100,000 to $124,999
- 31$125,000 to $149,999
- 69$150,000 to $199,999
- 99$200,000 or more

Distribution of owner-occupied house/condo value
![Distribution of owner-occupied house/condo value]()
- 202Less than $50,000
- 26$150,000 to $199,999
- 17$200,000 to $249,999
- 40$250,000 to $299,999
- 49$300,000 to $399,999
- 68$400,000 to $499,999
- 61$500,000 to $749,999
- 31$750,000 to $999,999
- 48$1,000,000 or more

Distribution of rent paid by renters
![Distribution of rent paid by renters]()
- 8$100 to $199
- 47$200 to $299
- 20$300 to $399
- 241$400 to $499
- 72$500 to $599
- 105$600 to $699
- 23$800 to $899
- 39$900 to $999
- 188$1,000 to $1,249
- 174$1,250 to $1,499
- 222$1,500 to $1,999
- 197$2,000 or more

Median rent in 2022:
| The Point (Point): | $1,390 |
| Salem: | $1,527 |
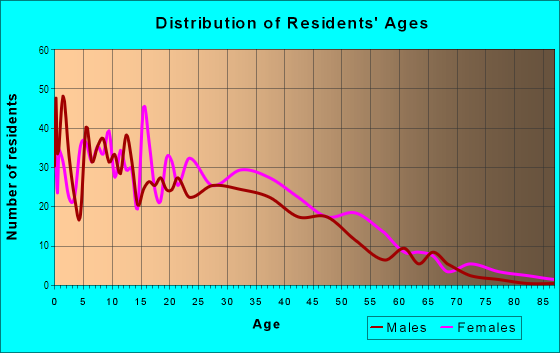
| Males: | 1,116 |
| Females: | 1,237 |
Males:
| This neighborhood: | 35.9 years |
| Whole city: | 36.3 years |
| This neighborhood: | 46.7 years |
| Whole city: | 40.1 years |
Average household size:
| The Point (Point): | 1.9 people |
| Salem: | 2.2 people |
Percentage of family households:
| The Point (Point): | 42.3% |
| Salem: | 38.9% |
| Here: | 22.5% |
| Salem: | 35.2% |
Percentage of married-couple families with children (among all households):
| The Point (Point): | 8.8% |
| Salem: | 26.9% |
Percentage of single-mother households (among all households):
| The Point (Point): | 37.9% |
| Salem: | 16.2% |
Percentage of never married males 15 years old and over:
Percentage of never married females 15 years old and over:
| The Point (Point): | 22.9% |
| Salem: | 19.3% |
Percentage of never married females 15 years old and over:
| The Point (Point): | 24.4% |
| city: | 24.8% |
Percentage of people that speak English not well or not at all:
| The Point (Point): | 19.2% |
| Salem: | 5.1% |
Percentage of people born in this state:
Percentage of people born in another U.S. state:
Percentage of native residents but born outside the U.S.:
Percentage of foreign born residents:
| Here: | 53.4% |
| Salem: | 61.2% |
Percentage of people born in another U.S. state:
| The Point (Point): | 21.1% |
| Salem: | 21.4% |
Percentage of native residents but born outside the U.S.:
| Here: | 3.1% |
| city: | 2.7% |
Percentage of foreign born residents:
| Here: | 22.4% |
| Salem: | 14.7% |
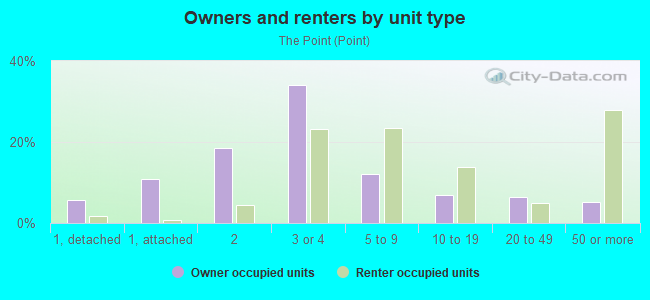
Owner-occupied
Renter-occupied

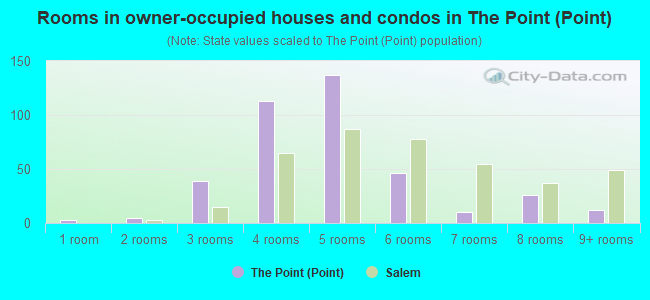
- Rooms in owner-occupied houses and condos in The Point <
> - 31 room
- 52 rooms
- 393 rooms
- 1134 rooms
- 1375 rooms
- 466 rooms
- 107 rooms
- 268 rooms
- 129+ rooms
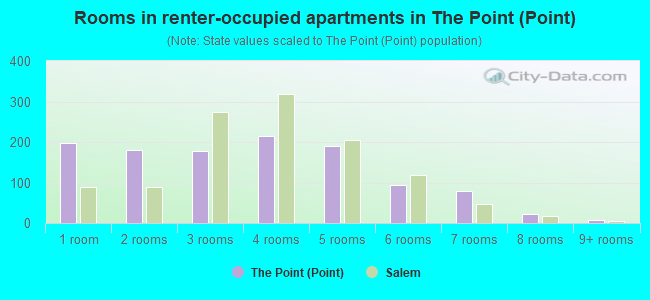
- Rooms in renter-occupied apartments in The Point <
> - 1981 room
- 1812 rooms
- 1773 rooms
- 2154 rooms
- 1915 rooms
- 936 rooms
- 797 rooms
- 228 rooms
- 89+ rooms
Owner-occupied
Renter-occupied
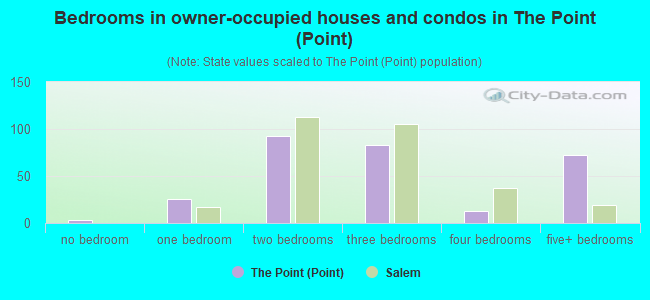
- Bedrooms in owner-occupied houses and condos in The Point <
> - 3no bedroom
- 261 bedroom
- 932 bedrooms
- 833 bedrooms
- 134 bedrooms
- 725+ bedrooms
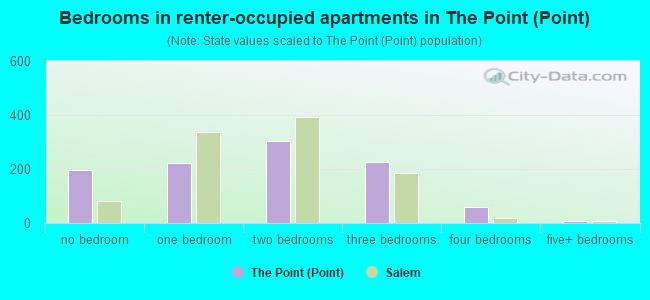
- Bedrooms in renter-occupied apartments in The Point <
> - 198no bedroom
- 2231 bedroom
- 3042 bedrooms
- 2273 bedrooms
- 604 bedrooms
- 85+ bedrooms
Average number of cars or other vehicles available in houses/condos:
Average number of cars or other vehicles available in apartments:
| This neighborhood: | 1.5 |
| Salem: | 1.6 |
Average number of cars or other vehicles available in apartments:
| Here: | 0.5 |
| city: | 1.0 |
Percentage of units with a mortgage:
| The Point (Point): | 73.2% |
| Salem: | 73.6% |
Housing prices:
- Average estimated value of detached houses in 2022 (4.0% of all units):
The Point (Point): $157,274 Massachusetts: $651,570
- Average estimated value of townhouses or other attached units in 2022 (1.5% of all units):
This neighborhood: $669,756 Massachusetts: $617,749
- Average estimated value of housing units in 2-unit structures in 2022 (11.7% of all units):
This neighborhood: $106,363 Massachusetts: $594,808
- Average estimated '22 value of housing units in 3-to-4-unit structures (28.5% of all units):
The Point (Point): $159,516 Massachusetts: $601,912
- Average estimated '22 value of housing units in 5-or-more-unit structures (28.6% of all units):
The Point (Point): $141,995 Massachusetts: $555,768
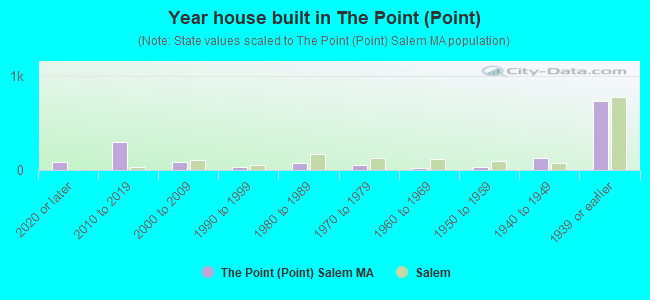
- Year house built in The Point <
> - 902020 or later
- 2942010 to 2019
- 872000 to 2009
- 351990 to 1999
- 791980 to 1989
- 561970 to 1979
- 201960 to 1969
- 341950 to 1959
- 1261940 to 1949
- 7351939 or earlier
City-data.com crime index for city in 2020 (higher means more crime):
| City: | 147.2 |
| U.S. average: | 219.5 |
Travel time to work (commute)
![Travel time to work (commute)]()
- 63Less than 5 minutes
- 735 to 9 minutes
- 11210 to 14 minutes
- 14215 to 19 minutes
- 15520 to 24 minutes
- 8225 to 29 minutes
- 12130 to 34 minutes
- 6135 to 39 minutes
- 6140 to 44 minutes
- 3845 to 59 minutes
- 7760 to 89 minutes
- 3190 or more minutes

Means of transportation to work
![Means of transportation to work]()
- 58.6%682Drove a car alone
- 8.6%100Carpooled
- 2.9%34Bus
- 4.3%50Long-distance train or commuter rail
- 9.0%105Taxi
- 0.5%6Bicycle
- 9.4%109Walked
- 2.5%29Other means
- 15.1%176Worked at home

Time leaving home to go to work
![Time leaving home to go to work]()
- 3812:00 a.m. to 4:59 a.m.
- 95:00 a.m. to 5:29 a.m.
- 245:30 a.m. to 5:59 a.m.
- 666:00 a.m. to 6:29 a.m.
- 646:30 a.m. to 6:59 a.m.
- 2037:00 a.m. to 7:29 a.m.
- 1287:30 a.m. to 7:59 a.m.
- 928:00 a.m. to 8:29 a.m.
- 518:30 a.m. to 8:59 a.m.
- 989:00 a.m. to 9:59 a.m.
- 3710:00 a.m. to 10:59 a.m.
- 1211:00 a.m. to 11:59 a.m.
- 7512:00 p.m. to 3:59 p.m.
- 724:00 p.m. to 11:59 p.m.

Occupations of males:
- Percentage of males in management occupations (except farmers):
Here: 7.7% city: 13.6%
- Percentage of males in business and financial operations occupations:
Here: 1.4% city: 9.0%
- Percentage of males in computer and mathematical occupations:
Here: 2.1% city: 5.8%
- Percentage of males in community and social services occupations:
Here: 1.0% city: 1.6%
- Percentage of males in legal occupations:
Here: 3.4% city: 1.3%
- Percentage of males in education, training, and library occupations:
Here: 2.1% city: 7.0%
- Percentage of males in arts, design, entertainment, sports, and media occupations:
Here: 1.4% city: 2.0%
- Percentage of males in healthcare practitioners and technical occupations:
Here: 1.8% city: 2.8%
- Percentage of males in service occupations:
Here: 30.2% city: 15.1%
- Percentage of males in sales and office occupations:
Here: 25.4% city: 15.8%
- Percentage of males in construction, extraction, and maintenance occupations:
Here: 5.3% city: 4.9%
- Percentage of males in production occupations:
Here: 1.1% city: 3.1%
- Percentage of males in material moving occupations:
Here: 13.4% city: 4.1%
Occupations of females:
- Percentage of females in management occupations (except farmers):
Here: 5.0% city: 12.1%
- Percentage of females in business and financial operations occupations:
Here: 3.1% city: 7.6%
- Percentage of females in architecture and engineering occupations:
Here: 9.6% city: 0.7%
- Percentage of females in life, physical, and social science occupations:
Here: 2.5% city: 1.6%
- Percentage of females in community and social services occupations:
Here: 3.0% city: 2.9%
- Percentage of females in education, training, and library occupations:
Here: 6.0% city: 10.4%
- Percentage of females in service occupations:
Here: 45.1% city: 21.0%
- Percentage of females in sales and office occupations:
Here: 16.4% city: 25.7%
- Percentage of females in production occupations:
Here: 4.2% city: 3.1%
- Percentage of females in transportation occupations:
Here: 1.0% city: 0.8%
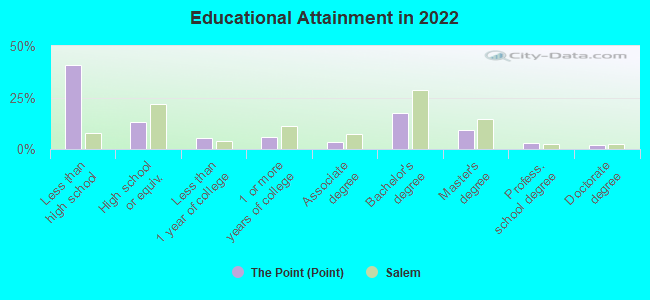
Education in this neighborhood (subdivision or community):
- Percentage of people 3 years and older in K-12 schools:
The Point (Point): 34.2% Salem: 10.1%
- Percentage of people 3 years and older in undergraduate colleges:
The Point (Point): 7.4% Salem: 7.7%
- Percentage of people 3 years and older in grad. or professional schools:
The Point (Point): 1.8% Salem: 1.7%
- Percentage of students K-12 enrolled in private schools:
The Point (Point): 0.0% Salem: 13.9%
Percentage of population below poverty level:
| The Point (Point): | 30.9% |
| Salem: | 13.7% |
Median year owner moved in (as recorded in 2022):
Median year renter moved in (as recorded in 2022):
| The Point (Point): | 2008 |
| Salem: | 2010 |
Median year renter moved in (as recorded in 2022):
| The Point (Point): | 2016 |
| Salem: | 2015 |
Percentage of married-couple families with both working:
| The Point (Point): | 145.5% |
| Salem: | 78.5% |
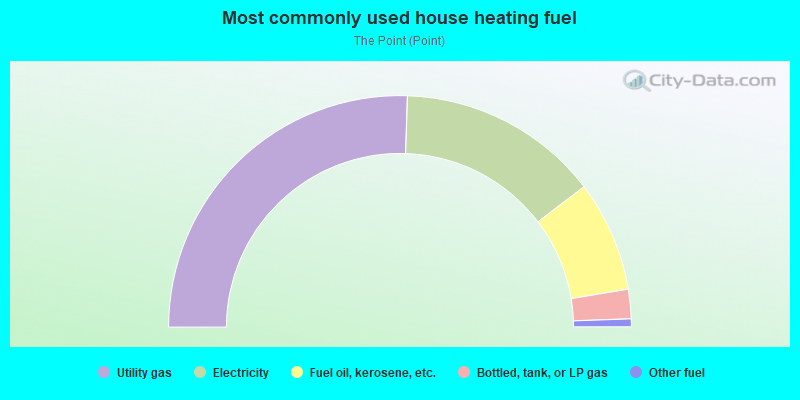
- 51.0%Utility gas
- 28.2%Electricity
- 15.5%Fuel oil, kerosene, etc.
- 4.1%Bottled, tank, or LP gas
- 1.1%Other fuel
Highways in this neighborhood:
Derby St (US Hwy 1 Alt)
Length: 0.40 miles
Directions: E-W, SW-NE
Address range: 179 to 399
Directions: E-W, SW-NE
Address range: 179 to 399
Lafayette St (State Hwy 114, US Hwy 1 Alt)
Length: 0.35 miles
Direction: N-S
Address range: 73 to 191
Direction: N-S
Address range: 73 to 191
Roads and streets:
Congress St
Length: 0.40 miles
Directions: N-S, SE-NW
Address range: 1 to 199
Directions: N-S, SE-NW
Address range: 1 to 199
Palmer St
Length: 0.34 miles
Direction: E-W
Address range: 1 to 99
Direction: E-W
Address range: 1 to 99
Leavitt St
Length: 0.34 miles
Direction: E-W
Address range: 1 to 99
Direction: E-W
Address range: 1 to 99
Peabody St
Length: 0.26 miles
Direction: E-W
Address range: 1 to 99
Direction: E-W
Address range: 1 to 99
Ward St
Length: 0.26 miles
Direction: E-W
Address range: 1 to 99
Direction: E-W
Address range: 1 to 99
Harbor St
Length: 0.26 miles
Direction: E-W
Address range: 11 to 99
Direction: E-W
Address range: 11 to 99
Dow St
Length: 0.24 miles
Direction: E-W
Address range: 1 to 99
Direction: E-W
Address range: 1 to 99
Salem St
Length: 0.21 miles
Direction: N-S
Address range: 1 to 72
Direction: N-S
Address range: 1 to 72
Prince St
Length: 0.20 miles
Direction: N-S
Address range: 1 to 55
Direction: N-S
Address range: 1 to 55
Pingree St
Length: 0.16 miles
Direction: N-S
Address range: 1 to 99
Direction: N-S
Address range: 1 to 99
Perkins St
Length: 0.16 miles
Direction: N-S
Address range: 1 to 99
Direction: N-S
Address range: 1 to 99
Park St
Length: 0.14 miles
Direction: N-S
Address range: 1 to 99
Direction: N-S
Address range: 1 to 99
Lynch St
Length: 0.12 miles
Direction: E-W
Address range: 1 to 99
Direction: E-W
Address range: 1 to 99
Wharf St
Length: 0.12 miles
Directions: E-W, N-S, SE-NW, SW-NE
Address range: 1 to 199
Directions: E-W, N-S, SE-NW, SW-NE
Address range: 1 to 199
Union St
Length: 0.09 miles
Directions: E-W, N-S, SE-NW
Address range: 44 to 99
Directions: E-W, N-S, SE-NW
Address range: 44 to 99
Harrison Ave
Length: 0.07 miles
Direction: N-S
Address range: 1 to 99
Direction: N-S
Address range: 1 to 99
Naumkeag St
Length: 0.06 miles
Direction: N-S
Address range: 1 to 99
Direction: N-S
Address range: 1 to 99
Prince Street Pl
Length: 0.05 miles
Direction: E-W
Address range: 1 to 99
Direction: E-W
Address range: 1 to 99
Other features:
Salem Harbor Strm
Length: 0.02 miles
Direction: E-W
Direction: E-W