Town Center neighborhood in Woodridge, Illinois (IL), 60517 detailed profile
Settings
X


Business Search - 14 Million verified businesses
Area: 0.279 square miles
Population: 275
Population density:
| Town Center: | 987 people per square mile |
| Woodridge: | 4,088 people per square mile |

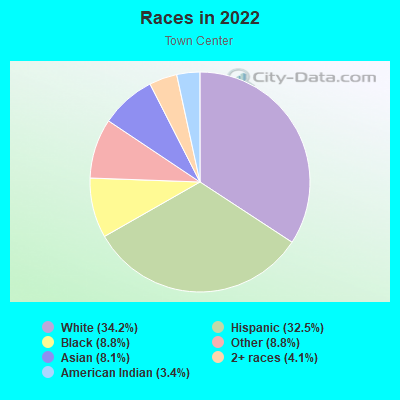
- 10134.2%White
- 9632.5%Hispanic or Latino
- 268.8%Black
- 268.8%Some other race
- 248.1%Asian
- 124.1%Two or more races
- 103.4%American Indian

Median household income in 2022:
| Town Center: | $88,133 |
| Woodridge: | $95,756 |
Distribution of median household income
![Distribution of median household income]()
- 17Less than $10,000
- 8$10,000 to $19,999
- 22$20,000 to $29,999
- 10$30,000 to $39,999
- 59$40,000 to $49,999
- 12$50,000 to $59,999
- 8$60,000 to $74,999
- 8$75,000 to $99,999
- 16$100,000 to $124,999
- 9$125,000 to $149,999
- 8$150,000 to $199,999
- 8$200,000 or more

Distribution of owner-occupied house/condo value
![Distribution of owner-occupied house/condo value]()
- 3Less than $50,000
- 1$50,000 to $99,999
- 22$100,000 to $149,999
- 34$150,000 to $199,999
- 4$200,000 to $249,999
- 23$250,000 to $299,999
- 22$300,000 to $399,999
- 4$400,000 to $499,999
- 8$500,000 to $749,999
- 28$750,000 to $999,999
- 2$1,000,000 or more

Distribution of rent paid by renters
![Distribution of rent paid by renters]()
- 11Less than $100
- 3$100 to $199
- 9$300 to $399
- 8$400 to $499
- 5$500 to $599
- 4$600 to $699
- 12$900 to $999
- 8$1,000 to $1,249
- 9$1,250 to $1,499
- 7$1,500 to $1,999
- 8$2,000 or more

| Males: | 119 |
| Females: | 156 |
Males:
| This neighborhood: | 36.7 years |
| Whole city: | 35.9 years |
| This neighborhood: | 43.3 years |
| Whole city: | 39.0 years |
Average household size:
| Town Center: | 2.5 people |
| Woodridge: | 2.6 people |
Percentage of family households:
| Town Center: | 43.1% |
| Woodridge: | 53.0% |
| Here: | 47.8% |
| Woodridge: | 52.6% |
Percentage of married-couple families with children (among all households):
| Town Center: | 42.5% |
| Woodridge: | 29.9% |
Percentage of single-mother households (among all households):
| Town Center: | 15.3% |
| Woodridge: | 5.7% |
Percentage of never married males 15 years old and over:
Percentage of never married females 15 years old and over:
| Town Center: | 12.3% |
| Woodridge: | 19.2% |
Percentage of never married females 15 years old and over:
| Town Center: | 14.3% |
| village: | 13.8% |
Percentage of people that speak English not well or not at all:
| Town Center: | 14.3% |
| Woodridge: | 3.4% |
Percentage of people born in this state:
Percentage of people born in another U.S. state:
Percentage of native residents but born outside the U.S.:
Percentage of foreign born residents:
| Here: | 70.5% |
| Woodridge: | 65.1% |
Percentage of people born in another U.S. state:
| Town Center: | 15.9% |
| Woodridge: | 12.4% |
Percentage of native residents but born outside the U.S.:
| Here: | 0.2% |
| village: | 1.4% |
Percentage of foreign born residents:
| Here: | 13.4% |
| Woodridge: | 21.0% |
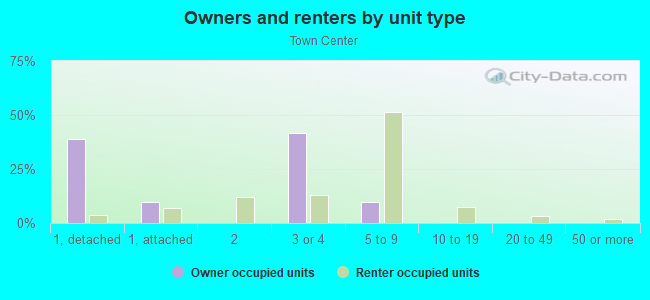
Owner-occupied
Renter-occupied

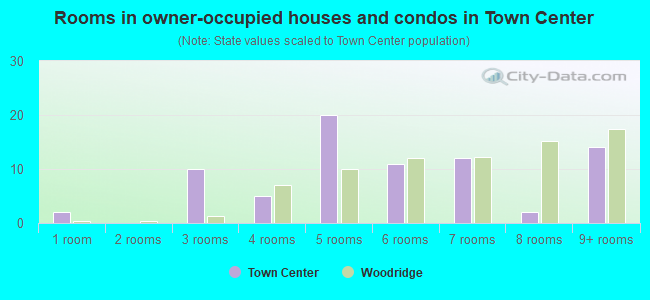
- Rooms in owner-occupied houses and condos in Town Center
- 21 room
- 02 rooms
- 103 rooms
- 54 rooms
- 205 rooms
- 116 rooms
- 127 rooms
- 28 rooms
- 149+ rooms
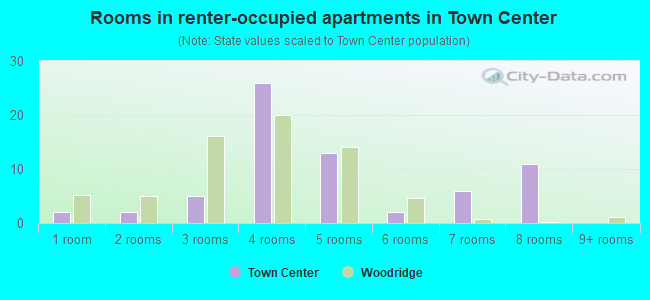
- Rooms in renter-occupied apartments in Town Center
- 21 room
- 22 rooms
- 53 rooms
- 264 rooms
- 135 rooms
- 26 rooms
- 67 rooms
- 118 rooms
- 09+ rooms
Owner-occupied
Renter-occupied
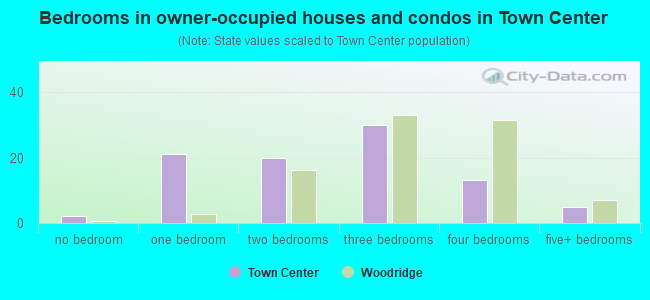
- Bedrooms in owner-occupied houses and condos in Town Center
- 2no bedroom
- 211 bedroom
- 202 bedrooms
- 303 bedrooms
- 134 bedrooms
- 55+ bedrooms
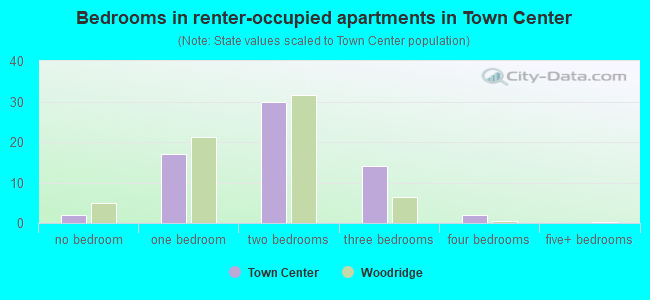
- Bedrooms in renter-occupied apartments in Town Center
- 2no bedroom
- 171 bedroom
- 302 bedrooms
- 143 bedrooms
- 24 bedrooms
- 05+ bedrooms
Average number of cars or other vehicles available in houses/condos:
Average number of cars or other vehicles available in apartments:
| This neighborhood: | 1.6 |
| Woodridge: | 2.0 |
Average number of cars or other vehicles available in apartments:
| Here: | 1.0 |
| village: | 1.4 |
Percentage of units with a mortgage:
| Town Center: | 65.7% |
| Woodridge: | 71.0% |
Housing prices:
- Average estimated value of detached houses in 2022 (39.3% of all units):
Town Center: $309,787 Woodridge: $391,152
- Average estimated value of townhouses or other attached units in 2022 (9.4% of all units):
This neighborhood: $134,743 village: $308,432
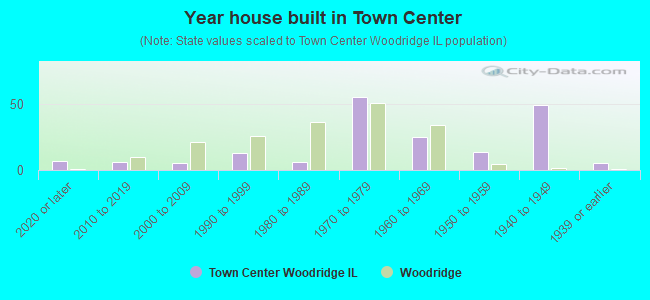
- Year house built in Town Center
- 72020 or later
- 62010 to 2019
- 52000 to 2009
- 131990 to 1999
- 61980 to 1989
- 551970 to 1979
- 251960 to 1969
- 141950 to 1959
- 491940 to 1949
- 51939 or earlier
City-data.com crime index for village in 2020 (higher means more crime):
| City: | 81.7 |
| U.S. average: | 219.5 |
Travel time to work (commute)
![Travel time to work (commute)]()
- 2Less than 5 minutes
- 95 to 9 minutes
- 3810 to 14 minutes
- 4315 to 19 minutes
- 2320 to 24 minutes
- 1725 to 29 minutes
- 1130 to 34 minutes
- 835 to 39 minutes
- 1040 to 44 minutes
- 2345 to 59 minutes
- 2460 to 89 minutes
- 590 or more minutes

Means of transportation to work
![Means of transportation to work]()
- 68.4%66Drove a car alone
- 17.6%17Carpooled
- 5.2%5Long-distance train or commuter rail
- 4.1%4Ferryboat
- 2.1%2Taxi
- 3.1%3Bicycle
- 9.3%9Walked
- 3.1%3Worked at home

Time leaving home to go to work
![Time leaving home to go to work]()
- 812:00 a.m. to 4:59 a.m.
- 35:00 a.m. to 5:29 a.m.
- 135:30 a.m. to 5:59 a.m.
- 246:00 a.m. to 6:29 a.m.
- 176:30 a.m. to 6:59 a.m.
- 247:00 a.m. to 7:29 a.m.
- 197:30 a.m. to 7:59 a.m.
- 208:00 a.m. to 8:29 a.m.
- 158:30 a.m. to 8:59 a.m.
- 209:00 a.m. to 9:59 a.m.
- 510:00 a.m. to 10:59 a.m.
- 211:00 a.m. to 11:59 a.m.
- 2212:00 p.m. to 3:59 p.m.
- 94:00 p.m. to 11:59 p.m.

Occupations of males:
- Percentage of males in management occupations (except farmers):
Here: 4.2% village: 10.4%
- Percentage of males in business and financial operations occupations:
Here: 1.2% village: 7.0%
- Percentage of males in architecture and engineering occupations:
Here: 17.0% village: 5.0%
- Percentage of males in education, training, and library occupations:
Here: 4.6% village: 4.5%
- Percentage of males in arts, design, entertainment, sports, and media occupations:
Here: 4.9% village: 0.8%
- Percentage of males in service occupations:
Here: 24.4% village: 8.7%
- Percentage of males in sales and office occupations:
Here: 9.9% village: 18.6%
- Percentage of males in farming, fishing, and forestry occupations:
Here: 16.7% village: 1.2%
- Percentage of males in transportation occupations:
Here: 9.9% village: 7.2%
- Percentage of males in material moving occupations:
Here: 18.4% village: 6.5%
Occupations of females:
- Percentage of females in management occupations (except farmers):
Here: 21.5% village: 10.8%
- Percentage of females in business and financial operations occupations:
Here: 1.5% village: 9.3%
- Percentage of females in computer and mathematical occupations:
Here: 16.5% village: 1.7%
- Percentage of females in legal occupations:
Here: 6.0% village: 1.5%
- Percentage of females in education, training, and library occupations:
Here: 6.9% village: 9.6%
- Percentage of females in healthcare practitioners and technical occupations:
Here: 13.4% village: 11.6%
- Percentage of females in service occupations:
Here: 16.5% village: 14.9%
- Percentage of females in sales and office occupations:
Here: 23.0% village: 30.7%
- Percentage of females in production occupations:
Here: 16.0% village: 1.7%
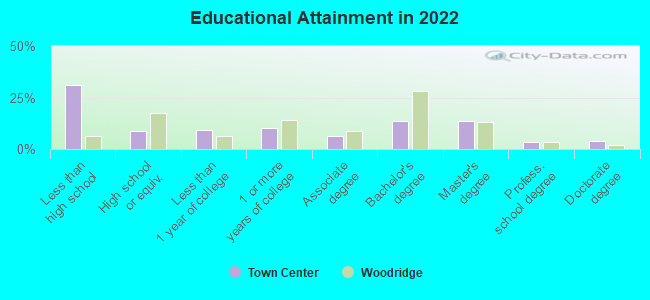
Education in this neighborhood (subdivision or community):
- Percentage of people 3 years and older in K-12 schools:
Town Center: 45.5% Woodridge: 17.3%
- Percentage of people 3 years and older in undergraduate colleges:
Town Center: 2.4% Woodridge: 4.5%
- Percentage of people 3 years and older in grad. or professional schools:
Town Center: 2.0% Woodridge: 2.1%
- Percentage of students K-12 enrolled in private schools:
Town Center: 57.4% Woodridge: 10.1%
Percentage of population below poverty level:
| Town Center: | 5.0% |
| Woodridge: | 4.8% |
Median year owner moved in (as recorded in 2022):
| Town Center: | 2007 |
| Woodridge: | 2005 |
Percentage of married-couple families with both working:
| Town Center: | 50.1% |
| Woodridge: | 75.7% |
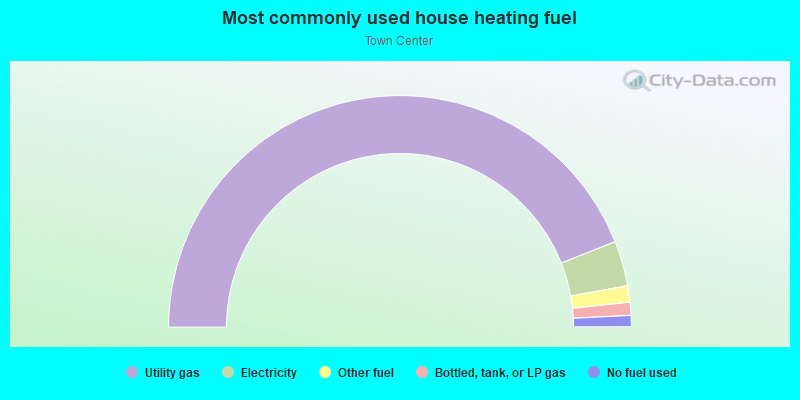
- 88.0%Utility gas
- 6.3%Electricity
- 2.3%Other fuel
- 1.8%Bottled, tank, or LP gas
- 1.6%No fuel used
Roads and streets:
Frontage Rd
Length: 0.75 miles
Directions: E-W, N-S, SE-NW
Directions: E-W, N-S, SE-NW
W 75th St
Length: 0.70 miles
Direction: E-W
Address range: 2512 to 2753
Direction: E-W
Address range: 2512 to 2753
Ravinia Ln
Length: 0.43 miles
Direction: E-W
Address range: 2500 to 2799
Direction: E-W
Address range: 2500 to 2799
Willow Ave
Length: 0.35 miles
Directions: E-W, N-S, SW-NE
Address range: 2500 to 7499
Directions: E-W, N-S, SW-NE
Address range: 2500 to 7499
Janes Ave
Length: 0.32 miles
Direction: N-S
Address range: 7200 to 7499
Direction: N-S
Address range: 7200 to 7499
Hawthorne Ave
Length: 0.29 miles
Directions: N-S, SE-NW
Address range: 7100 to 7499
Directions: N-S, SE-NW
Address range: 7100 to 7499
Catalpa Ave
Length: 0.24 miles
Directions: N-S, SW-NE
Address range: 7200 to 7449
Directions: N-S, SW-NE
Address range: 7200 to 7449
Sprucewood Ave
Length: 0.20 miles
Directions: E-W, N-S, SE-NW, SW-NE
Address range: 7100 to 7399
Directions: E-W, N-S, SE-NW, SW-NE
Address range: 7100 to 7399
Larchwood Ln
Length: 0.20 miles
Directions: N-S, SE-NW, SW-NE
Address range: 7200 to 7499
Directions: N-S, SE-NW, SW-NE
Address range: 7200 to 7499
Mohawk Ave
Length: 0.15 miles
Directions: E-W, SW-NE
Address range: 2400 to 2799
Directions: E-W, SW-NE
Address range: 2400 to 2799
Sioux Ave
Length: 0.15 miles
Directions: E-W, SW-NE
Address range: 2400 to 2499
Directions: E-W, SW-NE
Address range: 2400 to 2499
Chestnut Ave (Chestnut Ct)
Length: 0.10 miles
Direction: N-S
Address range: 7300 to 7499
Direction: N-S
Address range: 7300 to 7499
Seminole Ct
Length: 0.08 miles
Direction: N-S
Address range: 7400 to 7418
Direction: N-S
Address range: 7400 to 7418
Catalpa Ct
Length: 0.06 miles
Direction: E-W
Address range: 1 to 99
Direction: E-W
Address range: 1 to 99
Bonnie Ct
Length: 0.06 miles
Directions: N-S, SE-NW
Address range: 7200 to 7299
Directions: N-S, SE-NW
Address range: 7200 to 7299
Highland Ct
Length: 0.04 miles
Direction: SE-NW
Address range: 1 to 99
Direction: SE-NW
Address range: 1 to 99
Willow Ln
Length: 0.03 miles
Direction: SE-NW
Address range: 1 to 99
Direction: SE-NW
Address range: 1 to 99
75th St
Length: 0.00 miles
Direction: E-W
Direction: E-W