Tropico neighborhood in Glendale, California (CA), 91204 detailed profile
Settings
X


Business Search - 14 Million verified businesses
Area: 0.317 square miles
Population: 3,237
Population density:
| Tropico: | 10,196 people per square mile |
| Glendale: | 6,175 people per square mile |

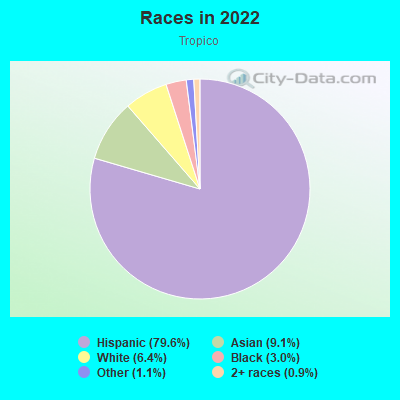
- 2,57479.6%Hispanic or Latino
- 2939.1%Asian
- 2066.4%White
- 963.0%Black
- 361.1%Some other race
- 300.9%Two or more races
Median household income in 2022:
| Tropico: | $56,630 |
| Glendale: | $77,483 |
Distribution of median household income
![Distribution of median household income]()
- 31Less than $10,000
- 26$10,000 to $19,999
- 117$20,000 to $29,999
- 125$30,000 to $39,999
- 91$40,000 to $49,999
- 141$50,000 to $59,999
- 113$60,000 to $74,999
- 70$75,000 to $99,999
- 76$100,000 to $124,999
- 43$125,000 to $149,999
- 58$150,000 to $199,999
- 50$200,000 or more

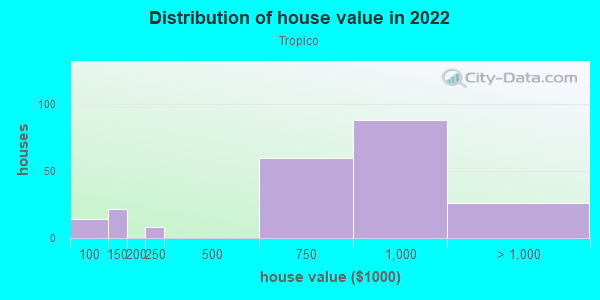
Distribution of owner-occupied house/condo value
![Distribution of owner-occupied house/condo value]()
- 14$50,000 to $99,999
- 22$100,000 to $149,999
- 8$200,000 to $249,999
- 60$500,000 to $749,999
- 88$750,000 to $999,999
- 26$1,000,000 or more
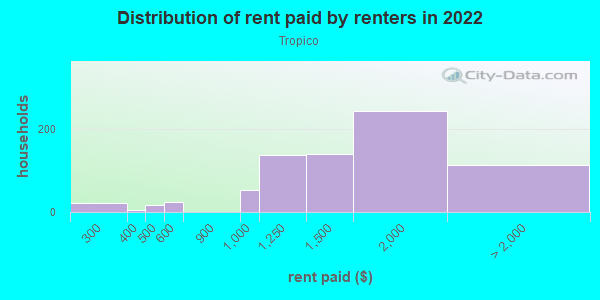
Distribution of rent paid by renters
![Distribution of rent paid by renters]()
- 21$200 to $299
- 4$300 to $399
- 17$400 to $499
- 23$500 to $599
- 54$900 to $999
- 138$1,000 to $1,249
- 140$1,250 to $1,499
- 243$1,500 to $1,999
- 113$2,000 or more
Median rent in 2022:
| Tropico: | $1,502 |
| Glendale: | $1,842 |
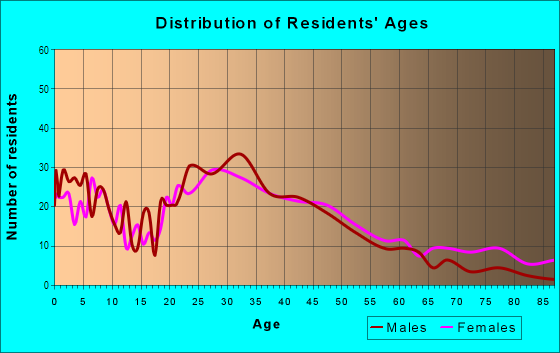
| Males: | 1,754 |
| Females: | 1,483 |
Males:
| This neighborhood: | 29.8 years |
| Whole city: | 41.8 years |
| This neighborhood: | 37.3 years |
| Whole city: | 43.4 years |
Average household size:
| Tropico: | 3.5 people |
| Glendale: | 2.5 people |
Percentage of family households:
| Tropico: | 61.2% |
| Glendale: | 40.0% |
| Here: | 53.6% |
| Glendale: | 44.2% |
Percentage of married-couple families with children (among all households):
| Tropico: | 24.0% |
| Glendale: | 30.5% |
Percentage of single-mother households (among all households):
| Tropico: | 4.9% |
| Glendale: | 7.0% |
Percentage of never married males 15 years old and over:
Percentage of never married females 15 years old and over:
| Tropico: | 24.8% |
| Glendale: | 18.4% |
Percentage of never married females 15 years old and over:
| Tropico: | 18.2% |
| city: | 18.3% |
Percentage of people that speak English not well or not at all:
| Tropico: | 13.3% |
| Glendale: | 12.5% |
Percentage of people born in this state:
Percentage of people born in another U.S. state:
Percentage of native residents but born outside the U.S.:
Percentage of foreign born residents:
| Here: | 48.4% |
| Glendale: | 38.0% |
Percentage of people born in another U.S. state:
| Tropico: | 7.5% |
| Glendale: | 11.6% |
Percentage of native residents but born outside the U.S.:
| Here: | 1.4% |
| city: | 1.5% |
Percentage of foreign born residents:
| Here: | 42.7% |
| Glendale: | 48.9% |
Owner-occupied
Renter-occupied

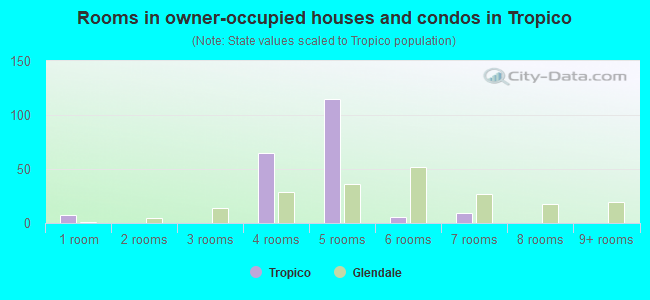
- Rooms in owner-occupied houses and condos in Tropico
- 71 room
- 02 rooms
- 03 rooms
- 654 rooms
- 1155 rooms
- 66 rooms
- 97 rooms
- 08 rooms
- 09+ rooms
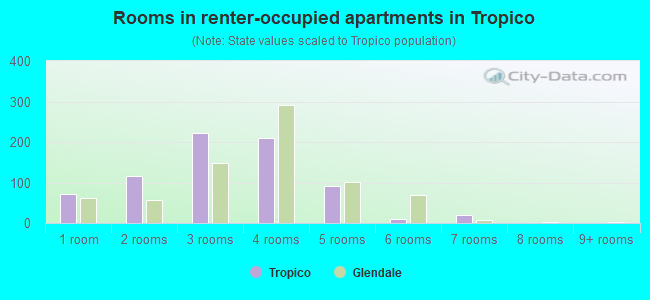
- Rooms in renter-occupied apartments in Tropico
- 721 room
- 1162 rooms
- 2223 rooms
- 2094 rooms
- 925 rooms
- 96 rooms
- 197 rooms
- 08 rooms
- 09+ rooms
Owner-occupied
Renter-occupied
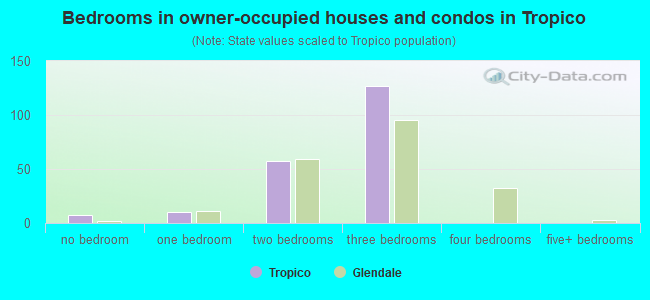
- Bedrooms in owner-occupied houses and condos in Tropico
- 7no bedroom
- 101 bedroom
- 572 bedrooms
- 1273 bedrooms
- 04 bedrooms
- 05+ bedrooms
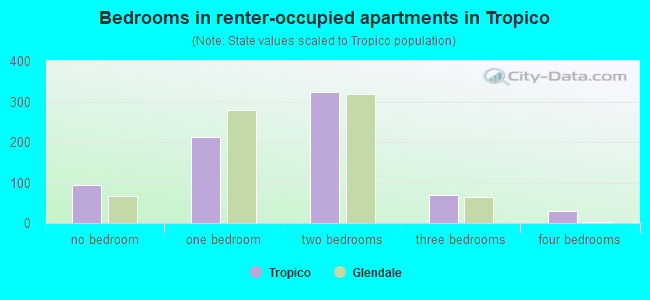
- Bedrooms in renter-occupied apartments in Tropico
- 95no bedroom
- 2131 bedroom
- 3242 bedrooms
- 693 bedrooms
- 304 bedrooms
- 05+ bedrooms
Average number of cars or other vehicles available in houses/condos:
Average number of cars or other vehicles available in apartments:
| This neighborhood: | 1.6 |
| Glendale: | 2.0 |
Average number of cars or other vehicles available in apartments:
| Here: | 1.7 |
| city: | 1.4 |
Percentage of units with a mortgage:
| Tropico: | 83.6% |
| Glendale: | 73.0% |
Housing prices:
- Average estimated value of detached houses in 2022 (36.3% of all units):
Tropico: $318,625 Glendale: $1,271,064
- Average estimated value of townhouses or other attached units in 2022 (8.4% of all units):
This neighborhood: $1,626,317 city: $684,321
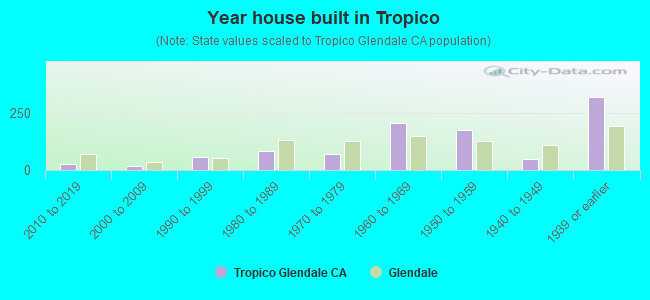
- Year house built in Tropico
- 02020 or later
- 282010 to 2019
- 162000 to 2009
- 561990 to 1999
- 811980 to 1989
- 681970 to 1979
- 2061960 to 1969
- 1741950 to 1959
- 491940 to 1949
- 3181939 or earlier

City-data.com crime index for city in 2020 (higher means more crime):
| City: | 110.5 |
| U.S. average: | 219.5 |
Travel time to work (commute)
![Travel time to work (commute)]()
- 10Less than 5 minutes
- 35 to 9 minutes
- 6410 to 14 minutes
- 11215 to 19 minutes
- 11020 to 24 minutes
- 2325 to 29 minutes
- 6230 to 34 minutes
- 2735 to 39 minutes
- 3740 to 44 minutes
- 3945 to 59 minutes
- 9360 to 89 minutes
- 9490 or more minutes

Means of transportation to work
![Means of transportation to work]()
- 52.9%765Drove a car alone
- 27.1%392Carpooled
- 8.4%121Bus
- 0.8%12Walked
- 0.7%10Other means
- 9.9%143Worked at home

Time leaving home to go to work
![Time leaving home to go to work]()
- 6512:00 a.m. to 4:59 a.m.
- 325:00 a.m. to 5:29 a.m.
- 395:30 a.m. to 5:59 a.m.
- 346:00 a.m. to 6:29 a.m.
- 1086:30 a.m. to 6:59 a.m.
- 297:00 a.m. to 7:29 a.m.
- 477:30 a.m. to 7:59 a.m.
- 1078:00 a.m. to 8:29 a.m.
- 338:30 a.m. to 8:59 a.m.
- 599:00 a.m. to 9:59 a.m.
- 610:00 a.m. to 10:59 a.m.
- 3111:00 a.m. to 11:59 a.m.
- 5312:00 p.m. to 3:59 p.m.
- 194:00 p.m. to 11:59 p.m.

Occupations of males:
- Percentage of males in management occupations (except farmers):
Here: 11.1% city: 12.9%
- Percentage of males in computer and mathematical occupations:
Here: 2.9% city: 5.2%
- Percentage of males in education, training, and library occupations:
Here: 2.9% city: 2.0%
- Percentage of males in arts, design, entertainment, sports, and media occupations:
Here: 6.5% city: 8.9%
- Percentage of males in service occupations:
Here: 27.1% city: 11.8%
- Percentage of males in sales and office occupations:
Here: 16.9% city: 18.3%
- Percentage of males in construction, extraction, and maintenance occupations:
Here: 7.1% city: 5.5%
- Percentage of males in production occupations:
Here: 10.4% city: 4.2%
- Percentage of males in transportation occupations:
Here: 8.0% city: 6.0%
- Percentage of males in material moving occupations:
Here: 6.3% city: 2.3%
Occupations of females:
- Percentage of females in management occupations (except farmers):
Here: 3.9% city: 10.3%
- Percentage of females in education, training, and library occupations:
Here: 5.4% city: 9.4%
- Percentage of females in arts, design, entertainment, sports, and media occupations:
Here: 3.4% city: 6.1%
- Percentage of females in healthcare practitioners and technical occupations:
Here: 7.1% city: 10.7%
- Percentage of females in service occupations:
Here: 35.2% city: 18.3%
- Percentage of females in sales and office occupations:
Here: 44.0% city: 26.5%
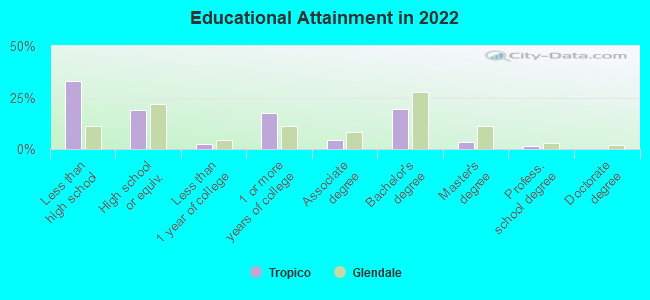
Education in this neighborhood (subdivision or community):
- Percentage of people 3 years and older in K-12 schools:
Tropico: 20.6% Glendale: 14.1%
- Percentage of people 3 years and older in undergraduate colleges:
Tropico: 8.0% Glendale: 5.2%
- Percentage of people 3 years and older in grad. or professional schools:
Tropico: 0.5% Glendale: 1.9%
- Percentage of students K-12 enrolled in private schools:
Tropico: 11.8% Glendale: 9.3%
Percentage of population below poverty level:
| Tropico: | 12.0% |
| Glendale: | 13.0% |
Median year owner moved in (as recorded in 2022):
Median year renter moved in (as recorded in 2022):
| Tropico: | 2004 |
| Glendale: | 2007 |
Median year renter moved in (as recorded in 2022):
| Tropico: | 2014 |
| Glendale: | 2018 |
Percentage of married-couple families with both working:
| Tropico: | 69.7% |
| Glendale: | 66.7% |
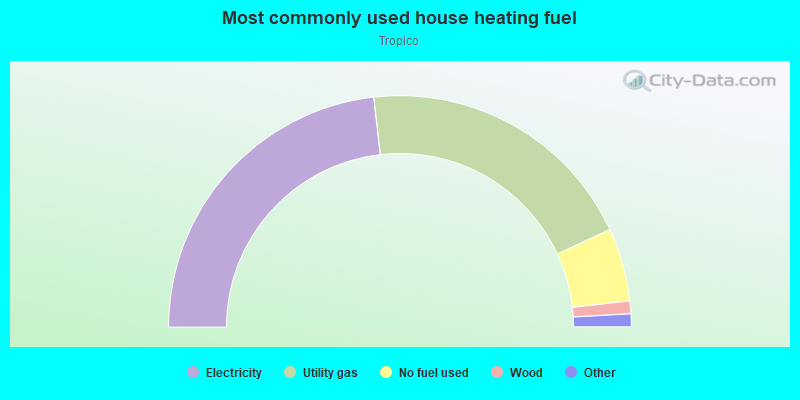
- 46.4%Electricity
- 39.8%Utility gas
- 10.2%No fuel used
- 1.8%Wood
- 1.0%Solar energy
- 0.8%Bottled, tank, or LP gas
Highways in this neighborhood:
San Fernando Rd
Length: 0.74 miles
Direction: SE-NW
Address range: 4004 to 4399
Direction: SE-NW
Address range: 4004 to 4399
Roads and streets:
Gardena Ave
Length: 0.76 miles
Directions: N-S, SE-NW
Address range: 1300 to 1999
Directions: N-S, SE-NW
Address range: 1300 to 1999
S Central Ave
Length: 0.54 miles
Directions: N-S, SW-NE
Address range: 1200 to 1699
Directions: N-S, SW-NE
Address range: 1200 to 1699
Magnolia Ave
Length: 0.50 miles
Directions: E-W, SW-NE
Address range: 148 to 499
Directions: E-W, SW-NE
Address range: 148 to 499
W Cypress St
Length: 0.46 miles
Directions: E-W, SW-NE
Address range: 112 to 499
Directions: E-W, SW-NE
Address range: 112 to 499
W Palmer Ave
Length: 0.44 miles
Direction: E-W
Address range: 252 to 499
Direction: E-W
Address range: 252 to 499
W Los Feliz Rd
Length: 0.34 miles
Directions: E-W, SW-NE
Address range: 119 to 429
Directions: E-W, SW-NE
Address range: 119 to 429
Vassar St
Length: 0.30 miles
Direction: SE-NW
Address range: 1800 to 1999
Direction: SE-NW
Address range: 1800 to 1999
W Cerritos Ave
Length: 0.20 miles
Directions: E-W, SW-NE
Address range: 218 to 371
Directions: E-W, SW-NE
Address range: 218 to 371
Los Angeles St
Length: 0.19 miles
Direction: SE-NW
Address range: 1200 to 1299
Direction: SE-NW
Address range: 1200 to 1299
S Orange St
Length: 0.18 miles
Direction: N-S
Address range: 1200 to 1399
Direction: N-S
Address range: 1200 to 1399
Railroad St
Length: 0.17 miles
Directions: SE-NW, SW-NE
Address range: 400 to 1799
Directions: SE-NW, SW-NE
Address range: 400 to 1799
S Brand Blvd
Length: 0.15 miles
Direction: SW-NE
Address range: 1800 to 1898
Direction: SW-NE
Address range: 1800 to 1898
Mira Loma Ave
Length: 0.15 miles
Direction: SW-NE
Address range: 300 to 399
Direction: SW-NE
Address range: 300 to 399
el Bonita Ave
Length: 0.14 miles
Direction: SW-NE
Address range: 300 to 399
Direction: SW-NE
Address range: 300 to 399
Fernando Ct
Length: 0.09 miles
Direction: SW-NE
Address range: 400 to 467
Direction: SW-NE
Address range: 400 to 467
Tyburn St
Length: 0.08 miles
Direction: SW-NE
Address range: 1831 to 3630
Direction: SW-NE
Address range: 1831 to 3630
Princeton St
Length: 0.08 miles
Direction: SW-NE
Address range: 1827 to 1899
Direction: SW-NE
Address range: 1827 to 1899
Topock St
Length: 0.08 miles
Direction: SW-NE
Address range: 1800 to 1899
Direction: SW-NE
Address range: 1800 to 1899
Hague Ct
Length: 0.06 miles
Direction: N-S
Address range: 1200 to 1299
Direction: N-S
Address range: 1200 to 1299