Twin Lakes Tech Park neighborhood in Boulder, Colorado (CO), 80301 detailed profile
Settings
X


Business Search - 14 Million verified businesses
Area: 0.130 square miles
Population: 296
Population density:
| Twin Lakes Tech Park: | 2,272 people per square mile |
| Boulder: | 4,328 people per square mile |

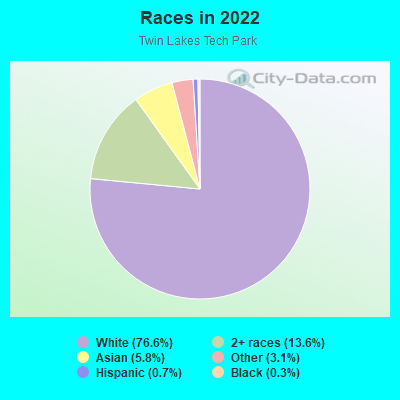
- 22676.6%White
- 4013.6%Two or more races
- 175.8%Asian
- 93.1%Some other race
- 20.7%Hispanic or Latino
- 10.3%Black
Median household income in 2022:
| Twin Lakes Tech Park: | $98,031 |
| Boulder: | $81,608 |
Distribution of median household income
![Distribution of median household income]()
- 6Less than $10,000
- 16$10,000 to $19,999
- 6$20,000 to $29,999
- 7$30,000 to $39,999
- 18$40,000 to $49,999
- 16$50,000 to $59,999
- 12$60,000 to $74,999
- 16$75,000 to $99,999
- 17$100,000 to $124,999
- 33$125,000 to $149,999
- 10$150,000 to $199,999
- 12$200,000 or more

Distribution of owner-occupied house/condo value
![Distribution of owner-occupied house/condo value]()
- 6Less than $50,000
- 1$150,000 to $199,999
- 8$200,000 to $249,999
- 4$250,000 to $299,999
- 5$300,000 to $399,999
- 10$400,000 to $499,999
- 8$500,000 to $749,999
- 2$750,000 to $999,999
- 8$1,000,000 or more

Distribution of rent paid by renters
![Distribution of rent paid by renters]()
- 2Less than $100
- 2$900 to $999
- 7$1,000 to $1,249
- 25$1,250 to $1,499
- 74$1,500 to $1,999
- 10$2,000 or more

Median rent in 2022:
| Twin Lakes Tech Park: | $1,661 |
| Boulder: | $1,700 |
| Males: | 155 |
| Females: | 140 |
Males:
| This neighborhood: | 41.4 years |
| Whole city: | 28.3 years |
| This neighborhood: | 41.8 years |
| Whole city: | 29.2 years |
Average household size:
| Twin Lakes Tech Park: | 1.9 people |
| Boulder: | 2.1 people |
Percentage of family households:
| Twin Lakes Tech Park: | 18.6% |
| Boulder: | 26.9% |
| Here: | 19.2% |
| Boulder: | 30.4% |
Percentage of married-couple families with children (among all households):
| Twin Lakes Tech Park: | 24.2% |
| Boulder: | 32.8% |
Percentage of single-mother households (among all households):
| Twin Lakes Tech Park: | 29.3% |
| Boulder: | 6.3% |
Percentage of never married males 15 years old and over:
Percentage of never married females 15 years old and over:
| Twin Lakes Tech Park: | 39.9% |
| Boulder: | 32.7% |
Percentage of never married females 15 years old and over:
| Twin Lakes Tech Park: | 27.0% |
| city: | 28.3% |
Percentage of people that speak English not well or not at all:
| Twin Lakes Tech Park: | 1.4% |
| Boulder: | 1.0% |
Percentage of people born in this state:
Percentage of people born in another U.S. state:
Percentage of native residents but born outside the U.S.:
Percentage of foreign born residents:
| Here: | 26.1% |
| Boulder: | 28.3% |
Percentage of people born in another U.S. state:
| Twin Lakes Tech Park: | 65.0% |
| Boulder: | 60.5% |
Percentage of native residents but born outside the U.S.:
| Here: | 1.9% |
| city: | 2.1% |
Percentage of foreign born residents:
| Here: | 7.0% |
| Boulder: | 9.1% |
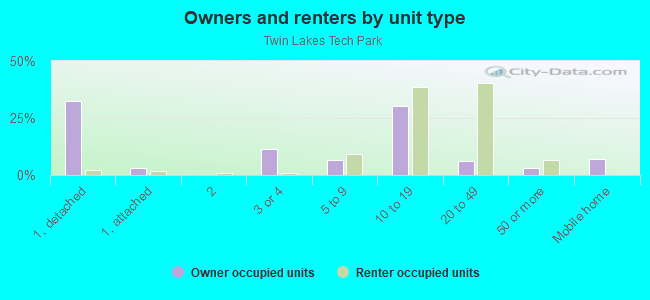
Owner-occupied
Renter-occupied

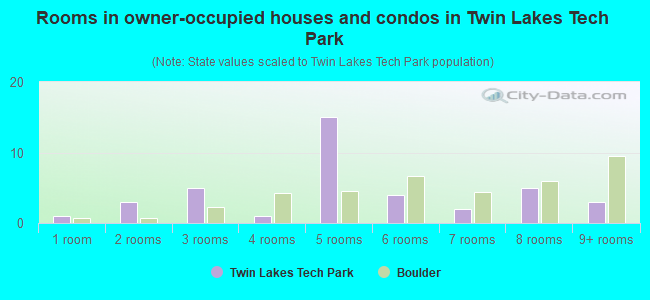
- Rooms in owner-occupied houses and condos in Twin Lakes Tech Park
- 11 room
- 32 rooms
- 53 rooms
- 14 rooms
- 155 rooms
- 46 rooms
- 27 rooms
- 58 rooms
- 39+ rooms
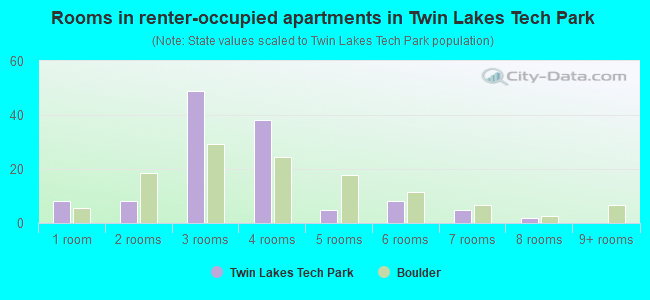
- Rooms in renter-occupied apartments in Twin Lakes Tech Park
- 81 room
- 82 rooms
- 493 rooms
- 384 rooms
- 55 rooms
- 86 rooms
- 57 rooms
- 28 rooms
- 09+ rooms
Owner-occupied
Renter-occupied
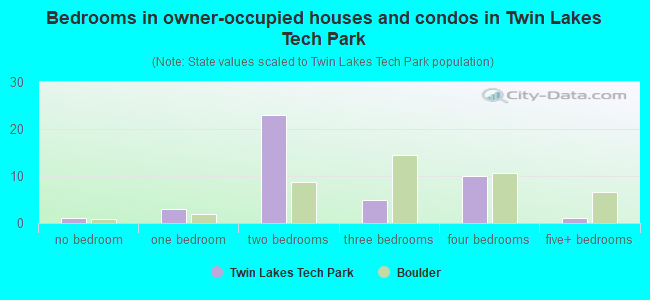
- Bedrooms in owner-occupied houses and condos in Twin Lakes Tech Park
- 1no bedroom
- 31 bedroom
- 232 bedrooms
- 53 bedrooms
- 104 bedrooms
- 15+ bedrooms
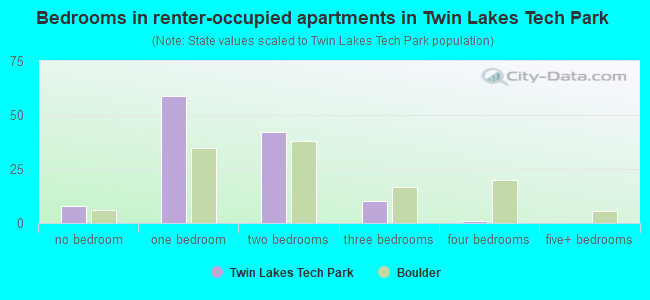
- Bedrooms in renter-occupied apartments in Twin Lakes Tech Park
- 8no bedroom
- 591 bedroom
- 422 bedrooms
- 103 bedrooms
- 14 bedrooms
- 05+ bedrooms
Average number of cars or other vehicles available in houses/condos:
Average number of cars or other vehicles available in apartments:
| This neighborhood: | 1.3 |
| Boulder: | 1.8 |
Average number of cars or other vehicles available in apartments:
| Here: | 1.6 |
| city: | 1.6 |
Percentage of units with a mortgage:
| Twin Lakes Tech Park: | 50.2% |
| Boulder: | 60.5% |
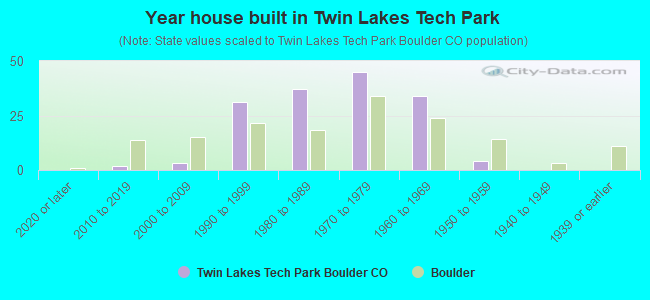
- Year house built in Twin Lakes Tech Park
- 02020 or later
- 22010 to 2019
- 32000 to 2009
- 311990 to 1999
- 371980 to 1989
- 451970 to 1979
- 341960 to 1969
- 41950 to 1959
- 01940 to 1949
- 01939 or earlier
City-data.com crime index for city in 2020 (higher means more crime):
| City: | 275.1 |
| U.S. average: | 219.5 |
Travel time to work (commute)
![Travel time to work (commute)]()
- 4Less than 5 minutes
- 275 to 9 minutes
- 2010 to 14 minutes
- 3315 to 19 minutes
- 2720 to 24 minutes
- 1025 to 29 minutes
- 1930 to 34 minutes
- 135 to 39 minutes
- 440 to 44 minutes
- 1345 to 59 minutes
- 160 to 89 minutes
- 290 or more minutes

Means of transportation to work
![Means of transportation to work]()
- 54.7%108Drove a car alone
- 5.1%10Carpooled
- 6.6%13Bus
- 0.5%1Motorcycle
- 1.0%2Bicycle
- 4.1%8Walked
- 27.3%54Worked at home

Time leaving home to go to work
![Time leaving home to go to work]()
- 112:00 a.m. to 4:59 a.m.
- 25:00 a.m. to 5:29 a.m.
- 25:30 a.m. to 5:59 a.m.
- 66:00 a.m. to 6:29 a.m.
- 136:30 a.m. to 6:59 a.m.
- 237:00 a.m. to 7:29 a.m.
- 207:30 a.m. to 7:59 a.m.
- 308:00 a.m. to 8:29 a.m.
- 108:30 a.m. to 8:59 a.m.
- 179:00 a.m. to 9:59 a.m.
- 1010:00 a.m. to 10:59 a.m.
- 711:00 a.m. to 11:59 a.m.
- 1512:00 p.m. to 3:59 p.m.
- 44:00 p.m. to 11:59 p.m.

Occupations of males:
- Percentage of males in management occupations (except farmers):
Here: 3.4% city: 12.9%
- Percentage of males in business and financial operations occupations:
Here: 2.2% city: 7.6%
- Percentage of males in computer and mathematical occupations:
Here: 18.2% city: 10.0%
- Percentage of males in architecture and engineering occupations:
Here: 3.7% city: 6.1%
- Percentage of males in education, training, and library occupations:
Here: 28.3% city: 8.1%
- Percentage of males in arts, design, entertainment, sports, and media occupations:
Here: 1.5% city: 3.3%
- Percentage of males in healthcare practitioners and technical occupations:
Here: 2.9% city: 1.9%
- Percentage of males in service occupations:
Here: 23.7% city: 14.4%
- Percentage of males in sales and office occupations:
Here: 6.3% city: 14.5%
- Percentage of males in construction, extraction, and maintenance occupations:
Here: 7.5% city: 2.8%
- Percentage of males in production occupations:
Here: 2.2% city: 2.3%
Occupations of females:
- Percentage of females in management occupations (except farmers):
Here: 24.9% city: 8.8%
- Percentage of females in business and financial operations occupations:
Here: 2.9% city: 6.4%
- Percentage of females in computer and mathematical occupations:
Here: 5.0% city: 4.6%
- Percentage of females in architecture and engineering occupations:
Here: 4.7% city: 1.9%
- Percentage of females in life, physical, and social science occupations:
Here: 2.6% city: 4.7%
- Percentage of females in education, training, and library occupations:
Here: 2.4% city: 13.1%
- Percentage of females in arts, design, entertainment, sports, and media occupations:
Here: 8.1% city: 5.5%
- Percentage of females in healthcare practitioners and technical occupations:
Here: 7.6% city: 7.2%
- Percentage of females in service occupations:
Here: 13.9% city: 20.9%
- Percentage of females in sales and office occupations:
Here: 24.7% city: 19.4%
- Percentage of females in production occupations:
Here: 2.9% city: 0.6%
- Percentage of females in transportation occupations:
Here: 2.6% city: 1.0%
- Percentage of females in material moving occupations:
Here: 2.4% city: 1.9%
Percentage of people 16-64 in Armed Forces:
| Twin Lakes Tech Park: | 0.4% |
| Boulder: | 0.1% |
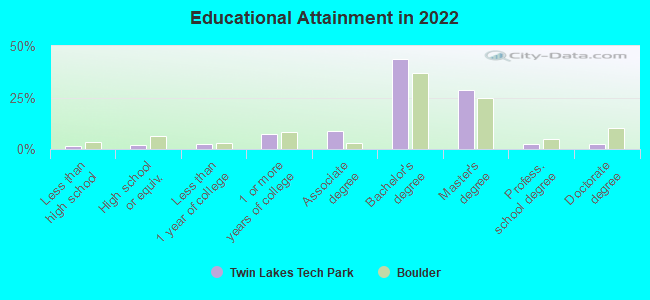
Education in this neighborhood (subdivision or community):
- Percentage of people 3 years and older in K-12 schools:
Twin Lakes Tech Park: 7.5% Boulder: 8.8%
- Percentage of people 3 years and older in undergraduate colleges:
Twin Lakes Tech Park: 14.6% Boulder: 28.2%
- Percentage of people 3 years and older in grad. or professional schools:
Twin Lakes Tech Park: 17.0% Boulder: 6.1%
- Percentage of students K-12 enrolled in private schools:
Twin Lakes Tech Park: 0.0% Boulder: 8.5%
Percentage of population below poverty level:
| Twin Lakes Tech Park: | 12.7% |
| Boulder: | 24.1% |
Median year owner moved in (as recorded in 2022):
| Twin Lakes Tech Park: | 2009 |
| Boulder: | 2012 |
Percentage of married-couple families with both working:
| Twin Lakes Tech Park: | 83.4% |
| Boulder: | 76.2% |
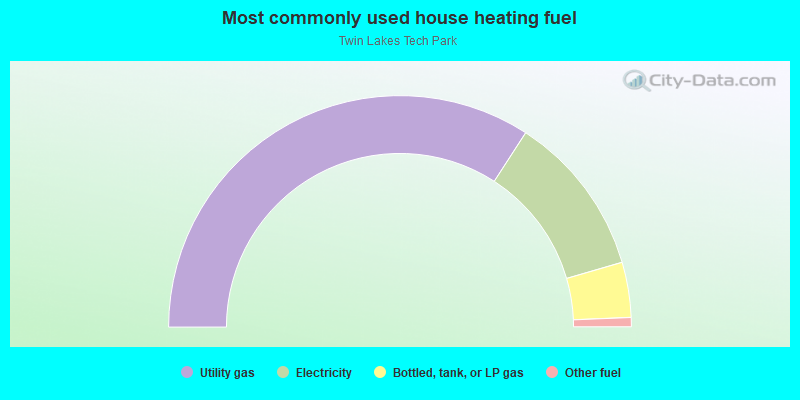
- 68.3%Utility gas
- 22.7%Electricity
- 7.7%Bottled, tank, or LP gas
- 1.3%Other fuel
Roads and streets:
Nautilus Ct S
Length: 0.30 miles
Directions: E-W, N-S, SE-NW, SW-NE
Address range: 4600 to 4799
Directions: E-W, N-S, SE-NW, SW-NE
Address range: 4600 to 4799
Nautilus Dr
Length: 0.27 miles
Directions: E-W, SW-NE
Address range: 6346 to 6399
Directions: E-W, SW-NE
Address range: 6346 to 6399
Nautilus Ct N
Length: 0.17 miles
Directions: E-W, N-S, SE-NW, SW-NE
Address range: 4800 to 4999
Directions: E-W, N-S, SE-NW, SW-NE
Address range: 4800 to 4999
Other features:
Bldr and Wh Rock Ditch
Length: 0.23 miles
Directions: E-W, SW-NE
Directions: E-W, SW-NE