Village Green neighborhood in Mesquite, Texas (TX), 75150 detailed profile
Settings
X


Business Search - 14 Million verified businesses
Area: 0.049 square miles
Population: 443
Population density:
| Village Green: | 9,008 people per square mile |
| Mesquite: | 3,403 people per square mile |

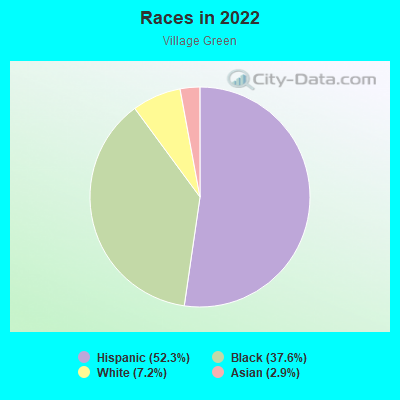
- 23152.3%Hispanic or Latino
- 16637.6%Black
- 327.2%White
- 132.9%Asian

Median household income in 2022:
| Village Green: | $49,631 |
| Mesquite: | $68,134 |
Distribution of median household income
![Distribution of median household income]()
- 11Less than $10,000
- 3$10,000 to $19,999
- 19$20,000 to $29,999
- 49$30,000 to $39,999
- 42$40,000 to $49,999
- 28$50,000 to $59,999
- 34$60,000 to $74,999
- 42$75,000 to $99,999
- 3$100,000 to $124,999
- 4$125,000 to $149,999
- 12$150,000 to $199,999
- 3$200,000 or more

Distribution of owner-occupied house/condo value
![Distribution of owner-occupied house/condo value]()
- 12$50,000 to $99,999
- 11$100,000 to $149,999
- 53$150,000 to $199,999
- 15$200,000 to $249,999
- 8$250,000 to $299,999
- 5$300,000 to $399,999

Distribution of rent paid by renters
![Distribution of rent paid by renters]()
- 3$300 to $399
- 15$400 to $499
- 21$800 to $899
- 54$900 to $999
- 57$1,000 to $1,249
- 15$1,250 to $1,499
- 5$1,500 to $1,999

Median rent in 2022:
| Village Green: | $982 |
| Mesquite: | $1,156 |
| Males: | 162 |
| Females: | 280 |
Males:
| This neighborhood: | 18.5 years |
| Whole city: | 30.8 years |
| This neighborhood: | 26.4 years |
| Whole city: | 33.8 years |
Average household size:
| Village Green: | 22.0 people |
| Mesquite: | 2.9 people |
Percentage of family households:
| Village Green: | 33.8% |
| Mesquite: | 55.6% |
| Here: | 13.4% |
| Mesquite: | 43.4% |
Percentage of married-couple families with children (among all households):
| Village Green: | 18.0% |
| Mesquite: | 20.2% |
Percentage of single-mother households (among all households):
| Village Green: | 26.7% |
| Mesquite: | 12.3% |
Percentage of never married males 15 years old and over:
Percentage of never married females 15 years old and over:
| Village Green: | 20.7% |
| Mesquite: | 20.1% |
Percentage of never married females 15 years old and over:
| Village Green: | 34.0% |
| city: | 18.2% |
Percentage of people that speak English not well or not at all:
| Village Green: | 9.0% |
| Mesquite: | 8.1% |
Percentage of people born in this state:
Percentage of people born in another U.S. state:
Percentage of native residents but born outside the U.S.:
Percentage of foreign born residents:
| Here: | 59.1% |
| Mesquite: | 62.9% |
Percentage of people born in another U.S. state:
| Village Green: | 13.4% |
| Mesquite: | 17.6% |
Percentage of native residents but born outside the U.S.:
| Here: | 2.4% |
| city: | 1.3% |
Percentage of foreign born residents:
| Here: | 25.0% |
| Mesquite: | 18.2% |
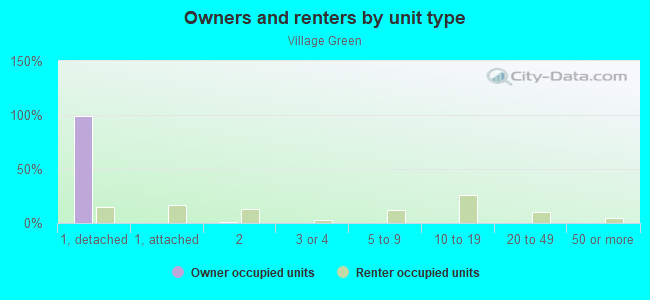
Owner-occupied
Renter-occupied

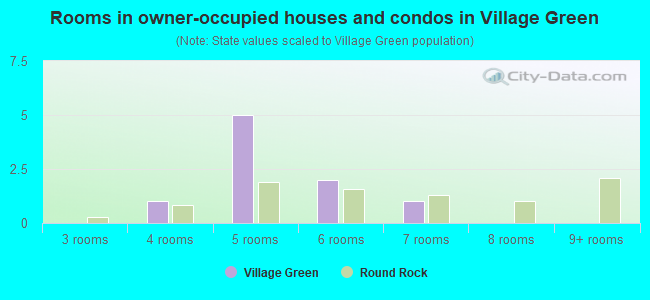
- Rooms in owner-occupied houses and condos in Village Green
- 01 room
- 02 rooms
- 113 rooms
- 64 rooms
- 195 rooms
- 416 rooms
- 77 rooms
- 108 rooms
- 89+ rooms
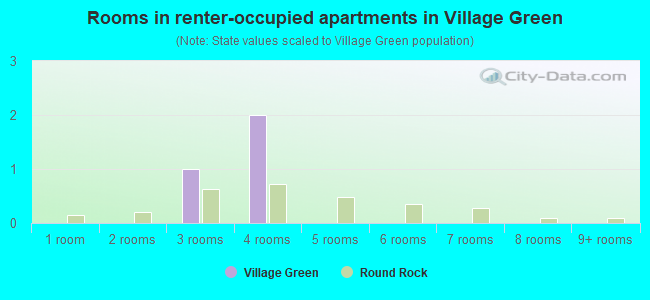
- Rooms in renter-occupied apartments in Village Green
- 41 room
- 202 rooms
- 493 rooms
- 554 rooms
- 165 rooms
- 66 rooms
- 67 rooms
- 38 rooms
- 149+ rooms
Owner-occupied
Renter-occupied
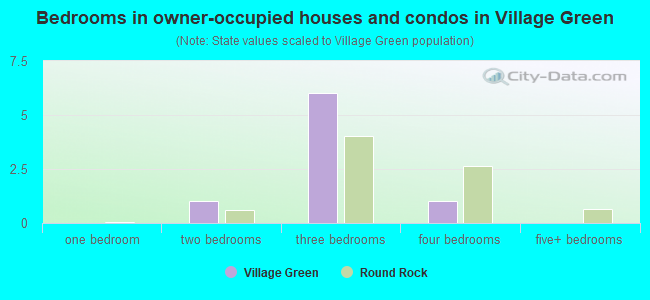
- Bedrooms in owner-occupied houses and condos in Village Green
- 11no bedroom
- 01 bedroom
- 62 bedrooms
- 523 bedrooms
- 204 bedrooms
- 05+ bedrooms
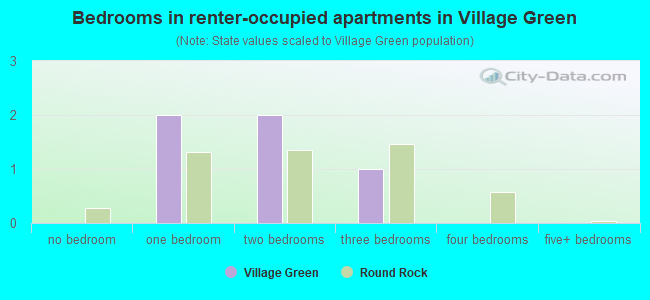
- Bedrooms in renter-occupied apartments in Village Green
- 4no bedroom
- 1111 bedroom
- 452 bedrooms
- 103 bedrooms
- 84 bedrooms
- 05+ bedrooms
Average number of cars or other vehicles available in houses/condos:
Average number of cars or other vehicles available in apartments:
| This neighborhood: | 1.0 |
| Mesquite: | 2.2 |
Average number of cars or other vehicles available in apartments:
| Here: | 1.4 |
| city: | 1.6 |
Percentage of units with a mortgage:
| Village Green: | 52.8% |
| Mesquite: | 62.3% |
Average estimated value of detached houses in 2022 (32.0% of all units):
| Village Green: | $164,505 |
| Texas: | $369,058 |
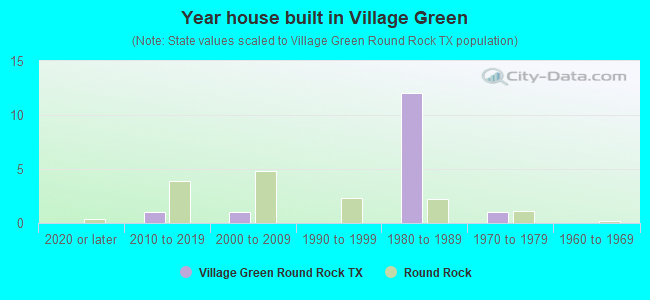
- Year house built in Village Green
- 02020 or later
- 132010 to 2019
- 02000 to 2009
- 301990 to 1999
- 761980 to 1989
- 901970 to 1979
- 281960 to 1969
- 141950 to 1959
- 01940 to 1949
- 61939 or earlier
City-data.com crime index for city in 2020 (higher means more crime):
| City: | 322.7 |
| U.S. average: | 219.5 |
Travel time to work (commute)
![Travel time to work (commute)]()
- 10Less than 5 minutes
- 85 to 9 minutes
- 3810 to 14 minutes
- 215 to 19 minutes
- 1820 to 24 minutes
- 325 to 29 minutes
- 7330 to 34 minutes
- 1435 to 39 minutes
- 1240 to 44 minutes
- 7445 to 59 minutes
- 1160 to 89 minutes

Means of transportation to work
![Means of transportation to work]()
- 94.0%224Drove a car alone
- 5.9%14Carpooled
- 2.1%5Walked
- 1.3%3Other means
- 2.9%7Worked at home

Time leaving home to go to work
![Time leaving home to go to work]()
- 195:00 a.m. to 5:29 a.m.
- 65:30 a.m. to 5:59 a.m.
- 266:00 a.m. to 6:29 a.m.
- 166:30 a.m. to 6:59 a.m.
- 677:00 a.m. to 7:29 a.m.
- 277:30 a.m. to 7:59 a.m.
- 188:00 a.m. to 8:29 a.m.
- 58:30 a.m. to 8:59 a.m.
- 109:00 a.m. to 9:59 a.m.
- 1510:00 a.m. to 10:59 a.m.
- 1112:00 p.m. to 3:59 p.m.
- 44:00 p.m. to 11:59 p.m.

Occupations of males:
- Percentage of males in management occupations (except farmers):
Here: 3.7% city: 7.0%
- Percentage of males in business and financial operations occupations:
Here: 3.1% city: 2.5%
- Percentage of males in computer and mathematical occupations:
Here: 2.6% city: 2.4%
- Percentage of males in architecture and engineering occupations:
Here: 4.7% city: 2.0%
- Percentage of males in education, training, and library occupations:
Here: 2.8% city: 2.4%
- Percentage of males in service occupations:
Here: 53.0% city: 13.7%
- Percentage of males in sales and office occupations:
Here: 22.6% city: 16.2%
- Percentage of males in construction, extraction, and maintenance occupations:
Here: 20.7% city: 19.2%
- Percentage of males in production occupations:
Here: 10.7% city: 5.8%
Occupations of females:
- Percentage of females in management occupations (except farmers):
Here: 17.6% city: 7.4%
- Percentage of females in business and financial operations occupations:
Here: 23.8% city: 5.0%
- Percentage of females in community and social services occupations:
Here: 1.3% city: 1.3%
- Percentage of females in education, training, and library occupations:
Here: 8.2% city: 7.9%
- Percentage of females in healthcare practitioners and technical occupations:
Here: 1.0% city: 6.0%
- Percentage of females in service occupations:
Here: 6.2% city: 24.6%
- Percentage of females in sales and office occupations:
Here: 50.4% city: 34.0%
- Percentage of females in material moving occupations:
Here: 2.5% city: 3.9%
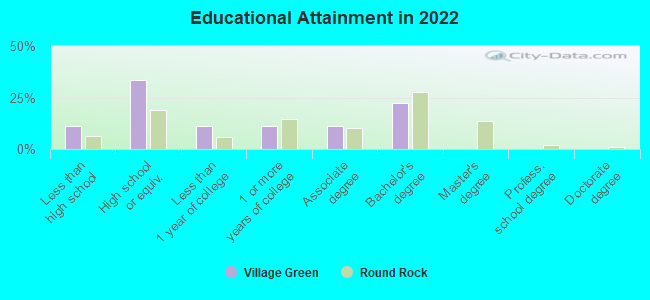
Education in this neighborhood (subdivision or community):
- Percentage of people 3 years and older in K-12 schools:
Village Green: 30.8% Mesquite: 23.2%
- Percentage of people 3 years and older in undergraduate colleges:
Village Green: 5.4% Mesquite: 4.1%
- Percentage of people 3 years and older in grad. or professional schools:
Village Green: 0.9% Mesquite: 0.7%
- Percentage of students K-12 enrolled in private schools:
Village Green: 0.0% Mesquite: 7.3%
Percentage of population below poverty level:
| Village Green: | 6.1% |
| Mesquite: | 11.8% |
Median year owner moved in (as recorded in 2022):
Median year renter moved in (as recorded in 2022):
| Village Green: | 2010 |
| Mesquite: | 2010 |
Median year renter moved in (as recorded in 2022):
| Village Green: | 2018 |
| Mesquite: | 2020 |
Percentage of married-couple families with both working:
| Village Green: | 119.1% |
| Mesquite: | 64.1% |
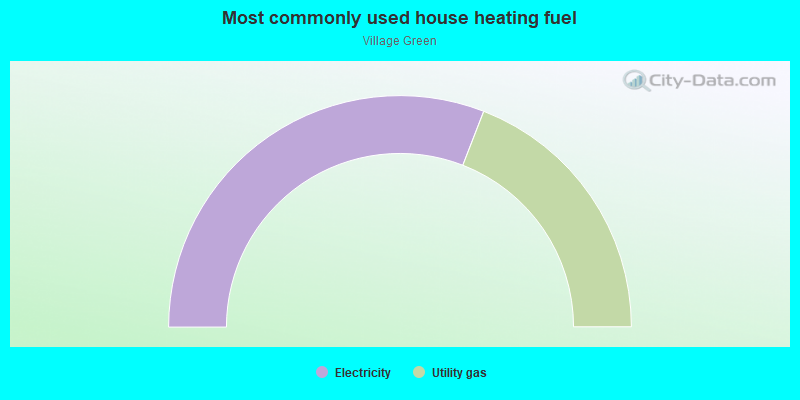
- 91.1%Electricity
- 8.9%Utility gas
Roads and streets:
Smithridge
Length: 0.53 miles
Directions: E-W, N-S, SE-NW, SW-NE
Address range: 2100 to 2299
Directions: E-W, N-S, SE-NW, SW-NE
Address range: 2100 to 2299
Village Green Dr
Length: 0.24 miles
Directions: N-S, SE-NW
Address range: 5300 to 5536
Directions: N-S, SE-NW
Address range: 5300 to 5536
Pinehurst Ln
Length: 0.06 miles
Direction: N-S
Address range: 2100 to 2159
Direction: N-S
Address range: 2100 to 2159