Wyman Park neighborhood in Baltimore, Maryland (MD), 21211 detailed profile
Settings
X

Business Search - 14 Million verified businesses
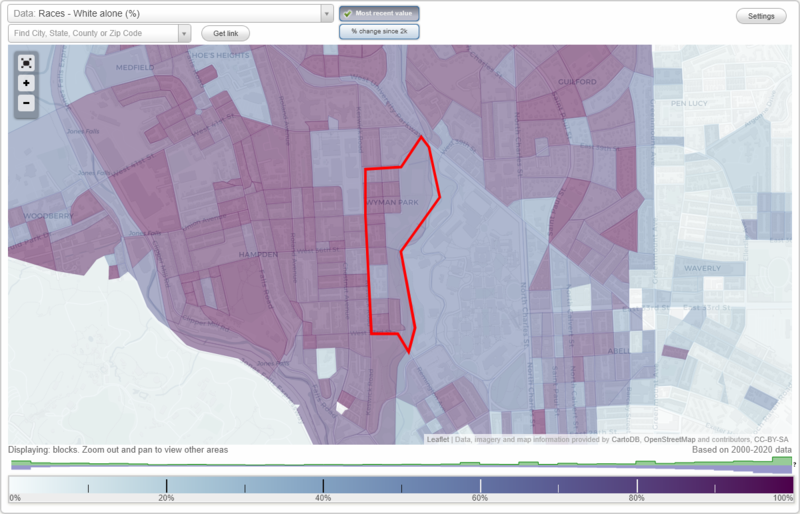
Area: 0.106 square miles
Population: 1,842
Population density:
| Wyman Park: | 17,351 people per square mile |
| Baltimore: | 7,053 people per square mile |

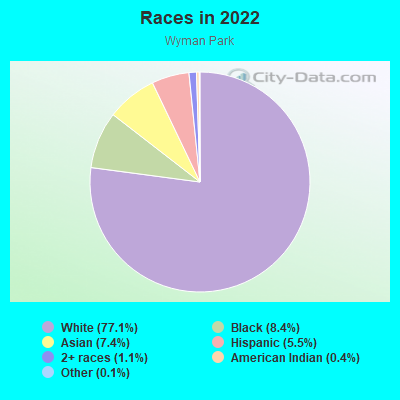
- 1,43577.1%White
- 1568.4%Black
- 1387.4%Asian
- 1035.5%Hispanic or Latino
- 201.1%Two or more races
- 70.4%American Indian
- 20.1%Some other race
Median household income in 2022:
| Wyman Park: | $89,684 |
| Baltimore: | $55,198 |
Distribution of median household income
![Distribution of median household income]()
- 142Less than $10,000
- 85$10,000 to $19,999
- 31$20,000 to $29,999
- 49$30,000 to $39,999
- 68$40,000 to $49,999
- 65$50,000 to $59,999
- 136$60,000 to $74,999
- 164$75,000 to $99,999
- 151$100,000 to $124,999
- 163$125,000 to $149,999
- 100$150,000 to $199,999
- 118$200,000 or more

Distribution of owner-occupied house/condo value
![Distribution of owner-occupied house/condo value]()
- 41$50,000 to $99,999
- 16$100,000 to $149,999
- 117$150,000 to $199,999
- 185$200,000 to $249,999
- 61$250,000 to $299,999
- 144$300,000 to $399,999
- 111$400,000 to $499,999
- 23$500,000 to $749,999
- 39$1,000,000 or more

Distribution of rent paid by renters
![Distribution of rent paid by renters]()
- 6$200 to $299
- 13$500 to $599
- 14$600 to $699
- 47$700 to $799
- 12$800 to $899
- 39$900 to $999
- 306$1,000 to $1,249
- 130$1,250 to $1,499
- 119$1,500 to $1,999
- 274$2,000 or more

Median rent in 2022:
| Wyman Park: | $1,651 |
| Baltimore: | $1,043 |
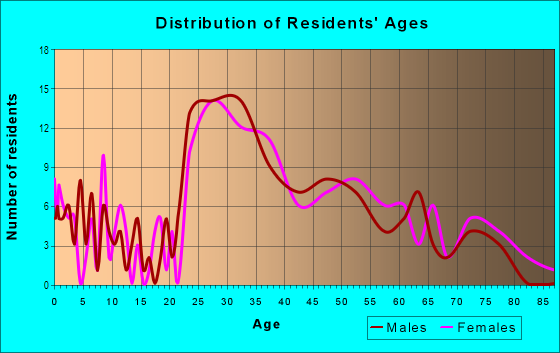
| Males: | 848 |
| Females: | 993 |
Males:
| This neighborhood: | 40.3 years |
| Whole city: | 35.0 years |
| This neighborhood: | 40.1 years |
| Whole city: | 38.2 years |
Average household size:
| Wyman Park: | 5.1 people |
| Baltimore: | 2.2 people |
Percentage of family households:
| Wyman Park: | 30.3% |
| Baltimore: | 34.2% |
| Here: | 29.0% |
| Baltimore: | 23.3% |
Percentage of married-couple families with children (among all households):
| Wyman Park: | 46.5% |
| Baltimore: | 22.4% |
Percentage of single-mother households (among all households):
| Wyman Park: | 13.5% |
| Baltimore: | 18.7% |
Percentage of never married males 15 years old and over:
Percentage of never married females 15 years old and over:
| Wyman Park: | 23.1% |
| Baltimore: | 25.1% |
Percentage of never married females 15 years old and over:
| Wyman Park: | 25.7% |
| city: | 27.5% |
Percentage of people that speak English not well or not at all:
| Wyman Park: | 0.0% |
| Baltimore: | 2.3% |
Percentage of people born in this state:
Percentage of people born in another U.S. state:
Percentage of native residents but born outside the U.S.:
Percentage of foreign born residents:
| Here: | 46.3% |
| Baltimore: | 64.4% |
Percentage of people born in another U.S. state:
| Wyman Park: | 43.6% |
| Baltimore: | 25.0% |
Percentage of native residents but born outside the U.S.:
| Here: | 0.9% |
| city: | 0.9% |
Percentage of foreign born residents:
| Here: | 9.2% |
| Baltimore: | 9.7% |
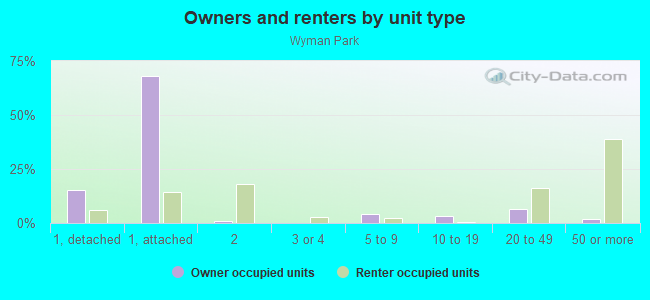
Owner-occupied
Renter-occupied

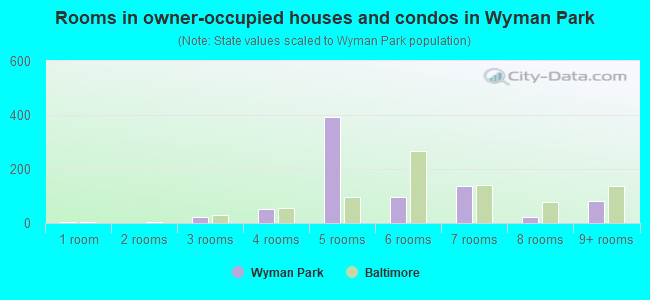
- Rooms in owner-occupied houses and condos in Wyman Park
- 51 room
- 02 rooms
- 243 rooms
- 534 rooms
- 3915 rooms
- 986 rooms
- 1387 rooms
- 228 rooms
- 829+ rooms
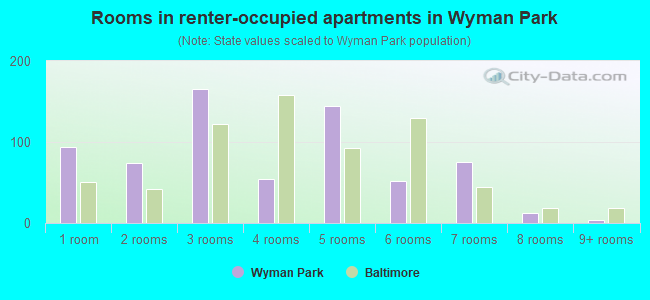
- Rooms in renter-occupied apartments in Wyman Park
- 941 room
- 742 rooms
- 1663 rooms
- 544 rooms
- 1455 rooms
- 526 rooms
- 757 rooms
- 128 rooms
- 49+ rooms
Owner-occupied
Renter-occupied
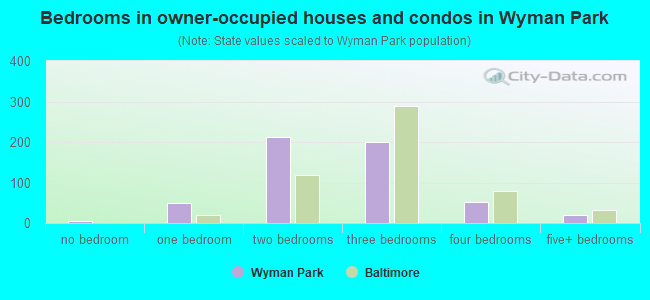
- Bedrooms in owner-occupied houses and condos in Wyman Park
- 5no bedroom
- 491 bedroom
- 2132 bedrooms
- 2003 bedrooms
- 524 bedrooms
- 195+ bedrooms
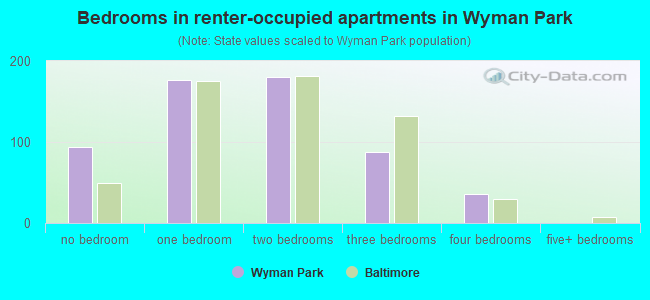
- Bedrooms in renter-occupied apartments in Wyman Park
- 94no bedroom
- 1761 bedroom
- 1802 bedrooms
- 883 bedrooms
- 364 bedrooms
- 05+ bedrooms
Average number of cars or other vehicles available in houses/condos:
Average number of cars or other vehicles available in apartments:
| This neighborhood: | 1.4 |
| Baltimore: | 1.5 |
Average number of cars or other vehicles available in apartments:
| Here: | 1.3 |
| city: | 0.8 |
Percentage of units with a mortgage:
| Wyman Park: | 69.0% |
| Baltimore: | 64.3% |
Housing prices:
- Average estimated value of detached houses in 2022 (7.9% of all units):
Wyman Park: $414,854 Baltimore: $350,815
- Average estimated value of townhouses or other attached units in 2022 (48.2% of all units):
This neighborhood: $296,755 city: $206,258
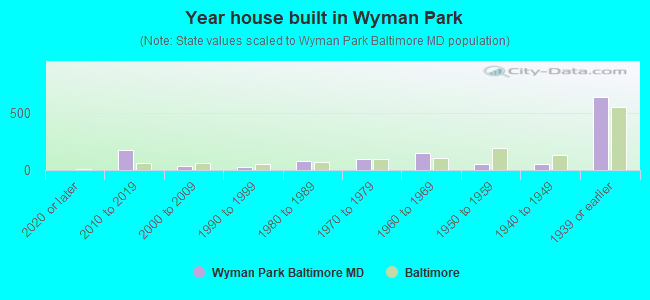
- Year house built in Wyman Park
- 02020 or later
- 1732010 to 2019
- 382000 to 2009
- 271990 to 1999
- 791980 to 1989
- 991970 to 1979
- 1471960 to 1969
- 521950 to 1959
- 501940 to 1949
- 6331939 or earlier
Travel time to work (commute)
![Travel time to work (commute)]()
- 13Less than 5 minutes
- 415 to 9 minutes
- 7710 to 14 minutes
- 11415 to 19 minutes
- 12120 to 24 minutes
- 5325 to 29 minutes
- 10630 to 34 minutes
- 2935 to 39 minutes
- 1140 to 44 minutes
- 9645 to 59 minutes
- 3260 to 89 minutes
- 1090 or more minutes

Means of transportation to work
![Means of transportation to work]()
- 58.4%725Drove a car alone
- 3.3%41Carpooled
- 6.2%77Bus
- 1.2%15Subway or elevated rail
- 1.8%22Long-distance train or commuter rail
- 1.6%20Motorcycle
- 3.9%49Bicycle
- 4.8%59Walked
- 1.2%15Other means
- 23.0%285Worked at home

Time leaving home to go to work
![Time leaving home to go to work]()
- 95:00 a.m. to 5:29 a.m.
- 125:30 a.m. to 5:59 a.m.
- 316:00 a.m. to 6:29 a.m.
- 396:30 a.m. to 6:59 a.m.
- 907:00 a.m. to 7:29 a.m.
- 717:30 a.m. to 7:59 a.m.
- 1198:00 a.m. to 8:29 a.m.
- 978:30 a.m. to 8:59 a.m.
- 1099:00 a.m. to 9:59 a.m.
- 1210:00 a.m. to 10:59 a.m.
- 611:00 a.m. to 11:59 a.m.
- 2512:00 p.m. to 3:59 p.m.
- 244:00 p.m. to 11:59 p.m.

Occupations of males:
- Percentage of males in management occupations (except farmers):
Here: 18.2% city: 10.7%
- Percentage of males in business and financial operations occupations:
Here: 2.9% city: 5.9%
- Percentage of males in computer and mathematical occupations:
Here: 11.0% city: 6.1%
- Percentage of males in architecture and engineering occupations:
Here: 4.7% city: 2.9%
- Percentage of males in life, physical, and social science occupations:
Here: 4.0% city: 2.3%
- Percentage of males in community and social services occupations:
Here: 4.3% city: 1.6%
- Percentage of males in legal occupations:
Here: 2.4% city: 1.8%
- Percentage of males in education, training, and library occupations:
Here: 14.0% city: 5.4%
- Percentage of males in arts, design, entertainment, sports, and media occupations:
Here: 6.0% city: 2.8%
- Percentage of males in healthcare practitioners and technical occupations:
Here: 6.0% city: 4.0%
- Percentage of males in service occupations:
Here: 10.2% city: 14.7%
- Percentage of males in sales and office occupations:
Here: 13.6% city: 14.2%
- Percentage of males in construction, extraction, and maintenance occupations:
Here: 1.1% city: 5.6%
- Percentage of males in material moving occupations:
Here: 1.8% city: 7.0%
Occupations of females:
- Percentage of females in management occupations (except farmers):
Here: 11.5% city: 10.1%
- Percentage of females in business and financial operations occupations:
Here: 6.6% city: 6.6%
- Percentage of females in computer and mathematical occupations:
Here: 3.6% city: 2.4%
- Percentage of females in life, physical, and social science occupations:
Here: 7.1% city: 2.5%
- Percentage of females in community and social services occupations:
Here: 1.5% city: 3.6%
- Percentage of females in legal occupations:
Here: 13.2% city: 1.8%
- Percentage of females in education, training, and library occupations:
Here: 20.9% city: 10.7%
- Percentage of females in arts, design, entertainment, sports, and media occupations:
Here: 3.0% city: 2.4%
- Percentage of females in healthcare practitioners and technical occupations:
Here: 14.9% city: 9.8%
- Percentage of females in sales and office occupations:
Here: 13.7% city: 22.3%
- Percentage of females in transportation occupations:
Here: 1.1% city: 1.7%
Percentage of people 16-64 in Armed Forces:
| Wyman Park: | 0.2% |
| Baltimore: | 0.4% |
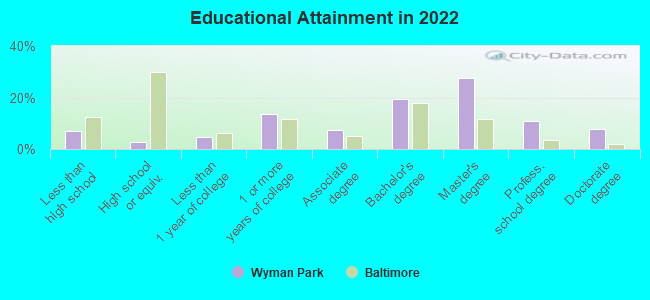
Education in this neighborhood (subdivision or community):
- Percentage of people 3 years and older in K-12 schools:
Wyman Park: 5.8% Baltimore: 14.7%
- Percentage of people 3 years and older in undergraduate colleges:
Wyman Park: 3.5% Baltimore: 6.0%
- Percentage of people 3 years and older in grad. or professional schools:
Wyman Park: 17.0% Baltimore: 2.8%
- Percentage of students K-12 enrolled in private schools:
Wyman Park: 29.0% Baltimore: 12.7%
Percentage of population below poverty level:
| Wyman Park: | 9.0% |
| Baltimore: | 18.5% |
Median year owner moved in (as recorded in 2022):
Median year renter moved in (as recorded in 2022):
| Wyman Park: | 2010 |
| Baltimore: | 2009 |
Median year renter moved in (as recorded in 2022):
| Wyman Park: | 2017 |
| Baltimore: | 2019 |
Percentage of married-couple families with both working:
| Wyman Park: | 79.3% |
| Baltimore: | 79.2% |
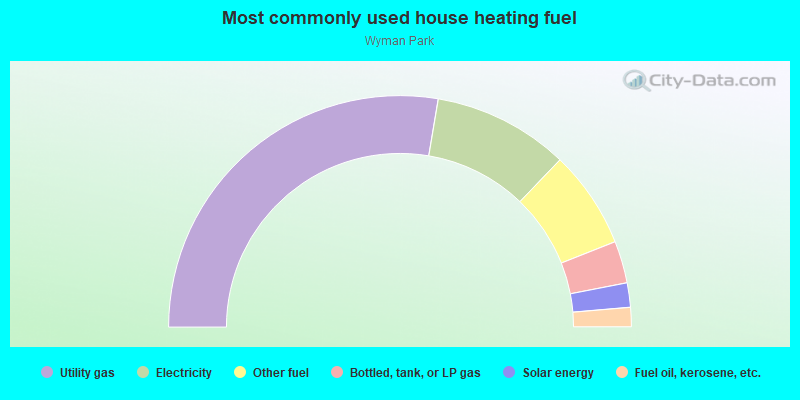
- 55.3%Utility gas
- 19.0%Electricity
- 13.7%Other fuel
- 5.9%Bottled, tank, or LP gas
- 3.4%Solar energy
- 2.7%Fuel oil, kerosene, etc.
Roads and streets:
Beech Ave
Length: 0.51 miles
Direction: N-S
Address range: 3300 to 3799
Direction: N-S
Address range: 3300 to 3799
Gilman Ter
Length: 0.13 miles
Directions: E-W, N-S, SE-NW, SW-NE
Address range: 3300 to 3399
Directions: E-W, N-S, SE-NW, SW-NE
Address range: 3300 to 3399
Tudor Arms Ave
Length: 0.10 miles
Direction: N-S
Address range: 3700 to 3799
Direction: N-S
Address range: 3700 to 3799
W 37th St
Length: 0.08 miles
Directions: E-W, N-S, SW-NE
Address range: 500 to 599
Directions: E-W, N-S, SW-NE
Address range: 500 to 599
W 38th St
Length: 0.08 miles
Direction: E-W
Address range: 500 to 599
Direction: E-W
Address range: 500 to 599
Craycombe Ave
Length: 0.08 miles
Direction: E-W
Address range: 500 to 599
Direction: E-W
Address range: 500 to 599
W 33rd St
Length: 0.06 miles
Direction: E-W
Address range: 512 to 609
Direction: E-W
Address range: 512 to 609
Hubner St
Length: 0.06 miles
Direction: E-W
Address range: 600 to 665
Direction: E-W
Address range: 600 to 665
W 34th St
Length: 0.05 miles
Direction: E-W
Address range: 500 to 599
Direction: E-W
Address range: 500 to 599