Young's Park neighborhood in Overland Park, Kansas (KS), 66204 detailed profile
Settings
X


Business Search - 14 Million verified businesses
Area: 0.188 square miles
Population: 420
Population density:
| Young's Park: | 2,230 people per square mile |
| Overland Park: | 3,485 people per square mile |

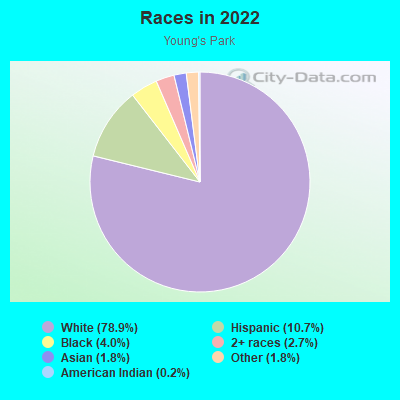
- 35578.9%White
- 4810.7%Hispanic or Latino
- 184.0%Black
- 122.7%Two or more races
- 81.8%Asian
- 81.8%Some other race
- 10.2%American Indian
Median household income in 2022:
| Young's Park: | $71,058 |
| Overland Park: | $96,694 |
Distribution of median household income
![Distribution of median household income]()
- 10Less than $10,000
- 15$10,000 to $19,999
- 22$20,000 to $29,999
- 22$30,000 to $39,999
- 26$40,000 to $49,999
- 15$50,000 to $59,999
- 17$60,000 to $74,999
- 8$75,000 to $99,999
- 29$100,000 to $124,999
- 22$125,000 to $149,999
- 27$150,000 to $199,999
- 6$200,000 or more

Distribution of owner-occupied house/condo value
![Distribution of owner-occupied house/condo value]()
- 10Less than $50,000
- 12$100,000 to $149,999
- 75$150,000 to $199,999
- 41$200,000 to $249,999
- 34$250,000 to $299,999
- 26$300,000 to $399,999
- 10$400,000 to $499,999
- 6$500,000 to $749,999

Distribution of rent paid by renters
![Distribution of rent paid by renters]()
- 2$600 to $699
- 14$700 to $799
- 4$800 to $899
- 13$900 to $999
- 11$1,000 to $1,249
- 4$1,250 to $1,499
- 17$1,500 to $1,999
- 7$2,000 or more

Median rent in 2022:
| Young's Park: | $794 |
| Overland Park: | $1,194 |
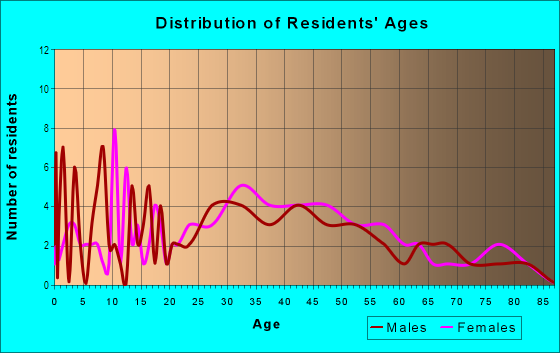
| Males: | 248 |
| Females: | 172 |
Males:
| This neighborhood: | 35.8 years |
| Whole city: | 37.7 years |
| This neighborhood: | 47.5 years |
| Whole city: | 38.8 years |
Average household size:
| Young's Park: | 2.2 people |
| Overland Park: | 2.3 people |
Percentage of family households:
| Young's Park: | 46.6% |
| Overland Park: | 42.1% |
| Here: | 46.2% |
| Overland Park: | 48.0% |
Percentage of married-couple families with children (among all households):
| Young's Park: | 45.0% |
| Overland Park: | 37.4% |
Percentage of single-mother households (among all households):
| Young's Park: | 8.9% |
| Overland Park: | 4.2% |
Percentage of never married males 15 years old and over:
Percentage of never married females 15 years old and over:
| Young's Park: | 19.9% |
| Overland Park: | 17.2% |
Percentage of never married females 15 years old and over:
| Young's Park: | 2.8% |
| city: | 15.1% |
Percentage of people that speak English not well or not at all:
| Young's Park: | 1.8% |
| Overland Park: | 1.4% |
Percentage of people born in this state:
Percentage of people born in another U.S. state:
Percentage of native residents but born outside the U.S.:
Percentage of foreign born residents:
| Here: | 37.4% |
| Overland Park: | 37.4% |
Percentage of people born in another U.S. state:
| Young's Park: | 56.6% |
| Overland Park: | 50.4% |
Percentage of native residents but born outside the U.S.:
| Here: | 1.3% |
| city: | 0.9% |
Percentage of foreign born residents:
| Here: | 4.7% |
| Overland Park: | 11.3% |
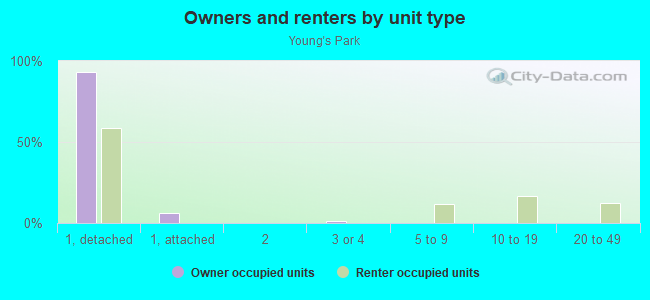
Owner-occupied
Renter-occupied

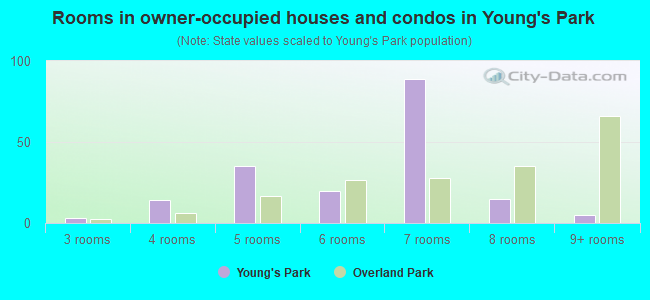
- Rooms in owner-occupied houses and condos in Young's Park
- 01 room
- 02 rooms
- 33 rooms
- 144 rooms
- 355 rooms
- 206 rooms
- 897 rooms
- 158 rooms
- 59+ rooms
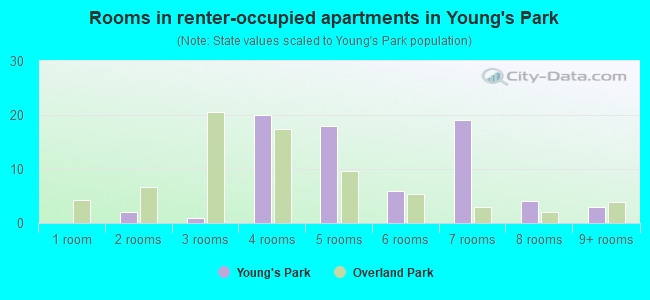
- Rooms in renter-occupied apartments in Young's Park
- 01 room
- 22 rooms
- 13 rooms
- 204 rooms
- 185 rooms
- 66 rooms
- 197 rooms
- 48 rooms
- 39+ rooms
Owner-occupied
Renter-occupied
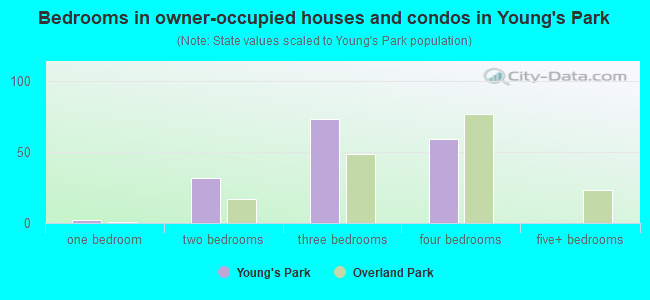
- Bedrooms in owner-occupied houses and condos in Young's Park
- 0no bedroom
- 21 bedroom
- 322 bedrooms
- 733 bedrooms
- 594 bedrooms
- 05+ bedrooms
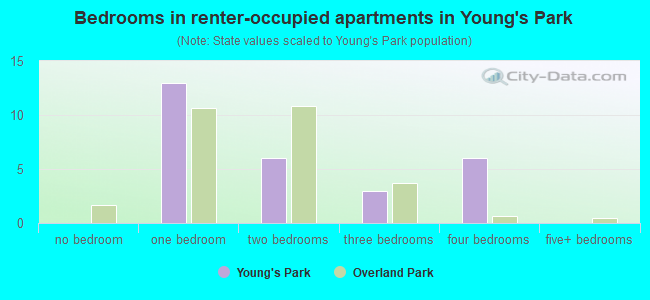
- Bedrooms in renter-occupied apartments in Young's Park
- 0no bedroom
- 131 bedroom
- 62 bedrooms
- 33 bedrooms
- 64 bedrooms
- 05+ bedrooms
Average number of cars or other vehicles available in houses/condos:
Average number of cars or other vehicles available in apartments:
| This neighborhood: | 2.0 |
| Overland Park: | 2.0 |
Average number of cars or other vehicles available in apartments:
| Here: | 1.9 |
| city: | 1.3 |
Percentage of units with a mortgage:
| Young's Park: | 78.3% |
| Overland Park: | 67.7% |
Average estimated value of detached houses in 2022 (100.0% of all units):
| Young's Park: | $233,347 |
| Kansas: | $264,181 |
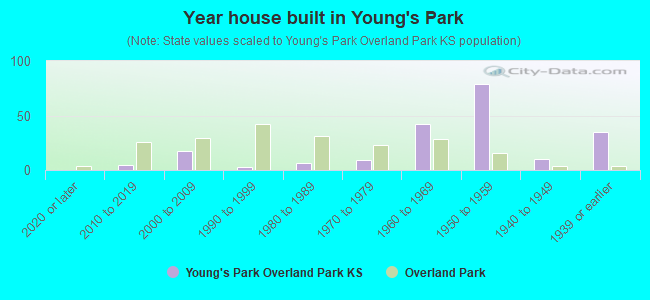
- Year house built in Young's Park
- 02020 or later
- 52010 to 2019
- 172000 to 2009
- 31990 to 1999
- 61980 to 1989
- 91970 to 1979
- 421960 to 1969
- 791950 to 1959
- 101940 to 1949
- 351939 or earlier
City-data.com crime index for city in 2020 (higher means more crime):
| City: | 154.8 |
| U.S. average: | 219.5 |
Travel time to work (commute)
![Travel time to work (commute)]()
- 1Less than 5 minutes
- 125 to 9 minutes
- 3510 to 14 minutes
- 9315 to 19 minutes
- 7320 to 24 minutes
- 2125 to 29 minutes
- 1830 to 34 minutes
- 235 to 39 minutes
- 140 to 44 minutes
- 1145 to 59 minutes
- 590 or more minutes

Means of transportation to work
![Means of transportation to work]()
- 76.2%169Drove a car alone
- 4.5%10Carpooled
- 1.4%3Walked
- 18.5%41Worked at home

Time leaving home to go to work
![Time leaving home to go to work]()
- 812:00 a.m. to 4:59 a.m.
- 15:00 a.m. to 5:29 a.m.
- 165:30 a.m. to 5:59 a.m.
- 126:00 a.m. to 6:29 a.m.
- 166:30 a.m. to 6:59 a.m.
- 307:00 a.m. to 7:29 a.m.
- 807:30 a.m. to 7:59 a.m.
- 388:00 a.m. to 8:29 a.m.
- 138:30 a.m. to 8:59 a.m.
- 259:00 a.m. to 9:59 a.m.
- 310:00 a.m. to 10:59 a.m.
- 611:00 a.m. to 11:59 a.m.
- 812:00 p.m. to 3:59 p.m.
- 104:00 p.m. to 11:59 p.m.

Occupations of males:
- Percentage of males in management occupations (except farmers):
Here: 16.9% city: 17.2%
- Percentage of males in business and financial operations occupations:
Here: 16.4% city: 9.9%
- Percentage of males in computer and mathematical occupations:
Here: 6.1% city: 11.2%
- Percentage of males in architecture and engineering occupations:
Here: 5.1% city: 5.0%
- Percentage of males in legal occupations:
Here: 2.3% city: 2.2%
- Percentage of males in education, training, and library occupations:
Here: 4.7% city: 2.4%
- Percentage of males in arts, design, entertainment, sports, and media occupations:
Here: 20.3% city: 2.6%
- Percentage of males in healthcare practitioners and technical occupations:
Here: 4.1% city: 4.1%
- Percentage of males in service occupations:
Here: 16.9% city: 9.7%
- Percentage of males in sales and office occupations:
Here: 15.7% city: 19.9%
- Percentage of males in construction, extraction, and maintenance occupations:
Here: 4.3% city: 2.8%
- Percentage of males in production occupations:
Here: 5.8% city: 2.3%
- Percentage of males in transportation occupations:
Here: 4.7% city: 3.0%
- Percentage of males in material moving occupations:
Here: 3.8% city: 2.7%
Occupations of females:
- Percentage of females in management occupations (except farmers):
Here: 14.6% city: 10.8%
- Percentage of females in business and financial operations occupations:
Here: 6.2% city: 10.2%
- Percentage of females in computer and mathematical occupations:
Here: 4.3% city: 4.6%
- Percentage of females in arts, design, entertainment, sports, and media occupations:
Here: 3.9% city: 2.8%
- Percentage of females in healthcare practitioners and technical occupations:
Here: 15.4% city: 12.1%
- Percentage of females in service occupations:
Here: 24.6% city: 13.8%
- Percentage of females in sales and office occupations:
Here: 39.2% city: 25.2%
- Percentage of females in production occupations:
Here: 1.9% city: 2.0%
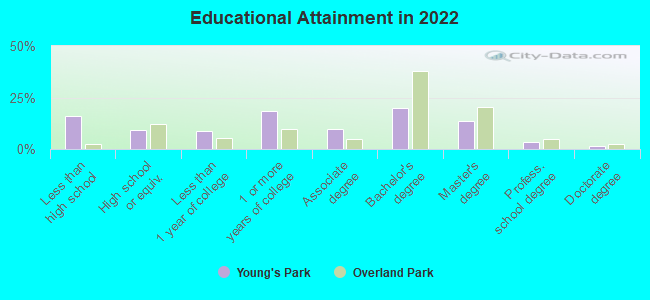
Education in this neighborhood (subdivision or community):
- Percentage of people 3 years and older in K-12 schools:
Young's Park: 15.2% Overland Park: 15.4%
- Percentage of people 3 years and older in undergraduate colleges:
Young's Park: 6.2% Overland Park: 3.4%
- Percentage of people 3 years and older in grad. or professional schools:
Young's Park: 2.5% Overland Park: 2.3%
- Percentage of students K-12 enrolled in private schools:
Young's Park: 24.6% Overland Park: 14.1%
Percentage of population below poverty level:
| Young's Park: | 10.8% |
| Overland Park: | 5.0% |
Median year owner moved in (as recorded in 2022):
Median year renter moved in (as recorded in 2022):
| Young's Park: | 2006 |
| Overland Park: | 2013 |
Median year renter moved in (as recorded in 2022):
| Young's Park: | 2017 |
| Overland Park: | 2021 |
Percentage of married-couple families with both working:
| Young's Park: | 81.3% |
| Overland Park: | 75.4% |
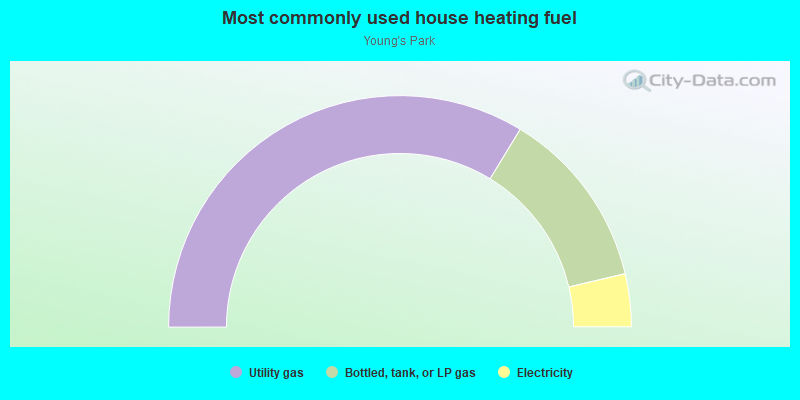
- 67.4%Utility gas
- 25.2%Bottled, tank, or LP gas
- 7.4%Electricity
Roads and streets:
Hemlock St
Length: 0.25 miles
Direction: N-S
Address range: 7678 to 7899
Direction: N-S
Address range: 7678 to 7899
W 78th St
Length: 0.16 miles
Direction: E-W
Address range: 8100 to 8299
Direction: E-W
Address range: 8100 to 8299
W 77th St
Length: 0.15 miles
Direction: E-W
Address range: 8300 to 8401
Direction: E-W
Address range: 8300 to 8401
Woodward St
Length: 0.13 miles
Directions: N-S, SE-NW
Address range: 7800 to 7899
Directions: N-S, SE-NW
Address range: 7800 to 7899
Shady Ln
Length: 0.10 miles
Directions: E-W, SE-NW, SW-NE
Address range: 8400 to 8599
Directions: E-W, SE-NW, SW-NE
Address range: 8400 to 8599
W 78th Pl
Length: 0.03 miles
Directions: E-W, SW-NE
Address range: 8200 to 8221
Directions: E-W, SW-NE
Address range: 8200 to 8221