Races in Adelanto, California (CA) Detailed Stats
Data:
Races - White alone (%)
Races - White alone (% change since 2000)
Races - Black alone (%)
Races - Black alone (% change since 2000)
Races - American Indian alone (%)
Races - American Indian alone (% change since 2000)
Races - Asian alone (%)
Races - Asian alone (% change since 2000)
Races - Hispanic (%)
Races - Hispanic (% change since 2000)
Races - Native Hawaiian and Other Pacific Islander alone (%)
Races - Native Hawaiian and Other Pacific Islander alone (% change since 2000)
Races - Two or more races(%)
Races - Two or more races(% change since 2000)
Races - Other race alone (%)
Races - Other race alone (% change since 2000)
Racial diversity
Place of birth - Born in state of residence (%)
Place of birth - Born in state of residence (%) - White
Place of birth - Born in state of residence (%) - Black or African American
Place of birth - Born in state of residence (%) - Asian
Place of birth - Born in state of residence (%) - Hispanic or Latino
Place of birth - Born in state of residence (%) - American Indian and Alaska Native
Place of birth - Born in state of residence (%) - Multirace
Place of birth - Born in state of residence (%) - Other Race
Place of birth - Born in other state (%)
Place of birth - Born in other state (%) - White
Place of birth - Born in other state (%) - Black or African American
Place of birth - Born in other state (%) - Asian
Place of birth - Born in other state (%) - Hispanic or Latino
Place of birth - Born in other state (%) - American Indian and Alaska Native
Place of birth - Born in other state (%) - Multirace
Place of birth - Born in other state (%) - Other Race
Place of birth - Native, outside of US (%)
Place of birth - Native, outside of US (%) - White
Place of birth - Native, outside of US (%) - Black or African American
Place of birth - Native, outside of US (%) - Asian
Place of birth - Native, outside of US (%) - Hispanic or Latino
Place of birth - Native, outside of US (%) - American Indian and Alaska Native
Place of birth - Native, outside of US (%) - Multirace
Place of birth - Native, outside of US (%) - Other Race
Place of birth - Foreign born (%)
Place of birth - Foreign born (%) - White
Place of birth - Foreign born (%) - Black or African American
Place of birth - Foreign born (%) - Asian
Place of birth - Foreign born (%) - Hispanic or Latino
Place of birth - Foreign born (%) - American Indian and Alaska Native
Place of birth - Foreign born (%) - Multirace
Place of birth - Foreign born (%) - Other Race
Residents speaking English at home (%)
Residents speaking English at home - Born in the United States (%)
Residents speaking English at home - Native, born elsewhere (%)
Residents speaking English at home - Foreign born (%)
Residents speaking Spanish at home (%)
Residents speaking Spanish at home - Born in the United States (%)
Residents speaking Spanish at home - Native, born elsewhere (%)
Residents speaking Spanish at home - Foreign born (%)
Residents speaking other language at home (%)
Residents speaking other language at home - Born in the United States (%)
Residents speaking other language at home - Native, born elsewhere (%)
Residents speaking other language at home - Foreign born (%)
Marital status - Never married (%)
Marital status - Now married (%)
Marital status - Separated (%)
Marital status - Widowed (%)
Marital status - Divorced (%)
Ancestries Reported - Arab (%)
Ancestries Reported - Czech (%)
Ancestries Reported - Danish (%)
Ancestries Reported - Dutch (%)
Ancestries Reported - English (%)
Ancestries Reported - French (%)
Ancestries Reported - French Canadian (%)
Ancestries Reported - German (%)
Ancestries Reported - Greek (%)
Ancestries Reported - Hungarian (%)
Ancestries Reported - Irish (%)
Ancestries Reported - Italian (%)
Ancestries Reported - Lithuanian (%)
Ancestries Reported - Norwegian (%)
Ancestries Reported - Polish (%)
Ancestries Reported - Portuguese (%)
Ancestries Reported - Russian (%)
Ancestries Reported - Scotch-Irish (%)
Ancestries Reported - Scottish (%)
Ancestries Reported - Slovak (%)
Ancestries Reported - Subsaharan African (%)
Ancestries Reported - Swedish (%)
Ancestries Reported - Swiss (%)
Ancestries Reported - Ukrainian (%)
Ancestries Reported - United States (%)
Ancestries Reported - Welsh (%)
Ancestries Reported - West Indian (%)
Ancestries Reported - Other (%)
Geographical mobility - Same house 1 year ago (%)
Geographical mobility - Same house 1 year ago (%) - White
Geographical mobility - Same house 1 year ago (%) - Black or African American
Geographical mobility - Same house 1 year ago (%) - Asian
Geographical mobility - Same house 1 year ago (%) - Hispanic or Latino
Geographical mobility - Same house 1 year ago (%) - American Indian and Alaska Native
Geographical mobility - Same house 1 year ago (%) - Multirace
Geographical mobility - Same house 1 year ago (%) - Other Race
Geographical mobility - Moved within same county (%)
Geographical mobility - Moved within same county (%) - White
Geographical mobility - Moved within same county (%) - Black or African American
Geographical mobility - Moved within same county (%) - Asian
Geographical mobility - Moved within same county (%) - Hispanic or Latino
Geographical mobility - Moved within same county (%) - American Indian and Alaska Native
Geographical mobility - Moved within same county (%) - Multirace
Geographical mobility - Moved within same county (%) - Other Race
Geographical mobility - Moved from different county within same state (%)
Geographical mobility - Moved from different county within same state (%) - White
Geographical mobility - Moved from different county within same state (%) - Black or African American
Geographical mobility - Moved from different county within same state (%) - Asian
Geographical mobility - Moved from different county within same state (%) - Hispanic or Latino
Geographical mobility - Moved from different county within same state (%) - American Indian and Alaska Native
Geographical mobility - Moved from different county within same state (%) - Multirace
Geographical mobility - Moved from different county within same state (%) - Other Race
Geographical mobility - Moved from different state (%)
Geographical mobility - Moved from different state (%) - White
Geographical mobility - Moved from different state (%) - Black or African American
Geographical mobility - Moved from different state (%) - Asian
Geographical mobility - Moved from different state (%) - Hispanic or Latino
Geographical mobility - Moved from different state (%) - American Indian and Alaska Native
Geographical mobility - Moved from different state (%) - Multirace
Geographical mobility - Moved from different state (%) - Other Race
Geographical mobility - Moved from abroad (%)
Geographical mobility - Moved from abroad (%) - White
Geographical mobility - Moved from abroad (%) - Black or African American
Geographical mobility - Moved from abroad (%) - Asian
Geographical mobility - Moved from abroad (%) - Hispanic or Latino
Geographical mobility - Moved from abroad (%) - American Indian and Alaska Native
Geographical mobility - Moved from abroad (%) - Multirace
Geographical mobility - Moved from abroad (%) - Other Race
Place of birth for the foreign-born population - Ireland (%)
Place of birth for the foreign-born population - Denmark (%)
Place of birth for the foreign-born population - Norway (%)
Place of birth for the foreign-born population - Sweden (%)
Place of birth for the foreign-born population - United Kingdom (%)
Place of birth for the foreign-born population - England (%)
Place of birth for the foreign-born population - Scotland (%)
Place of birth for the foreign-born population - Other Northern Europe (%)
Place of birth for the foreign-born population - Austria (%)
Place of birth for the foreign-born population - Belgium (%)
Place of birth for the foreign-born population - France (%)
Place of birth for the foreign-born population - Germany (%)
Place of birth for the foreign-born population - Netherlands (%)
Place of birth for the foreign-born population - Switzerland (%)
Place of birth for the foreign-born population - Other Western Europe (%)
Place of birth for the foreign-born population - Greece (%)
Place of birth for the foreign-born population - Italy (%)
Place of birth for the foreign-born population - Portugal (%)
Place of birth for the foreign-born population - Spain (%)
Place of birth for the foreign-born population - Other Southern Europe (%)
Place of birth for the foreign-born population - Albania (%)
Place of birth for the foreign-born population - Belarus (%)
Place of birth for the foreign-born population - Bosnia and Herzegovina (%)
Place of birth for the foreign-born population - Bulgaria (%)
Place of birth for the foreign-born population - Croatia (%)
Place of birth for the foreign-born population - Czechoslovakia (%)
Place of birth for the foreign-born population - Hungary (%)
Place of birth for the foreign-born population - Latvia (%)
Place of birth for the foreign-born population - Lithuania (%)
Place of birth for the foreign-born population - North Macedonia (Macedonia) (%)
Place of birth for the foreign-born population - Moldova (%)
Place of birth for the foreign-born population - Poland (%)
Place of birth for the foreign-born population - Romania (%)
Place of birth for the foreign-born population - Russia (%)
Place of birth for the foreign-born population - Serbia (%)
Place of birth for the foreign-born population - Ukraine (%)
Place of birth for the foreign-born population - Other Eastern Europe (%)
Place of birth for the foreign-born population - China (%)
Place of birth for the foreign-born population - Hong Kong (%)
Place of birth for the foreign-born population - Taiwan (%)
Place of birth for the foreign-born population - Japan (%)
Place of birth for the foreign-born population - Korea (%)
Place of birth for the foreign-born population - Other Eastern Asia (%)
Place of birth for the foreign-born population - Afghanistan (%)
Place of birth for the foreign-born population - Bangladesh (%)
Place of birth for the foreign-born population - India (%)
Place of birth for the foreign-born population - Iran (%)
Place of birth for the foreign-born population - Kazakhstan (%)
Place of birth for the foreign-born population - Nepal (%)
Place of birth for the foreign-born population - Pakistan (%)
Place of birth for the foreign-born population - Sri Lanka (%)
Place of birth for the foreign-born population - Uzbekistan (%)
Place of birth for the foreign-born population - Other South Central Asia (%)
Place of birth for the foreign-born population - Burma (%)
Place of birth for the foreign-born population - Cambodia (%)
Place of birth for the foreign-born population - Indonesia (%)
Place of birth for the foreign-born population - Laos (%)
Place of birth for the foreign-born population - Malaysia (%)
Place of birth for the foreign-born population - Philippines (%)
Place of birth for the foreign-born population - Singapore (%)
Place of birth for the foreign-born population - Thailand (%)
Place of birth for the foreign-born population - Vietnam (%)
Place of birth for the foreign-born population - Other South Eastern Asia (%)
Place of birth for the foreign-born population - Armenia (%)
Place of birth for the foreign-born population - Iraq (%)
Place of birth for the foreign-born population - Israel (%)
Place of birth for the foreign-born population - Jordan (%)
Place of birth for the foreign-born population - Kuwait (%)
Place of birth for the foreign-born population - Lebanon (%)
Place of birth for the foreign-born population - Saudi Arabia (%)
Place of birth for the foreign-born population - Syria (%)
Place of birth for the foreign-born population - Turkey (%)
Place of birth for the foreign-born population - Yemen (%)
Place of birth for the foreign-born population - Other Western Asia (%)
Place of birth for the foreign-born population - Eritrea (%)
Place of birth for the foreign-born population - Ethiopia (%)
Place of birth for the foreign-born population - Kenya (%)
Place of birth for the foreign-born population - Somalia (%)
Place of birth for the foreign-born population - Uganda (%)
Place of birth for the foreign-born population - Zimbabwe (%)
Place of birth for the foreign-born population - Other Eastern Africa (%)
Place of birth for the foreign-born population - Cameroon (%)
Place of birth for the foreign-born population - Congo (%)
Place of birth for the foreign-born population - Democratic Republic of Congo (Zaire) (%)
Place of birth for the foreign-born population - Other Middle Africa (%)
Place of birth for the foreign-born population - Egypt (%)
Place of birth for the foreign-born population - Morocco (%)
Place of birth for the foreign-born population - Sudan (%)
Place of birth for the foreign-born population - Other Northern Africa (%)
Place of birth for the foreign-born population - South Africa (%)
Place of birth for the foreign-born population - Other Southern Africa (%)
Place of birth for the foreign-born population - Cabo Verde (%)
Place of birth for the foreign-born population - Ghana (%)
Place of birth for the foreign-born population - Liberia (%)
Place of birth for the foreign-born population - Nigeria (%)
Place of birth for the foreign-born population - Senegal (%)
Place of birth for the foreign-born population - Sierra Leone (%)
Place of birth for the foreign-born population - Other Western Africa (%)
Place of birth for the foreign-born population - Australia (%)
Place of birth for the foreign-born population - New Zealand (%)
Place of birth for the foreign-born population - Fiji (%)
Place of birth for the foreign-born population - Micronesia (%)
Place of birth for the foreign-born population - Bahamas (%)
Place of birth for the foreign-born population - Barbados (%)
Place of birth for the foreign-born population - Cuba (%)
Place of birth for the foreign-born population - Dominica (%)
Place of birth for the foreign-born population - Dominican Republic (%)
Place of birth for the foreign-born population - Grenada (%)
Place of birth for the foreign-born population - Haiti (%)
Place of birth for the foreign-born population - Jamaica (%)
Place of birth for the foreign-born population - St. Vincent and the Grenadines (%)
Place of birth for the foreign-born population - Trinidad and Tobago (%)
Place of birth for the foreign-born population - West Indies (%)
Place of birth for the foreign-born population - Other Caribbean (%)
Place of birth for the foreign-born population - Belize (%)
Place of birth for the foreign-born population - Costa Rica (%)
Place of birth for the foreign-born population - El Salvador (%)
Place of birth for the foreign-born population - Guatemala (%)
Place of birth for the foreign-born population - Honduras (%)
Place of birth for the foreign-born population - Mexico (%)
Place of birth for the foreign-born population - Nicaragua (%)
Place of birth for the foreign-born population - Panama (%)
Place of birth for the foreign-born population - Other Central America (%)
Place of birth for the foreign-born population - Argentina (%)
Place of birth for the foreign-born population - Bolivia (%)
Place of birth for the foreign-born population - Brazil (%)
Place of birth for the foreign-born population - Chile (%)
Place of birth for the foreign-born population - Colombia (%)
Place of birth for the foreign-born population - Ecuador (%)
Place of birth for the foreign-born population - Guyana (%)
Place of birth for the foreign-born population - Peru (%)
Place of birth for the foreign-born population - Uruguay (%)
Place of birth for the foreign-born population - Venezuela (%)
Place of birth for the foreign-born population - Other South America (%)
Place of birth for the foreign-born population - Canada (%)
Place of birth for the foreign-born population - Other Northern America (%)
Place of birth for the foreign-born population - Other (%)
Latest news about races in Adelanto, CA collected exclusively by city-data.com from local newspapers, TV, and radio stations
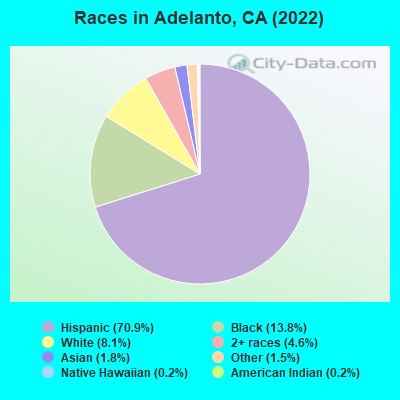
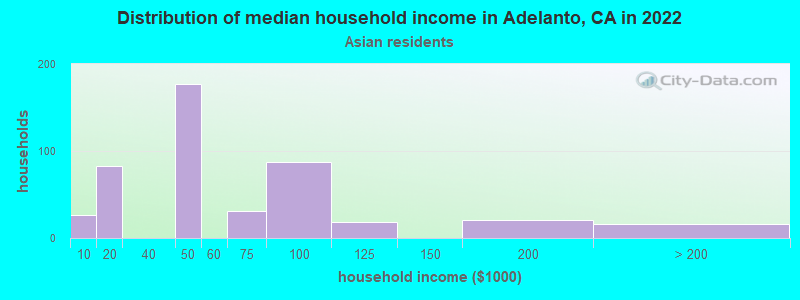
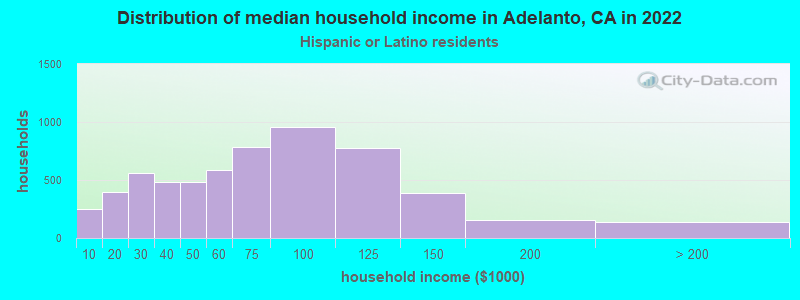
According to 2022 data, the most numerous races in Adelanto, CA are Hispanic (23,379 residents), White alone (3,645 residents), and Asian alone (588 residents). 51.9% of Adelanto residents speak English at home. 19.8% of Adelanto, CA residents are foreign-born (17.9% born in Latin America), which is 31.4% less than the foreign-born rate of 26.0% across the entire state of California.
Race distribution in Adelanto
2000 2022
15,816,790 46.7% White alone 10,966,556 32.4% Hispanic 3,648,860 10.8% Asian alone 2,181,926 6.4% Black alone 903,115 2.7% Two or more races 178,984 0.5% American Indian alone 103,736 0.3% Native Hawaiian and Other 71,681 0.2% Other race alone
15,732,184 40.3% Hispanic 13,160,426 33.7% White alone 5,957,867 15.3% Asian alone 2,025,218 5.2% Black alone 1,663,222 4.3% Two or more races 251,618 0.6% Other race alone 135,777 0.3% Native Hawaiian and Other 103,030 0.3% American Indian alone
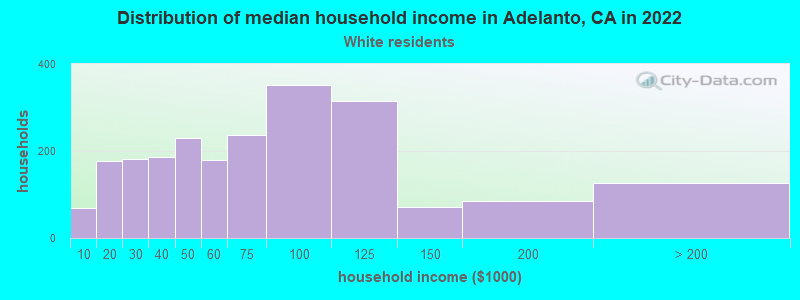
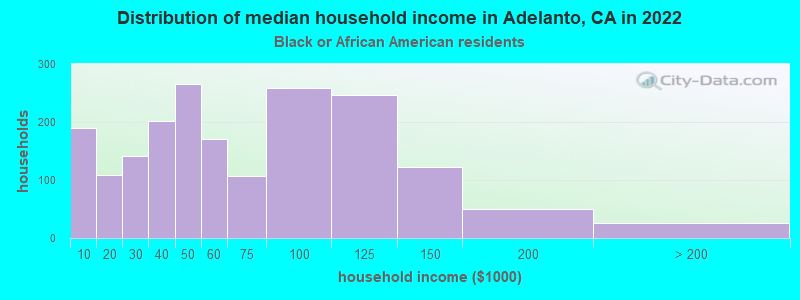
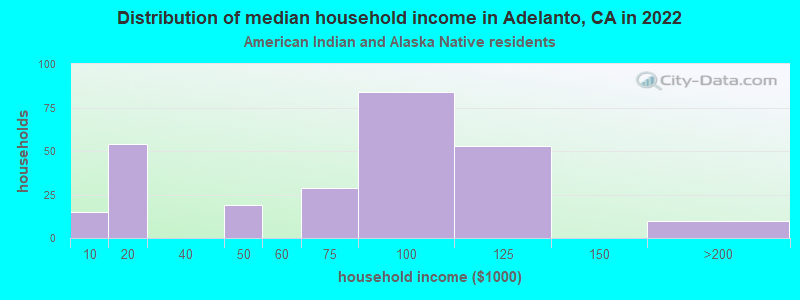
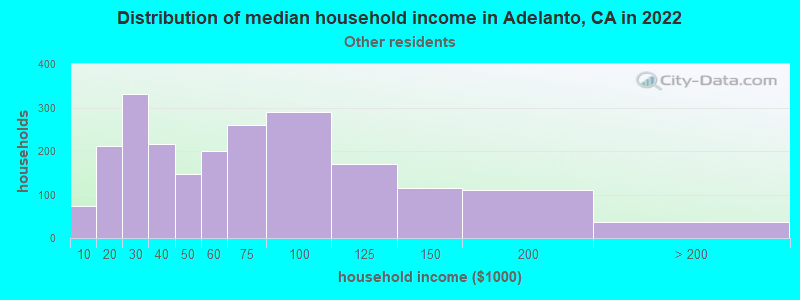
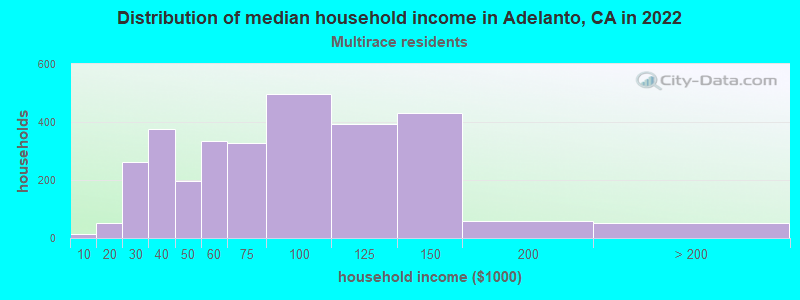
Income and house value in Adelanto Median household income in 2022 $42,802 White non-Hispanic householders$55,812 Black householders$111,786 American Indian and Alaska Native householders$68,611 Asian householdersover $200,000 Native Hawaiian and other Pacific Islander householders$58,828 Some other race householders$97,864 Two or more races householders$68,980 Hispanic or Latino race householdersMedian 2022 house value $293,342 White Non-Hispanic householders$369,647 Black or African American householders$300,541 American Indian or Alaska Native householders $296,941 Asian householders$286,863 Some other race householders$258,069 Two or more races householders$282,904 Hispanic or Latino householders
Median age by race in Adelanto
29.8 Median age for White residents30.1 29.5 29.5 Median age for Black or African American residents24.3 32.8 33.1 Median age for American Indian / Alaska Native residents68.8 20.1 36.5 Median age for Asian residents37.4 53.2 42.4 Median age for Native Hawaiian / Pacific Islander residents39.6 49.7 29.4 Median age for Other race residents31.1 27.2 15.3 Median age for Two or more races residents12.2 22.0 34.2 Median age for White alone residents33.8 35.8 27.1 Median age for Hispanic or Latino residents27.3 27.1
Owner/renter occupied households by race in Adelanto
House owners and renters - White residents 2,436 59.5% Owner occupied1,655 40.5% Renter occupiedHouse owners and renters - Black or African American residents 672 36.2% Owner occupied1,183 63.8% Renter occupiedHouse owners and renters - American Indian / Alaska Native residents 92 90.2% Owner occupied10 9.8% Renter occupiedHouse owners and renters - Asian residents 153 49.3% Owner occupied158 50.7% Renter occupiedHouse owners and renters - Native Hawaiian / Pacific Islander residents 17 88.4% Owner occupied2 11.6% Renter occupiedHouse owners and renters - Other race residents 586 73.1% Owner occupied216 26.9% Renter occupiedHouse owners and renters - Two or more races residents 594 85.7% Owner occupied99 14.3% Renter occupiedHouse owners and renters - White alone residents 615 55.6% Owner occupied491 44.4% Renter occupiedHouse owners and renters - Hispanic or Latino residents 3,144 64.0% Owner occupied1,767 36.0% Renter occupied
Language usage in Adelanto
English speakers - Total 51.9% of residents of Adelanto speak English at home.
46.0% of residents speak Spanish at home 9,306 65.3% Speak English very well4,938 34.7% Speak English less than very well1.8% of residents speak other language at home 397 71.8% Speak English very well156 28.2% Speak English less than very well
English speakers - Born in the United States 88.0% of residents of Adelanto speak English at home.
11.3% of residents speak Spanish at home 244 76.7% Speak English very well74 23.3% Speak English less than very well0.3% of residents speak other language at home 9 100.0% Speak English very well
English speakers - Native, born elsewhere 39.4% of residents of Adelanto speak English at home.
56.3% of residents speak Spanish at home 140 70.0% Speak English very well60 30.0% Speak English less than very well5.1% of residents speak other language at home 18 100.0% Speak English very well
English speakers - Foreign-born 11.8% of residents of Adelanto speak English at home.
79.6% of residents speak Spanish at home 1,435 27.2% Speak English very well3,833 72.8% Speak English less than very well6.5% of residents speak other language at home 276 64.0% Speak English very well155 36.0% Speak English less than very well
White (Caucasian) - Speak only English Native:
53.1% (6,761)Foreign-born:
8.8% (318)
White (Caucasian) - Speak another language Native:
39.9% (5,076)Foreign-born:
88.6% (3,204)
Black or African American - Speak only English Native:
96.9% (5,590)Foreign-born:
57.1% (17)
Black or African American - Speak another language Native:
2.6% (150)Foreign-born:
25.1% (8)
Asian - Speak only English Native:
93.7% (91)Foreign-born:
45.9% (237)
Asian - Speak another language Native:
12.8% (12)Foreign-born:
58.1% (300)
Native Hawaiian / Pacific Islander - Speak another language Native:
28.3% (18)Foreign-born:
100.0% (12)
Other race - Speak only English Native:
33.6% (818)Foreign-born:
17.5% (175)
Other race - Speak another language Native:
66.4% (1,617)Foreign-born:
87.4% (878)
Two or more races - Speak only English Native:
64.6% (2,138)Foreign-born:
19.1% (196)
Two or more races - Speak another language Native:
34.4% (1,138)Foreign-born:
73.5% (753)
White alone - Speak only English Native:
90.8% (3,053)Foreign-born:
11.6% (16)
White alone - Speak another language Native:
10.9% (367)Foreign-born:
94.4% (130)
Hispanic or Latino - Speak only English Native:
42.1% (6,575)Foreign-born:
10.9% (656)
Hispanic or Latino - Speak another language Native:
57.9% (9,045)Foreign-born:
90.8% (5,448)
Foreign-born residents in Adelanto 6,771 residents are foreign born (17.9% Latin America ).
This city:
19.8%California:
100.0%
Marital status for residents in Adelanto Marital status - White (Caucasian) population 15 years and over
Males 47.4% Never married40.0% Now married2.6% Separated1.2% Widowed8.8% DivorcedFemales 36.0% Never married50.1% Now married2.4% Separated4.3% Widowed7.2% DivorcedWomen who gave birth in the past 12 months Now married:
38.0% (77)Unmarried:
62.0% (126)
Women who did not give birth in the past 12 months Now married:
48.0% (1,784)Unmarried:
52.0% (1,934)
Marital status - Black or African American population 15 years and over
Males 64.7% Never married25.6% Now married1.2% Separated0.9% Widowed7.7% DivorcedFemales 49.4% Never married19.4% Now married7.8% Separated7.9% Widowed15.5% DivorcedWomen who gave birth in the past 12 months Now married:
51.8% (66)Unmarried:
48.2% (61)
Women who did not give birth in the past 12 months Now married:
22.0% (333)Unmarried:
78.0% (1,184)
Marital status - American Indian / Alaska Native population 15 years and over
Males 39.5% Never married44.2% Now married16.3% Separated0.0% Widowed0.0% DivorcedFemales 65.6% Never married23.7% Now married0.0% Separated10.8% Widowed0.0% DivorcedWomen who did not give birth in the past 12 months Now married:
26.5% (30)Unmarried:
73.5% (83)
Marital status - Asian population 15 years and over
Males 31.2% Never married62.0% Now married0.0% Separated2.8% Widowed4.0% DivorcedFemales 26.5% Never married58.7% Now married0.0% Separated9.0% Widowed5.8% DivorcedWomen who did not give birth in the past 12 months Now married:
75.6% (68)Unmarried:
24.4% (22)
Marital status - Native Hawaiian / Pacific Islander population 15 years and over
Males 22.2% Never married77.8% Now married0.0% Separated0.0% Widowed0.0% DivorcedFemales 0.0% Never married100.0% Now married0.0% Separated0.0% Widowed0.0% DivorcedWomen who did not give birth in the past 12 months Now married:
100.0% (18)Unmarried:
0.0% (0)
Marital status - Other race population 15 years and over
Males 47.5% Never married44.3% Now married1.6% Separated0.7% Widowed5.8% DivorcedFemales 39.1% Never married45.6% Now married1.9% Separated7.5% Widowed6.0% DivorcedWomen who gave birth in the past 12 months Now married:
57.1% (30)Unmarried:
42.9% (23)
Women who did not give birth in the past 12 months Now married:
39.0% (347)Unmarried:
61.0% (543)
Marital status - Two or more races population 15 years and over
Males 69.0% Never married28.6% Now married0.0% Separated0.0% Widowed2.5% DivorcedFemales 47.0% Never married27.9% Now married1.8% Separated2.6% Widowed20.7% DivorcedWomen who did not give birth in the past 12 months Now married:
25.0% (302)Unmarried:
75.0% (907)
Marital status - White alone, not Hispanic / Latino population 15 years and over
Males 43.4% Never married34.3% Now married2.0% Separated3.1% Widowed17.2% DivorcedFemales 22.2% Never married44.9% Now married2.2% Separated12.4% Widowed18.4% DivorcedWomen who gave birth in the past 12 months Now married:
86.4% (33)Unmarried:
13.6% (5)
Women who did not give birth in the past 12 months Now married:
49.2% (250)Unmarried:
50.8% (258)
Marital status - Hispanic or Latino population 15 years and over
Males 48.8% Never married41.7% Now married2.6% Separated0.6% Widowed6.3% DivorcedFemales 41.0% Never married48.2% Now married2.3% Separated3.5% Widowed5.0% DivorcedWomen who gave birth in the past 12 months Now married:
33.5% (91)Unmarried:
66.5% (180)
Women who did not give birth in the past 12 months Now married:
44.3% (2,446)Unmarried:
55.7% (3,080)
Ancestries in Adelanto
214 0.9% European194 0.8% Italian184 0.8% American172 0.7% Irish78 0.3% Canadian76 0.3% Polish75 0.3% German50 0.2% English50 0.2% African49 0.2% Scottish47 0.2% Dutch25 0.1% Nigerian22 0.09% Lebanese12 0.05% Israeli11 0.05% Czechoslovakian11 0.05% Ukrainian10 0.04% Eastern European10 0.04% Greek10 0.04% Russian5 0.02% Scotch-Irish
Geographical mobility in Adelanto Same house 1 year ago 15,226 87.6% White (Caucasian)5,154 83.8% Black or African American210 98.3% American Indian / Alaska Native487 78.9% Asian67 100.0% Native Hawaiian / Pacific Islander3,449 92.7% Other race3,635 63.9% Two or more races3,215 85.6% White alone, not Hispanic / Latino18,955 84.9% Hispanic or LatinoMoved within same county 1,142 6.6% White / Caucasian546 8.9% Black or African American8 3.6% American Indian / Alaska Native8 1.2% Asian159 4.3% Other race313 5.5% Two or more races269 7.2% White alone, not Hispanic / Latino1,688 7.6% Hispanic or LatinoMoved within same state 686 3.9% White / Caucasian272 4.4% Black or African American118 3.2% Other race195 3.4% Two or more races233 6.2% White alone, not Hispanic / Latino834 3.7% Hispanic or LatinoMoved from different state 175 1.0% White / Caucasian92 1.5% Black or African American93 15.0% Asian17 0.5% Other race935 16.4% Two or more races45 1.2% White alone, not Hispanic / Latino722 3.2% Hispanic or LatinoMoved from abroad 46 0.3% White62 0.3% Hispanic or Latino
Children Nativity (place of birth) in Adelanto
Children under 6 years - Living with two parents Both parents native 751 100.0% NativeBoth parents foreign-born 350 100.0% NativeOne native, one foreign-born parent 512 100.0% NativeChildren under 6 years - Living with one parent Native parent 1,159 100.0% NativeForeign-born parent 132 100.0% NativeChildren 6 to 17 years - Living with two parents Both parents native 1,985 100.0% Native1 0.0% Foreign-bornBoth parents foreign-born 1,214 92.8% Native94 7.2% Foreign-bornOne native, one foreign-born parent 950 100.0% NativeChildren 6 to 17 years - Living with one parent Native parent 2,362 100.0% NativeForeign-born parent 821 50.0% Native823 50.0% Foreign-born
Grandparents responsible for own grandchildren in Adelanto
Grandparents (30 to 59 years) White / Caucasian 80 44.3% Responsible for grandchildren100 55.7% Not responsible for grandchildrenBlack or African American 62 37.9% Responsible for grandchildren102 62.1% Not responsible for grandchildrenAmerican Indian / Alaska Native 26 100.0% Not responsible for grandchildrenOther race 20 56.7% Responsible for grandchildren15 43.3% Not responsible for grandchildrenTwo or more races 67 100.0% Responsible for grandchildrenWhite alone, not Hispanic / Latino 0 9.5% Responsible for grandchildren3 90.5% Not responsible for grandchildrenHispanic or Latino 178 49.8% Responsible for grandchildren180 50.2% Not responsible for grandchildrenGrandparents (60 years and over) White / Caucasian 266 100.0% Not responsible for grandchildrenBlack or African American 54 46.7% Responsible for grandchildren61 53.3% Not responsible for grandchildrenOther race 260 100.0% Not responsible for grandchildrenTwo or more races 74 100.0% Responsible for grandchildrenWhite alone, not Hispanic / Latino 43 100.0% Not responsible for grandchildrenHispanic or Latino 511 100.0% Not responsible for grandchildren