Races in Alondra Park, California (CA) Detailed Stats
Data:
Races - White alone (%)
Races - White alone (% change since 2000)
Races - Black alone (%)
Races - Black alone (% change since 2000)
Races - American Indian alone (%)
Races - American Indian alone (% change since 2000)
Races - Asian alone (%)
Races - Asian alone (% change since 2000)
Races - Hispanic (%)
Races - Hispanic (% change since 2000)
Races - Native Hawaiian and Other Pacific Islander alone (%)
Races - Native Hawaiian and Other Pacific Islander alone (% change since 2000)
Races - Two or more races(%)
Races - Two or more races(% change since 2000)
Races - Other race alone (%)
Races - Other race alone (% change since 2000)
Racial diversity
Place of birth - Born in state of residence (%)
Place of birth - Born in state of residence (%) - White
Place of birth - Born in state of residence (%) - Black or African American
Place of birth - Born in state of residence (%) - Asian
Place of birth - Born in state of residence (%) - Hispanic or Latino
Place of birth - Born in state of residence (%) - American Indian and Alaska Native
Place of birth - Born in state of residence (%) - Multirace
Place of birth - Born in state of residence (%) - Other Race
Place of birth - Born in other state (%)
Place of birth - Born in other state (%) - White
Place of birth - Born in other state (%) - Black or African American
Place of birth - Born in other state (%) - Asian
Place of birth - Born in other state (%) - Hispanic or Latino
Place of birth - Born in other state (%) - American Indian and Alaska Native
Place of birth - Born in other state (%) - Multirace
Place of birth - Born in other state (%) - Other Race
Place of birth - Native, outside of US (%)
Place of birth - Native, outside of US (%) - White
Place of birth - Native, outside of US (%) - Black or African American
Place of birth - Native, outside of US (%) - Asian
Place of birth - Native, outside of US (%) - Hispanic or Latino
Place of birth - Native, outside of US (%) - American Indian and Alaska Native
Place of birth - Native, outside of US (%) - Multirace
Place of birth - Native, outside of US (%) - Other Race
Place of birth - Foreign born (%)
Place of birth - Foreign born (%) - White
Place of birth - Foreign born (%) - Black or African American
Place of birth - Foreign born (%) - Asian
Place of birth - Foreign born (%) - Hispanic or Latino
Place of birth - Foreign born (%) - American Indian and Alaska Native
Place of birth - Foreign born (%) - Multirace
Place of birth - Foreign born (%) - Other Race
Residents speaking English at home (%)
Residents speaking English at home - Born in the United States (%)
Residents speaking English at home - Native, born elsewhere (%)
Residents speaking English at home - Foreign born (%)
Residents speaking Spanish at home (%)
Residents speaking Spanish at home - Born in the United States (%)
Residents speaking Spanish at home - Native, born elsewhere (%)
Residents speaking Spanish at home - Foreign born (%)
Residents speaking other language at home (%)
Residents speaking other language at home - Born in the United States (%)
Residents speaking other language at home - Native, born elsewhere (%)
Residents speaking other language at home - Foreign born (%)
Marital status - Never married (%)
Marital status - Now married (%)
Marital status - Separated (%)
Marital status - Widowed (%)
Marital status - Divorced (%)
Ancestries Reported - Arab (%)
Ancestries Reported - Czech (%)
Ancestries Reported - Danish (%)
Ancestries Reported - Dutch (%)
Ancestries Reported - English (%)
Ancestries Reported - French (%)
Ancestries Reported - French Canadian (%)
Ancestries Reported - German (%)
Ancestries Reported - Greek (%)
Ancestries Reported - Hungarian (%)
Ancestries Reported - Irish (%)
Ancestries Reported - Italian (%)
Ancestries Reported - Lithuanian (%)
Ancestries Reported - Norwegian (%)
Ancestries Reported - Polish (%)
Ancestries Reported - Portuguese (%)
Ancestries Reported - Russian (%)
Ancestries Reported - Scotch-Irish (%)
Ancestries Reported - Scottish (%)
Ancestries Reported - Slovak (%)
Ancestries Reported - Subsaharan African (%)
Ancestries Reported - Swedish (%)
Ancestries Reported - Swiss (%)
Ancestries Reported - Ukrainian (%)
Ancestries Reported - United States (%)
Ancestries Reported - Welsh (%)
Ancestries Reported - West Indian (%)
Ancestries Reported - Other (%)
Geographical mobility - Same house 1 year ago (%)
Geographical mobility - Same house 1 year ago (%) - White
Geographical mobility - Same house 1 year ago (%) - Black or African American
Geographical mobility - Same house 1 year ago (%) - Asian
Geographical mobility - Same house 1 year ago (%) - Hispanic or Latino
Geographical mobility - Same house 1 year ago (%) - American Indian and Alaska Native
Geographical mobility - Same house 1 year ago (%) - Multirace
Geographical mobility - Same house 1 year ago (%) - Other Race
Geographical mobility - Moved within same county (%)
Geographical mobility - Moved within same county (%) - White
Geographical mobility - Moved within same county (%) - Black or African American
Geographical mobility - Moved within same county (%) - Asian
Geographical mobility - Moved within same county (%) - Hispanic or Latino
Geographical mobility - Moved within same county (%) - American Indian and Alaska Native
Geographical mobility - Moved within same county (%) - Multirace
Geographical mobility - Moved within same county (%) - Other Race
Geographical mobility - Moved from different county within same state (%)
Geographical mobility - Moved from different county within same state (%) - White
Geographical mobility - Moved from different county within same state (%) - Black or African American
Geographical mobility - Moved from different county within same state (%) - Asian
Geographical mobility - Moved from different county within same state (%) - Hispanic or Latino
Geographical mobility - Moved from different county within same state (%) - American Indian and Alaska Native
Geographical mobility - Moved from different county within same state (%) - Multirace
Geographical mobility - Moved from different county within same state (%) - Other Race
Geographical mobility - Moved from different state (%)
Geographical mobility - Moved from different state (%) - White
Geographical mobility - Moved from different state (%) - Black or African American
Geographical mobility - Moved from different state (%) - Asian
Geographical mobility - Moved from different state (%) - Hispanic or Latino
Geographical mobility - Moved from different state (%) - American Indian and Alaska Native
Geographical mobility - Moved from different state (%) - Multirace
Geographical mobility - Moved from different state (%) - Other Race
Geographical mobility - Moved from abroad (%)
Geographical mobility - Moved from abroad (%) - White
Geographical mobility - Moved from abroad (%) - Black or African American
Geographical mobility - Moved from abroad (%) - Asian
Geographical mobility - Moved from abroad (%) - Hispanic or Latino
Geographical mobility - Moved from abroad (%) - American Indian and Alaska Native
Geographical mobility - Moved from abroad (%) - Multirace
Geographical mobility - Moved from abroad (%) - Other Race
Place of birth for the foreign-born population - Ireland (%)
Place of birth for the foreign-born population - Denmark (%)
Place of birth for the foreign-born population - Norway (%)
Place of birth for the foreign-born population - Sweden (%)
Place of birth for the foreign-born population - United Kingdom (%)
Place of birth for the foreign-born population - England (%)
Place of birth for the foreign-born population - Scotland (%)
Place of birth for the foreign-born population - Other Northern Europe (%)
Place of birth for the foreign-born population - Austria (%)
Place of birth for the foreign-born population - Belgium (%)
Place of birth for the foreign-born population - France (%)
Place of birth for the foreign-born population - Germany (%)
Place of birth for the foreign-born population - Netherlands (%)
Place of birth for the foreign-born population - Switzerland (%)
Place of birth for the foreign-born population - Other Western Europe (%)
Place of birth for the foreign-born population - Greece (%)
Place of birth for the foreign-born population - Italy (%)
Place of birth for the foreign-born population - Portugal (%)
Place of birth for the foreign-born population - Spain (%)
Place of birth for the foreign-born population - Other Southern Europe (%)
Place of birth for the foreign-born population - Albania (%)
Place of birth for the foreign-born population - Belarus (%)
Place of birth for the foreign-born population - Bosnia and Herzegovina (%)
Place of birth for the foreign-born population - Bulgaria (%)
Place of birth for the foreign-born population - Croatia (%)
Place of birth for the foreign-born population - Czechoslovakia (%)
Place of birth for the foreign-born population - Hungary (%)
Place of birth for the foreign-born population - Latvia (%)
Place of birth for the foreign-born population - Lithuania (%)
Place of birth for the foreign-born population - North Macedonia (Macedonia) (%)
Place of birth for the foreign-born population - Moldova (%)
Place of birth for the foreign-born population - Poland (%)
Place of birth for the foreign-born population - Romania (%)
Place of birth for the foreign-born population - Russia (%)
Place of birth for the foreign-born population - Serbia (%)
Place of birth for the foreign-born population - Ukraine (%)
Place of birth for the foreign-born population - Other Eastern Europe (%)
Place of birth for the foreign-born population - China (%)
Place of birth for the foreign-born population - Hong Kong (%)
Place of birth for the foreign-born population - Taiwan (%)
Place of birth for the foreign-born population - Japan (%)
Place of birth for the foreign-born population - Korea (%)
Place of birth for the foreign-born population - Other Eastern Asia (%)
Place of birth for the foreign-born population - Afghanistan (%)
Place of birth for the foreign-born population - Bangladesh (%)
Place of birth for the foreign-born population - India (%)
Place of birth for the foreign-born population - Iran (%)
Place of birth for the foreign-born population - Kazakhstan (%)
Place of birth for the foreign-born population - Nepal (%)
Place of birth for the foreign-born population - Pakistan (%)
Place of birth for the foreign-born population - Sri Lanka (%)
Place of birth for the foreign-born population - Uzbekistan (%)
Place of birth for the foreign-born population - Other South Central Asia (%)
Place of birth for the foreign-born population - Burma (%)
Place of birth for the foreign-born population - Cambodia (%)
Place of birth for the foreign-born population - Indonesia (%)
Place of birth for the foreign-born population - Laos (%)
Place of birth for the foreign-born population - Malaysia (%)
Place of birth for the foreign-born population - Philippines (%)
Place of birth for the foreign-born population - Singapore (%)
Place of birth for the foreign-born population - Thailand (%)
Place of birth for the foreign-born population - Vietnam (%)
Place of birth for the foreign-born population - Other South Eastern Asia (%)
Place of birth for the foreign-born population - Armenia (%)
Place of birth for the foreign-born population - Iraq (%)
Place of birth for the foreign-born population - Israel (%)
Place of birth for the foreign-born population - Jordan (%)
Place of birth for the foreign-born population - Kuwait (%)
Place of birth for the foreign-born population - Lebanon (%)
Place of birth for the foreign-born population - Saudi Arabia (%)
Place of birth for the foreign-born population - Syria (%)
Place of birth for the foreign-born population - Turkey (%)
Place of birth for the foreign-born population - Yemen (%)
Place of birth for the foreign-born population - Other Western Asia (%)
Place of birth for the foreign-born population - Eritrea (%)
Place of birth for the foreign-born population - Ethiopia (%)
Place of birth for the foreign-born population - Kenya (%)
Place of birth for the foreign-born population - Somalia (%)
Place of birth for the foreign-born population - Uganda (%)
Place of birth for the foreign-born population - Zimbabwe (%)
Place of birth for the foreign-born population - Other Eastern Africa (%)
Place of birth for the foreign-born population - Cameroon (%)
Place of birth for the foreign-born population - Congo (%)
Place of birth for the foreign-born population - Democratic Republic of Congo (Zaire) (%)
Place of birth for the foreign-born population - Other Middle Africa (%)
Place of birth for the foreign-born population - Egypt (%)
Place of birth for the foreign-born population - Morocco (%)
Place of birth for the foreign-born population - Sudan (%)
Place of birth for the foreign-born population - Other Northern Africa (%)
Place of birth for the foreign-born population - South Africa (%)
Place of birth for the foreign-born population - Other Southern Africa (%)
Place of birth for the foreign-born population - Cabo Verde (%)
Place of birth for the foreign-born population - Ghana (%)
Place of birth for the foreign-born population - Liberia (%)
Place of birth for the foreign-born population - Nigeria (%)
Place of birth for the foreign-born population - Senegal (%)
Place of birth for the foreign-born population - Sierra Leone (%)
Place of birth for the foreign-born population - Other Western Africa (%)
Place of birth for the foreign-born population - Australia (%)
Place of birth for the foreign-born population - New Zealand (%)
Place of birth for the foreign-born population - Fiji (%)
Place of birth for the foreign-born population - Micronesia (%)
Place of birth for the foreign-born population - Bahamas (%)
Place of birth for the foreign-born population - Barbados (%)
Place of birth for the foreign-born population - Cuba (%)
Place of birth for the foreign-born population - Dominica (%)
Place of birth for the foreign-born population - Dominican Republic (%)
Place of birth for the foreign-born population - Grenada (%)
Place of birth for the foreign-born population - Haiti (%)
Place of birth for the foreign-born population - Jamaica (%)
Place of birth for the foreign-born population - St. Vincent and the Grenadines (%)
Place of birth for the foreign-born population - Trinidad and Tobago (%)
Place of birth for the foreign-born population - West Indies (%)
Place of birth for the foreign-born population - Other Caribbean (%)
Place of birth for the foreign-born population - Belize (%)
Place of birth for the foreign-born population - Costa Rica (%)
Place of birth for the foreign-born population - El Salvador (%)
Place of birth for the foreign-born population - Guatemala (%)
Place of birth for the foreign-born population - Honduras (%)
Place of birth for the foreign-born population - Mexico (%)
Place of birth for the foreign-born population - Nicaragua (%)
Place of birth for the foreign-born population - Panama (%)
Place of birth for the foreign-born population - Other Central America (%)
Place of birth for the foreign-born population - Argentina (%)
Place of birth for the foreign-born population - Bolivia (%)
Place of birth for the foreign-born population - Brazil (%)
Place of birth for the foreign-born population - Chile (%)
Place of birth for the foreign-born population - Colombia (%)
Place of birth for the foreign-born population - Ecuador (%)
Place of birth for the foreign-born population - Guyana (%)
Place of birth for the foreign-born population - Peru (%)
Place of birth for the foreign-born population - Uruguay (%)
Place of birth for the foreign-born population - Venezuela (%)
Place of birth for the foreign-born population - Other South America (%)
Place of birth for the foreign-born population - Canada (%)
Place of birth for the foreign-born population - Other Northern America (%)
Place of birth for the foreign-born population - Other (%)
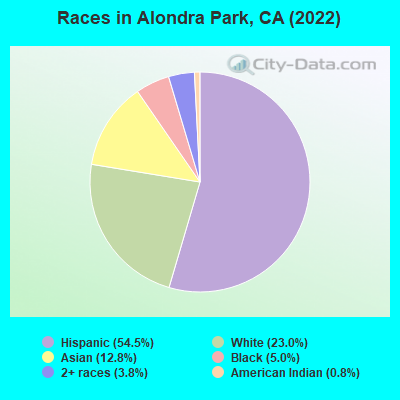
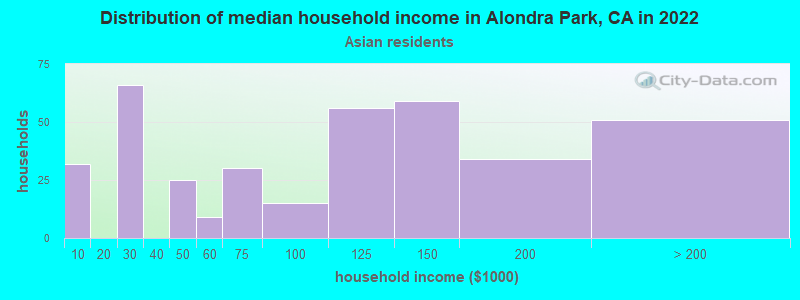
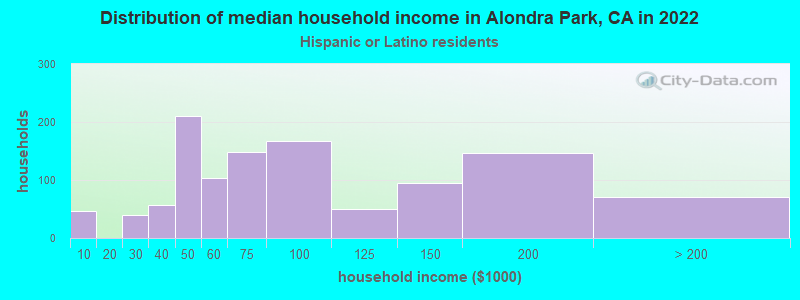
According to 2022 data, the most numerous races in Alondra Park, CA are Hispanic (4,652 residents), White alone (1,488 residents), and Asian alone (1,396 residents). 40.6% of Alondra Park residents speak English at home. 39.5% of Alondra Park, CA residents are foreign-born (26.7% born in Latin America, 10.2% born in Asia), which is 34.2% greater than the foreign-born rate of 26.0% across the entire state of California.
Race distribution in Alondra Park
2000 2022
15,816,790 46.7% White alone 10,966,556 32.4% Hispanic 3,648,860 10.8% Asian alone 2,181,926 6.4% Black alone 903,115 2.7% Two or more races 178,984 0.5% American Indian alone 103,736 0.3% Native Hawaiian and Other 71,681 0.2% Other race alone
15,732,184 40.3% Hispanic 13,160,426 33.7% White alone 5,957,867 15.3% Asian alone 2,025,218 5.2% Black alone 1,663,222 4.3% Two or more races 251,618 0.6% Other race alone 135,777 0.3% Native Hawaiian and Other 103,030 0.3% American Indian alone
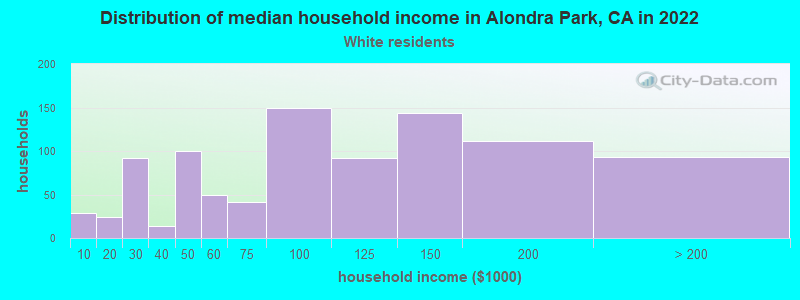
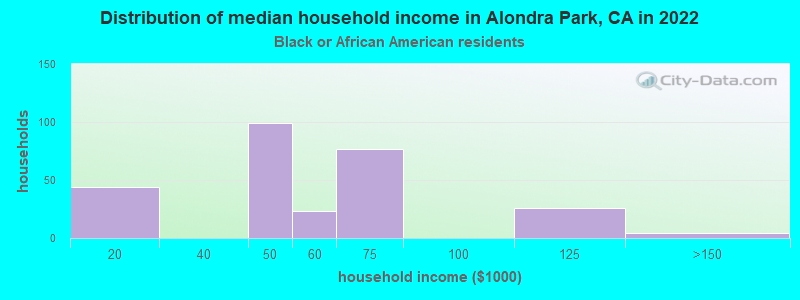
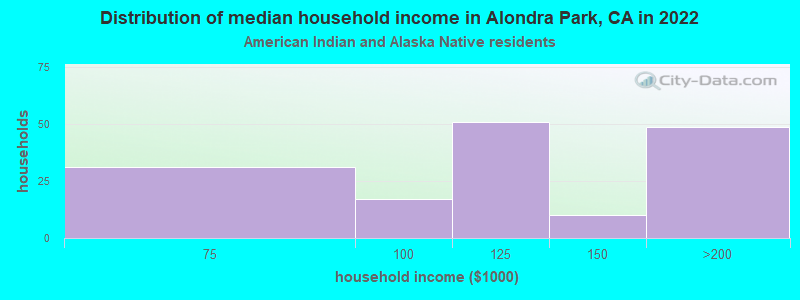
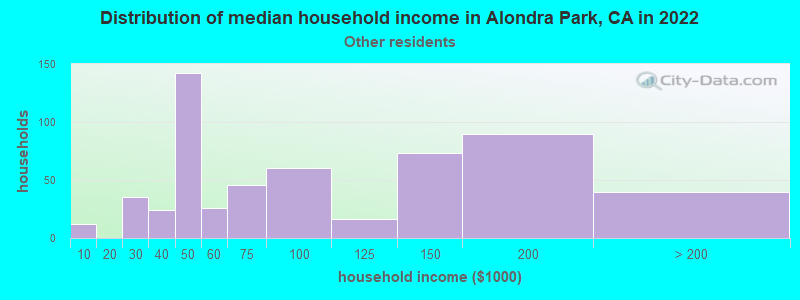
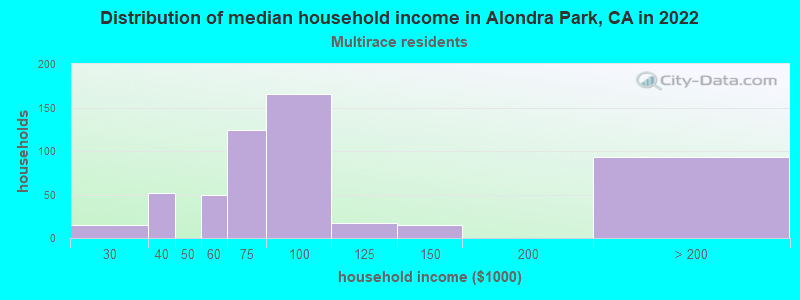
Income and house value in Alondra Park Median household income in 2022 $94,121 White non-Hispanic householders$61,734 Black householdersover $200,000 American Indian and Alaska Native householders$105,316 Asian householdersover $200,000 Native Hawaiian and other Pacific Islander householders$55,713 Some other race householders$89,086 Two or more races householders$70,257 Hispanic or Latino race householdersMedian 2022 house value $713,740 White Non-Hispanic householders$650,032 Black or African American householders $785,726 Asian householders$659,750 Some other race householders$650,392 Two or more races householders$652,912 Hispanic or Latino householders
Median age by race in Alondra Park
44.9 Median age for White residents48.2 44.4 39.3 Median age for Black or African American residents39.6 35.2 28.1 Median age for American Indian / Alaska Native residents27.6 28.0 49.8 Median age for Asian residents43.2 55.1 22.4 Median age for Native Hawaiian / Pacific Islander residents5.3 33.8 30.1 Median age for Other race residents24.7 32.9 22.2 Median age for Two or more races residents14.5 25.1 50.2 Median age for White alone residents48.5 55.8 30.3 Median age for Hispanic or Latino residents29.6 32.2
Owner/renter occupied households by race in Alondra Park
House owners and renters - White residents 695 67.5% Owner occupied335 32.5% Renter occupiedHouse owners and renters - Black or African American residents 6 2.0% Owner occupied295 98.0% Renter occupiedHouse owners and renters - American Indian / Alaska Native residents 6 4.9% Owner occupied118 95.1% Renter occupiedHouse owners and renters - Asian residents 370 77.8% Owner occupied106 22.2% Renter occupiedHouse owners and renters - Native Hawaiian / Pacific Islander residents 8 100.0% Owner occupiedHouse owners and renters - Other race residents 111 17.1% Owner occupied541 82.9% Renter occupiedHouse owners and renters - Two or more races residents 207 65.3% Owner occupied110 34.7% Renter occupiedHouse owners and renters - White alone residents 508 77.4% Owner occupied148 22.6% Renter occupiedHouse owners and renters - Hispanic or Latino residents 402 31.1% Owner occupied891 68.9% Renter occupied
Language usage in Alondra Park
English speakers - Total 40.6% of residents of Alondra Park speak English at home.
44.1% of residents speak Spanish at home 1,554 46.1% Speak English very well1,820 53.9% Speak English less than very well14.6% of residents speak other language at home 654 58.7% Speak English very well460 41.3% Speak English less than very well
English speakers - Born in the United States 90.0% of residents of Alondra Park speak English at home.
5.5% of residents speak Spanish at home 42 100.0% Speak English very well4.3% of residents speak other language at home 33 100.0% Speak English very well
English speakers - Native, born elsewhere 79.7% of residents of Alondra Park speak English at home.
18.6% of residents speak other language at home 8 72.7% Speak English very well3 27.3% Speak English less than very well
English speakers - Foreign-born 8.6% of residents of Alondra Park speak English at home.
64.0% of residents speak Spanish at home 505 24.8% Speak English very well1,529 75.2% Speak English less than very well25.7% of residents speak other language at home 370 45.3% Speak English very well446 54.7% Speak English less than very well
White (Caucasian) - Speak only English Native:
82.4% (1,502)Foreign-born:
23.7% (121)
White (Caucasian) - Speak another language Native:
16.5% (301)Foreign-born:
77.7% (398)
Black or African American - Speak only English Native:
98.8% (404)Foreign-born:
40.2% (30)
American Indian / Alaska Native - Speak another language Native:
100.0% (152)Foreign-born:
99.6% (745)
Asian - Speak only English Native:
56.1% (356)Foreign-born:
11.4% (92)
Asian - Speak another language Native:
43.8% (278)Foreign-born:
88.7% (717)
Other race - Speak another language Native:
69.7% (721)Foreign-born:
98.5% (1,162)
Two or more races - Speak another language Native:
93.9% (663)Foreign-born:
100.0% (452)
White alone - Speak only English Native:
95.8% (1,253)Foreign-born:
41.9% (49)
White alone - Speak another language Native:
4.1% (54)Foreign-born:
57.1% (67)
Hispanic or Latino - Speak only English Native:
39.2% (831)Foreign-born:
5.1% (106)
Hispanic or Latino - Speak another language Native:
60.6% (1,283)Foreign-born:
94.8% (1,981)
Foreign-born residents in Alondra Park 3,263 residents are foreign born (26.7% Latin America , 10.2% Asia ).
This city:
39.5%California:
100.0%
Marital status for residents in Alondra Park Marital status - White (Caucasian) population 15 years and over
Males 33.0% Never married55.4% Now married0.0% Separated0.0% Widowed11.6% DivorcedFemales 16.5% Never married57.4% Now married1.0% Separated10.4% Widowed14.7% DivorcedWomen who gave birth in the past 12 months Now married:
100.0% (41)Unmarried:
0.0% (0)
Women who did not give birth in the past 12 months Now married:
59.8% (231)Unmarried:
40.2% (156)
Marital status - Black or African American population 15 years and over
Males 68.8% Never married31.2% Now married0.0% Separated0.0% Widowed0.0% DivorcedFemales 65.6% Never married24.5% Now married0.0% Separated0.0% Widowed9.8% DivorcedWomen who gave birth in the past 12 months Now married:
56.4% (20)Unmarried:
43.6% (16)
Women who did not give birth in the past 12 months Now married:
12.8% (10)Unmarried:
87.2% (69)
Marital status - American Indian / Alaska Native population 15 years and over
Males 13.9% Never married86.1% Now married0.0% Separated0.0% Widowed0.0% DivorcedFemales 38.0% Never married22.0% Now married40.0% Separated0.0% Widowed0.0% DivorcedWomen who did not give birth in the past 12 months Now married:
60.0% (74)Unmarried:
40.0% (50)
Marital status - Asian population 15 years and over
Males 34.5% Never married59.1% Now married2.6% Separated3.7% Widowed0.0% DivorcedFemales 40.6% Never married45.1% Now married0.0% Separated9.4% Widowed4.8% DivorcedWomen who did not give birth in the past 12 months Now married:
35.3% (121)Unmarried:
64.7% (222)
Marital status - Native Hawaiian / Pacific Islander population 15 years and over
Males 71.4% Never married28.6% Now married0.0% Separated0.0% Widowed0.0% DivorcedFemales 38.1% Never married61.9% Now married0.0% Separated0.0% Widowed0.0% DivorcedWomen who did not give birth in the past 12 months Now married:
50.0% (8)Unmarried:
50.0% (8)
Marital status - Other race population 15 years and over
Males 50.7% Never married32.2% Now married5.2% Separated0.0% Widowed12.0% DivorcedFemales 45.6% Never married34.7% Now married3.2% Separated3.9% Widowed12.5% DivorcedWomen who gave birth in the past 12 months Now married:
100.0% (11)Unmarried:
0.0% (0)
Women who did not give birth in the past 12 months Now married:
36.8% (255)Unmarried:
63.2% (438)
Marital status - Two or more races population 15 years and over
Males 23.1% Never married76.9% Now married0.0% Separated0.0% Widowed0.0% DivorcedFemales 46.7% Never married40.9% Now married0.0% Separated8.8% Widowed3.6% DivorcedWomen who gave birth in the past 12 months Now married:
100.0% (32)Unmarried:
0.0% (0)
Women who did not give birth in the past 12 months Now married:
38.0% (103)Unmarried:
62.0% (168)
Marital status - White alone, not Hispanic / Latino population 15 years and over
Males 36.0% Never married54.0% Now married0.0% Separated0.0% Widowed10.0% DivorcedFemales 17.2% Never married51.1% Now married1.7% Separated13.8% Widowed16.1% DivorcedWomen who gave birth in the past 12 months Now married:
100.0% (12)Unmarried:
0.0% (0)
Women who did not give birth in the past 12 months Now married:
52.4% (101)Unmarried:
47.6% (92)
Marital status - Hispanic or Latino population 15 years and over
Males 39.1% Never married48.6% Now married2.5% Separated0.0% Widowed9.8% DivorcedFemales 36.4% Never married42.5% Now married4.3% Separated5.2% Widowed11.5% DivorcedWomen who gave birth in the past 12 months Now married:
100.0% (50)Unmarried:
0.0% (0)
Women who did not give birth in the past 12 months Now married:
45.4% (507)Unmarried:
54.6% (611)
Ancestries in Alondra Park
223 4.1% American72 1.3% Afghan57 1.0% Irish47 0.9% African42 0.8% Nigerian36 0.7% English35 0.6% Italian27 0.5% European25 0.5% Eastern European22 0.4% German21 0.4% Yugoslavian17 0.3% Dutch15 0.3% Swedish13 0.2% Scottish9 0.2% Norwegian8 0.1% British7 0.1% Armenian7 0.1% Ukrainian6 0.1% French Canadian5 0.09% Lebanese5 0.09% Finnish
Geographical mobility in Alondra Park Same house 1 year ago 2,368 94.2% White (Caucasian)365 73.9% Black or African American701 92.3% American Indian / Alaska Native1,330 91.9% Asian63 88.5% Native Hawaiian / Pacific Islander2,027 82.9% Other race1,119 98.7% Two or more races1,385 92.2% White alone, not Hispanic / Latino4,114 88.3% Hispanic or LatinoMoved within same county 52 2.1% White / Caucasian108 21.8% Black or African American128 8.8% Asian7 10.4% Native Hawaiian / Pacific Islander288 11.8% Other race55 4.8% Two or more races40 2.7% White alone, not Hispanic / Latino329 7.1% Hispanic or LatinoMoved within same state 12 0.5% White / Caucasian67 2.7% Other race7 0.4% White alone, not Hispanic / Latino103 2.2% Hispanic or LatinoMoved from different state 73 2.9% White / Caucasian76 5.1% White alone, not Hispanic / LatinoMoved from abroad 28 1.1% White8 1.6% Black or African American73 9.6% American Indian / Alaska Native102 2.2% Hispanic or Latino
Children Nativity (place of birth) in Alondra Park
Children under 6 years - Living with two parents Both parents native 218 99.9% Native0 0.1% Foreign-bornBoth parents foreign-born 216 94.9% Native12 5.1% Foreign-bornOne native, one foreign-born parent 119 100.0% NativeChildren under 6 years - Living with one parent Native parent 92 100.0% NativeChildren 6 to 17 years - Living with two parents Both parents native 274 100.0% NativeBoth parents foreign-born 339 73.4% Native123 26.6% Foreign-bornOne native, one foreign-born parent 123 100.0% NativeChildren 6 to 17 years - Living with one parent Native parent 102 100.0% NativeForeign-born parent 72 63.1% Native42 36.9% Foreign-born
Grandparents responsible for own grandchildren in Alondra Park
Grandparents (30 to 59 years) White / Caucasian 17 100.0% Not responsible for grandchildrenAmerican Indian / Alaska Native 39 100.0% Not responsible for grandchildrenAsian 7 100.0% Responsible for grandchildrenNative Hawaiian / Pacific Islander 13 100.0% Not responsible for grandchildrenOther race 7 100.0% Not responsible for grandchildrenWhite alone, not Hispanic / Latino 10 100.0% Not responsible for grandchildrenHispanic or Latino 42 100.0% Not responsible for grandchildrenGrandparents (60 years and over) White / Caucasian 7 18.5% Responsible for grandchildren30 81.5% Not responsible for grandchildrenAsian 32 100.0% Not responsible for grandchildrenOther race 98 100.0% Not responsible for grandchildrenWhite alone, not Hispanic / Latino 8 16.6% Responsible for grandchildren41 83.4% Not responsible for grandchildrenHispanic or Latino 105 100.0% Not responsible for grandchildren