Races in Altus, Oklahoma (OK) Detailed Stats
Data:
Races - White alone (%)
Races - White alone (% change since 2000)
Races - Black alone (%)
Races - Black alone (% change since 2000)
Races - American Indian alone (%)
Races - American Indian alone (% change since 2000)
Races - Asian alone (%)
Races - Asian alone (% change since 2000)
Races - Hispanic (%)
Races - Hispanic (% change since 2000)
Races - Native Hawaiian and Other Pacific Islander alone (%)
Races - Native Hawaiian and Other Pacific Islander alone (% change since 2000)
Races - Two or more races(%)
Races - Two or more races(% change since 2000)
Races - Other race alone (%)
Races - Other race alone (% change since 2000)
Racial diversity
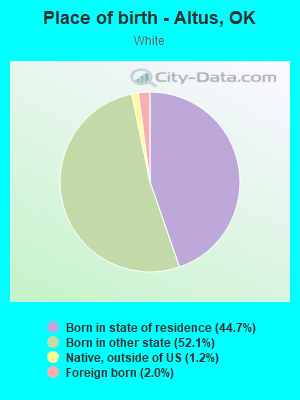
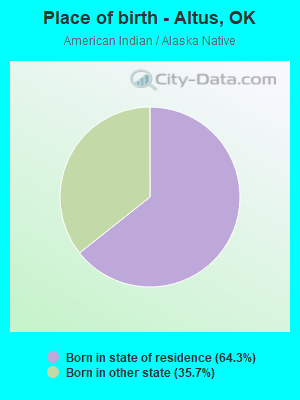
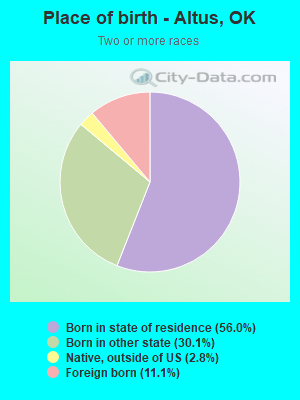
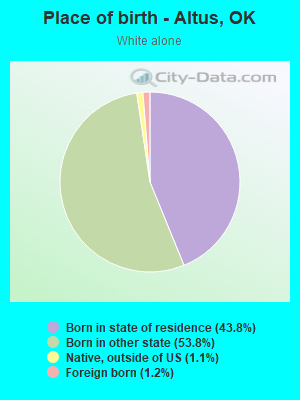
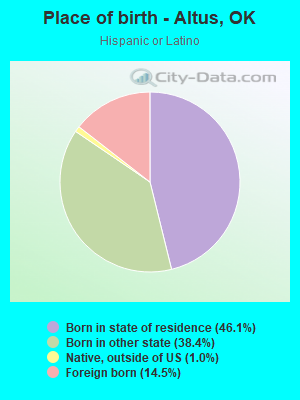
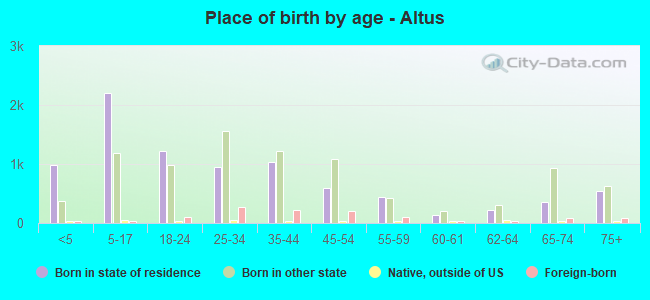
Place of birth - Born in state of residence (%)
Place of birth - Born in state of residence (%) - White
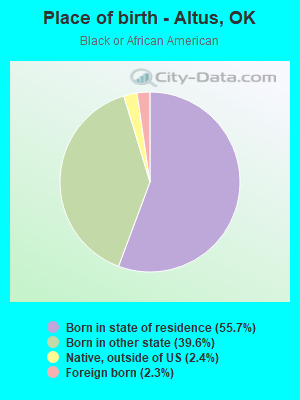
Place of birth - Born in state of residence (%) - Black or African American
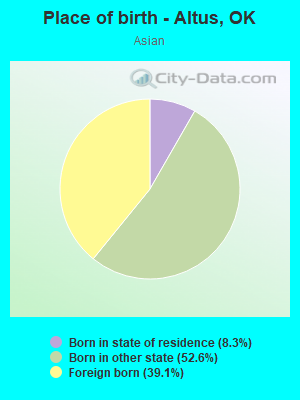
Place of birth - Born in state of residence (%) - Asian
Place of birth - Born in state of residence (%) - Hispanic or Latino
Place of birth - Born in state of residence (%) - American Indian and Alaska Native
Place of birth - Born in state of residence (%) - Multirace
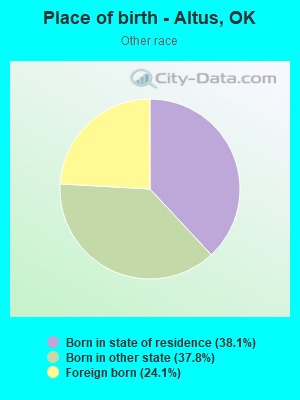
Place of birth - Born in state of residence (%) - Other Race
Place of birth - Born in other state (%)
Place of birth - Born in other state (%) - White
Place of birth - Born in other state (%) - Black or African American
Place of birth - Born in other state (%) - Asian
Place of birth - Born in other state (%) - Hispanic or Latino
Place of birth - Born in other state (%) - American Indian and Alaska Native
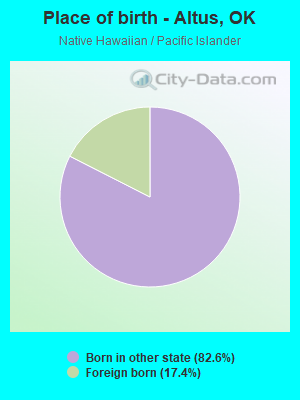
Place of birth - Born in other state (%) - Multirace
Place of birth - Born in other state (%) - Other Race
Place of birth - Native, outside of US (%)
Place of birth - Native, outside of US (%) - White
Place of birth - Native, outside of US (%) - Black or African American
Place of birth - Native, outside of US (%) - Asian
Place of birth - Native, outside of US (%) - Hispanic or Latino
Place of birth - Native, outside of US (%) - American Indian and Alaska Native
Place of birth - Native, outside of US (%) - Multirace
Place of birth - Native, outside of US (%) - Other Race
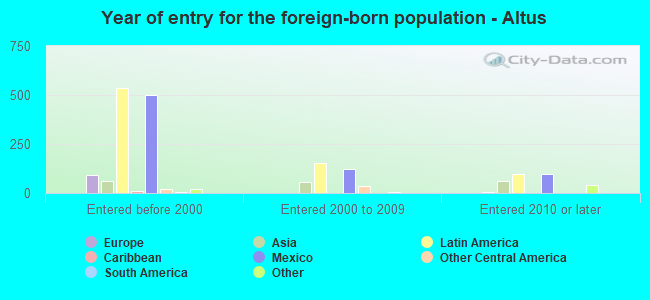
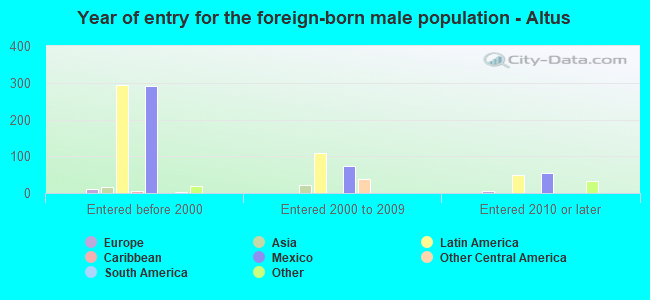
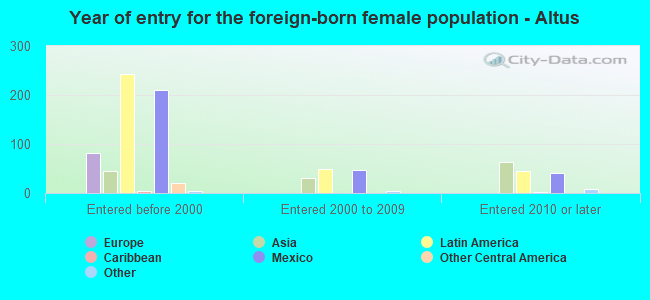
Place of birth - Foreign born (%)
Place of birth - Foreign born (%) - White
Place of birth - Foreign born (%) - Black or African American
Place of birth - Foreign born (%) - Asian
Place of birth - Foreign born (%) - Hispanic or Latino
Place of birth - Foreign born (%) - American Indian and Alaska Native
Place of birth - Foreign born (%) - Multirace
Place of birth - Foreign born (%) - Other Race
Residents speaking English at home (%)
Residents speaking English at home - Born in the United States (%)
Residents speaking English at home - Native, born elsewhere (%)
Residents speaking English at home - Foreign born (%)
Residents speaking Spanish at home (%)
Residents speaking Spanish at home - Born in the United States (%)
Residents speaking Spanish at home - Native, born elsewhere (%)
Residents speaking Spanish at home - Foreign born (%)
Residents speaking other language at home (%)
Residents speaking other language at home - Born in the United States (%)
Residents speaking other language at home - Native, born elsewhere (%)
Residents speaking other language at home - Foreign born (%)
Marital status - Never married (%)
Marital status - Now married (%)
Marital status - Separated (%)
Marital status - Widowed (%)
Marital status - Divorced (%)
Ancestries Reported - Arab (%)
Ancestries Reported - Czech (%)
Ancestries Reported - Danish (%)
Ancestries Reported - Dutch (%)
Ancestries Reported - English (%)
Ancestries Reported - French (%)
Ancestries Reported - French Canadian (%)
Ancestries Reported - German (%)
Ancestries Reported - Greek (%)
Ancestries Reported - Hungarian (%)
Ancestries Reported - Irish (%)
Ancestries Reported - Italian (%)
Ancestries Reported - Lithuanian (%)
Ancestries Reported - Norwegian (%)
Ancestries Reported - Polish (%)
Ancestries Reported - Portuguese (%)
Ancestries Reported - Russian (%)
Ancestries Reported - Scotch-Irish (%)
Ancestries Reported - Scottish (%)
Ancestries Reported - Slovak (%)
Ancestries Reported - Subsaharan African (%)
Ancestries Reported - Swedish (%)
Ancestries Reported - Swiss (%)
Ancestries Reported - Ukrainian (%)
Ancestries Reported - United States (%)
Ancestries Reported - Welsh (%)
Ancestries Reported - West Indian (%)
Ancestries Reported - Other (%)
Geographical mobility - Same house 1 year ago (%)
Geographical mobility - Same house 1 year ago (%) - White
Geographical mobility - Same house 1 year ago (%) - Black or African American
Geographical mobility - Same house 1 year ago (%) - Asian
Geographical mobility - Same house 1 year ago (%) - Hispanic or Latino
Geographical mobility - Same house 1 year ago (%) - American Indian and Alaska Native
Geographical mobility - Same house 1 year ago (%) - Multirace
Geographical mobility - Same house 1 year ago (%) - Other Race
Geographical mobility - Moved within same county (%)
Geographical mobility - Moved within same county (%) - White
Geographical mobility - Moved within same county (%) - Black or African American
Geographical mobility - Moved within same county (%) - Asian
Geographical mobility - Moved within same county (%) - Hispanic or Latino
Geographical mobility - Moved within same county (%) - American Indian and Alaska Native
Geographical mobility - Moved within same county (%) - Multirace
Geographical mobility - Moved within same county (%) - Other Race
Geographical mobility - Moved from different county within same state (%)
Geographical mobility - Moved from different county within same state (%) - White
Geographical mobility - Moved from different county within same state (%) - Black or African American
Geographical mobility - Moved from different county within same state (%) - Asian
Geographical mobility - Moved from different county within same state (%) - Hispanic or Latino
Geographical mobility - Moved from different county within same state (%) - American Indian and Alaska Native
Geographical mobility - Moved from different county within same state (%) - Multirace
Geographical mobility - Moved from different county within same state (%) - Other Race
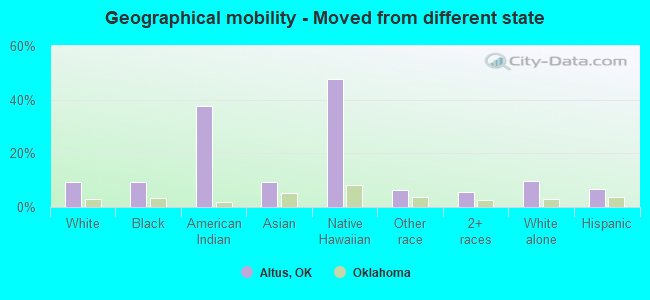
Geographical mobility - Moved from different state (%)
Geographical mobility - Moved from different state (%) - White
Geographical mobility - Moved from different state (%) - Black or African American
Geographical mobility - Moved from different state (%) - Asian
Geographical mobility - Moved from different state (%) - Hispanic or Latino
Geographical mobility - Moved from different state (%) - American Indian and Alaska Native
Geographical mobility - Moved from different state (%) - Multirace
Geographical mobility - Moved from different state (%) - Other Race
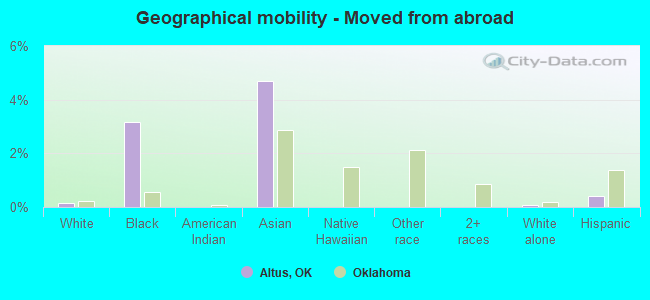
Geographical mobility - Moved from abroad (%)
Geographical mobility - Moved from abroad (%) - White
Geographical mobility - Moved from abroad (%) - Black or African American
Geographical mobility - Moved from abroad (%) - Asian
Geographical mobility - Moved from abroad (%) - Hispanic or Latino
Geographical mobility - Moved from abroad (%) - American Indian and Alaska Native
Geographical mobility - Moved from abroad (%) - Multirace
Geographical mobility - Moved from abroad (%) - Other Race
Place of birth for the foreign-born population - Ireland (%)
Place of birth for the foreign-born population - Denmark (%)
Place of birth for the foreign-born population - Norway (%)
Place of birth for the foreign-born population - Sweden (%)
Place of birth for the foreign-born population - United Kingdom (%)
Place of birth for the foreign-born population - England (%)
Place of birth for the foreign-born population - Scotland (%)
Place of birth for the foreign-born population - Other Northern Europe (%)
Place of birth for the foreign-born population - Austria (%)
Place of birth for the foreign-born population - Belgium (%)
Place of birth for the foreign-born population - France (%)
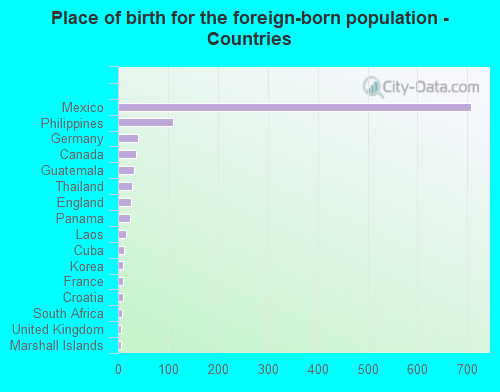
Place of birth for the foreign-born population - Germany (%)
Place of birth for the foreign-born population - Netherlands (%)
Place of birth for the foreign-born population - Switzerland (%)
Place of birth for the foreign-born population - Other Western Europe (%)
Place of birth for the foreign-born population - Greece (%)
Place of birth for the foreign-born population - Italy (%)
Place of birth for the foreign-born population - Portugal (%)
Place of birth for the foreign-born population - Spain (%)
Place of birth for the foreign-born population - Other Southern Europe (%)
Place of birth for the foreign-born population - Albania (%)
Place of birth for the foreign-born population - Belarus (%)
Place of birth for the foreign-born population - Bosnia and Herzegovina (%)
Place of birth for the foreign-born population - Bulgaria (%)
Place of birth for the foreign-born population - Croatia (%)
Place of birth for the foreign-born population - Czechoslovakia (%)
Place of birth for the foreign-born population - Hungary (%)
Place of birth for the foreign-born population - Latvia (%)
Place of birth for the foreign-born population - Lithuania (%)
Place of birth for the foreign-born population - North Macedonia (Macedonia) (%)
Place of birth for the foreign-born population - Moldova (%)
Place of birth for the foreign-born population - Poland (%)
Place of birth for the foreign-born population - Romania (%)
Place of birth for the foreign-born population - Russia (%)
Place of birth for the foreign-born population - Serbia (%)
Place of birth for the foreign-born population - Ukraine (%)
Place of birth for the foreign-born population - Other Eastern Europe (%)
Place of birth for the foreign-born population - China (%)
Place of birth for the foreign-born population - Hong Kong (%)
Place of birth for the foreign-born population - Taiwan (%)
Place of birth for the foreign-born population - Japan (%)
Place of birth for the foreign-born population - Korea (%)
Place of birth for the foreign-born population - Other Eastern Asia (%)
Place of birth for the foreign-born population - Afghanistan (%)
Place of birth for the foreign-born population - Bangladesh (%)
Place of birth for the foreign-born population - India (%)
Place of birth for the foreign-born population - Iran (%)
Place of birth for the foreign-born population - Kazakhstan (%)
Place of birth for the foreign-born population - Nepal (%)
Place of birth for the foreign-born population - Pakistan (%)
Place of birth for the foreign-born population - Sri Lanka (%)
Place of birth for the foreign-born population - Uzbekistan (%)
Place of birth for the foreign-born population - Other South Central Asia (%)
Place of birth for the foreign-born population - Burma (%)
Place of birth for the foreign-born population - Cambodia (%)
Place of birth for the foreign-born population - Indonesia (%)
Place of birth for the foreign-born population - Laos (%)
Place of birth for the foreign-born population - Malaysia (%)
Place of birth for the foreign-born population - Philippines (%)
Place of birth for the foreign-born population - Singapore (%)
Place of birth for the foreign-born population - Thailand (%)
Place of birth for the foreign-born population - Vietnam (%)
Place of birth for the foreign-born population - Other South Eastern Asia (%)
Place of birth for the foreign-born population - Armenia (%)
Place of birth for the foreign-born population - Iraq (%)
Place of birth for the foreign-born population - Israel (%)
Place of birth for the foreign-born population - Jordan (%)
Place of birth for the foreign-born population - Kuwait (%)
Place of birth for the foreign-born population - Lebanon (%)
Place of birth for the foreign-born population - Saudi Arabia (%)
Place of birth for the foreign-born population - Syria (%)
Place of birth for the foreign-born population - Turkey (%)
Place of birth for the foreign-born population - Yemen (%)
Place of birth for the foreign-born population - Other Western Asia (%)
Place of birth for the foreign-born population - Eritrea (%)
Place of birth for the foreign-born population - Ethiopia (%)
Place of birth for the foreign-born population - Kenya (%)
Place of birth for the foreign-born population - Somalia (%)
Place of birth for the foreign-born population - Uganda (%)
Place of birth for the foreign-born population - Zimbabwe (%)
Place of birth for the foreign-born population - Other Eastern Africa (%)
Place of birth for the foreign-born population - Cameroon (%)
Place of birth for the foreign-born population - Congo (%)
Place of birth for the foreign-born population - Democratic Republic of Congo (Zaire) (%)
Place of birth for the foreign-born population - Other Middle Africa (%)
Place of birth for the foreign-born population - Egypt (%)
Place of birth for the foreign-born population - Morocco (%)
Place of birth for the foreign-born population - Sudan (%)
Place of birth for the foreign-born population - Other Northern Africa (%)
Place of birth for the foreign-born population - South Africa (%)
Place of birth for the foreign-born population - Other Southern Africa (%)
Place of birth for the foreign-born population - Cabo Verde (%)
Place of birth for the foreign-born population - Ghana (%)
Place of birth for the foreign-born population - Liberia (%)
Place of birth for the foreign-born population - Nigeria (%)
Place of birth for the foreign-born population - Senegal (%)
Place of birth for the foreign-born population - Sierra Leone (%)
Place of birth for the foreign-born population - Other Western Africa (%)
Place of birth for the foreign-born population - Australia (%)
Place of birth for the foreign-born population - New Zealand (%)
Place of birth for the foreign-born population - Fiji (%)
Place of birth for the foreign-born population - Micronesia (%)
Place of birth for the foreign-born population - Bahamas (%)
Place of birth for the foreign-born population - Barbados (%)
Place of birth for the foreign-born population - Cuba (%)
Place of birth for the foreign-born population - Dominica (%)
Place of birth for the foreign-born population - Dominican Republic (%)
Place of birth for the foreign-born population - Grenada (%)
Place of birth for the foreign-born population - Haiti (%)
Place of birth for the foreign-born population - Jamaica (%)
Place of birth for the foreign-born population - St. Vincent and the Grenadines (%)
Place of birth for the foreign-born population - Trinidad and Tobago (%)
Place of birth for the foreign-born population - West Indies (%)
Place of birth for the foreign-born population - Other Caribbean (%)
Place of birth for the foreign-born population - Belize (%)
Place of birth for the foreign-born population - Costa Rica (%)
Place of birth for the foreign-born population - El Salvador (%)
Place of birth for the foreign-born population - Guatemala (%)
Place of birth for the foreign-born population - Honduras (%)
Place of birth for the foreign-born population - Mexico (%)
Place of birth for the foreign-born population - Nicaragua (%)
Place of birth for the foreign-born population - Panama (%)
Place of birth for the foreign-born population - Other Central America (%)
Place of birth for the foreign-born population - Argentina (%)
Place of birth for the foreign-born population - Bolivia (%)
Place of birth for the foreign-born population - Brazil (%)
Place of birth for the foreign-born population - Chile (%)
Place of birth for the foreign-born population - Colombia (%)
Place of birth for the foreign-born population - Ecuador (%)
Place of birth for the foreign-born population - Guyana (%)
Place of birth for the foreign-born population - Peru (%)
Place of birth for the foreign-born population - Uruguay (%)
Place of birth for the foreign-born population - Venezuela (%)
Place of birth for the foreign-born population - Other South America (%)
Place of birth for the foreign-born population - Canada (%)
Place of birth for the foreign-born population - Other Northern America (%)
Place of birth for the foreign-born population - Other (%)
Latest news about races in Altus, OK collected exclusively by city-data.com from local newspapers, TV, and radio stations
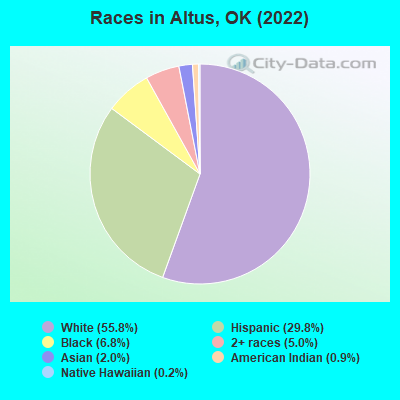
According to 2022 data, the most numerous races in Altus, OK are White alone (10,576 residents), Hispanic (5,644 residents), and Two or more races (955 residents). 81.4% of Altus residents speak English at home. 6.0% of Altus, OK residents are foreign-born (4.2% born in Latin America, 0.9% born in Asia), which is about the same as the foreign-born rate of 6.0% across the entire state of Oklahoma.
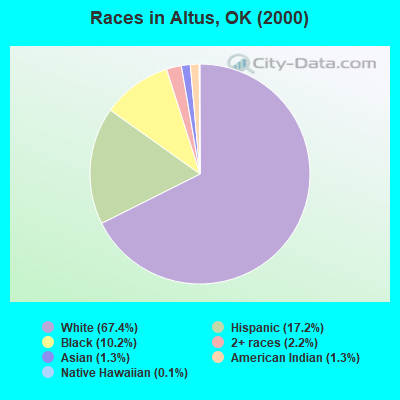
Race distribution in Altus
2000 2022
2,556,368 74.1% White alone 266,158 7.7% American Indian alone 257,981 7.5% Black alone 179,304 5.2% Hispanic 140,249 4.1% Two or more races 46,172 1.3% Asian alone 2,322 0.07% Other race alone 2,100 0.06% Native Hawaiian and Other
2,517,403 62.6% White alone 486,692 12.1% Hispanic 364,453 9.1% Two or more races 273,650 6.8% American Indian alone 268,543 6.7% Black alone 92,672 2.3% Asian alone 10,786 0.3% Other race alone 5,601 0.1% Native Hawaiian and Other
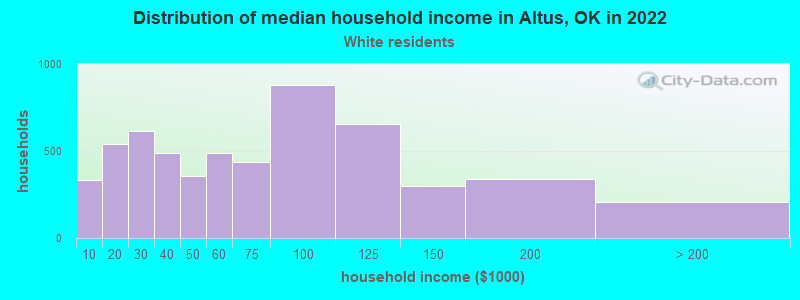
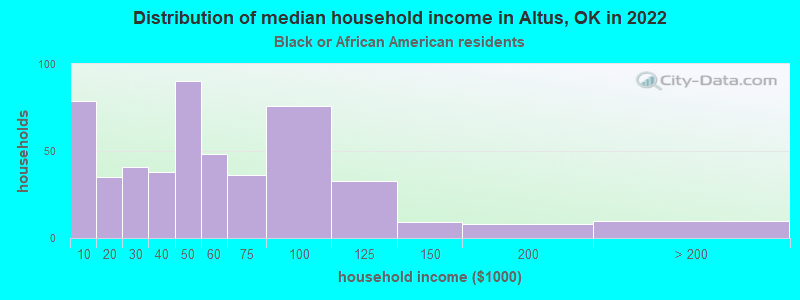
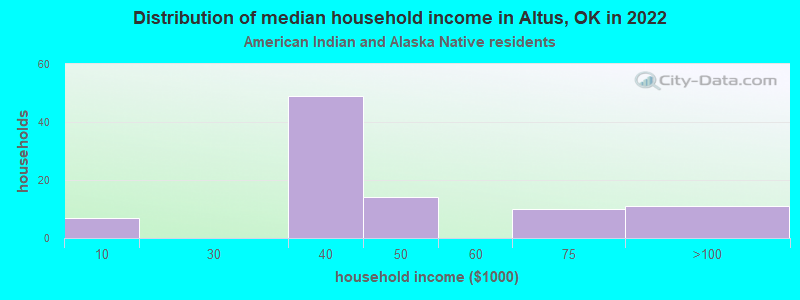
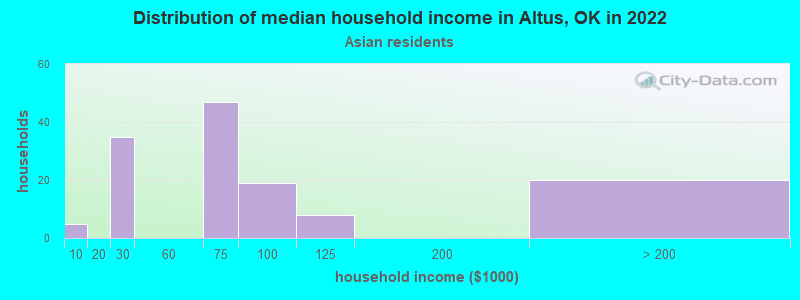
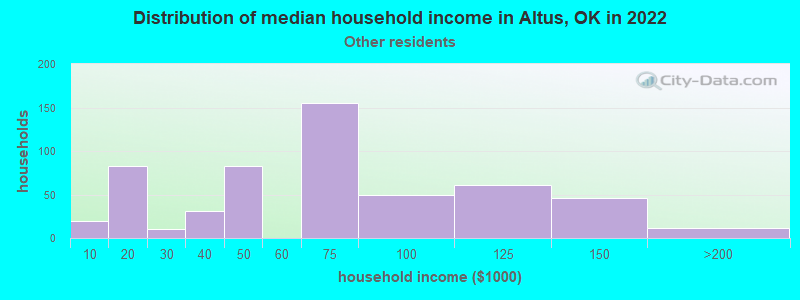
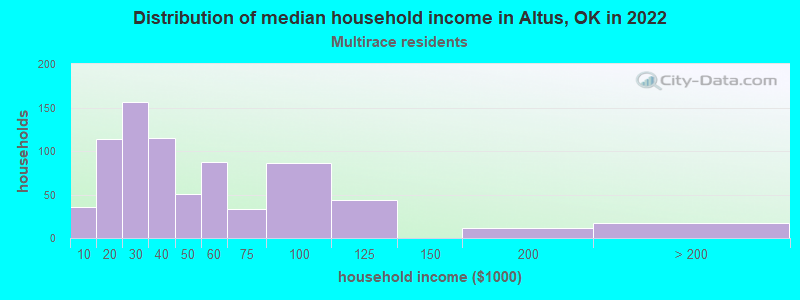
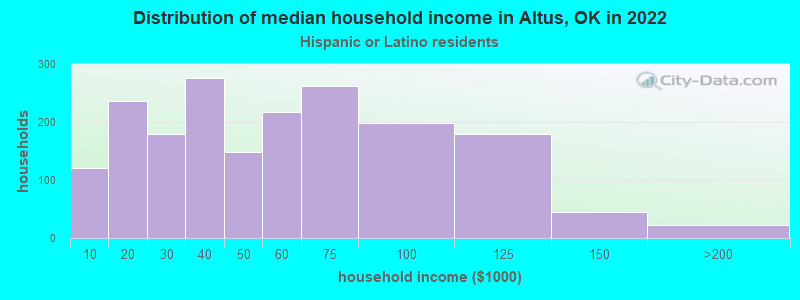
Income and house value in Altus Median household income in 2022 $65,481 White non-Hispanic householders$43,769 Black householders$37,942 American Indian and Alaska Native householders$67,999 Asian householders$68,261 Some other race householders$34,113 Two or more races householders$49,258 Hispanic or Latino race householdersMedian 2022 house value $126,596 White Non-Hispanic householders$73,801 Black or African American householders$79,006 American Indian or Alaska Native householders $142,584 Asian householders$55,955 Some other race householders$68,224 Two or more races householders$63,763 Hispanic or Latino householders
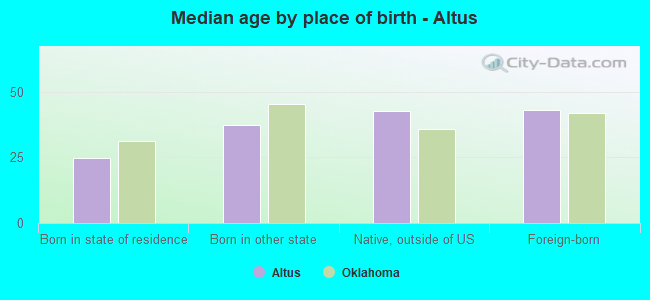
Median age by race in Altus
35.8 Median age for White residents35.1 36.7 33.8 Median age for Black or African American residents33.8 34.4 32.7 Median age for American Indian / Alaska Native residents33.8 24.6 27.2 Median age for Asian residents27.1 30.0 24.5 Median age for Native Hawaiian / Pacific Islander residents-675,324,674.6 -767,251,461.2 34.6 Median age for Other race residents30.3 42.1 23.7 Median age for Two or more races residents18.3 28.6 36.6 Median age for White alone residents35.3 38.8 26.1 Median age for Hispanic or Latino residents25.9 26.6
Owner/renter occupied households by race in Altus
House owners and renters - White residents 3,373 59.7% Owner occupied2,281 40.3% Renter occupiedHouse owners and renters - Black or African American residents 178 36.1% Owner occupied316 63.9% Renter occupiedHouse owners and renters - American Indian / Alaska Native residents 24 26.1% Owner occupied69 73.9% Renter occupiedHouse owners and renters - Asian residents 36 28.7% Owner occupied89 71.3% Renter occupiedHouse owners and renters - Other race residents 378 69.8% Owner occupied164 30.2% Renter occupiedHouse owners and renters - Two or more races residents 300 39.4% Owner occupied462 60.6% Renter occupiedHouse owners and renters - White alone residents 3,004 60.9% Owner occupied1,931 39.1% Renter occupiedHouse owners and renters - Hispanic or Latino residents 965 51.0% Owner occupied925 49.0% Renter occupied
Language usage in Altus
English speakers - Total 81.4% of residents of Altus speak English at home.
16.6% of residents speak Spanish at home 2,068 70.8% Speak English very well853 29.2% Speak English less than very well2.2% of residents speak other language at home 250 64.3% Speak English very well139 35.7% Speak English less than very well
English speakers - Born in the United States 82.7% of residents of Altus speak English at home.
16.4% of residents speak Spanish at home 1,001 71.8% Speak English very well393 28.2% Speak English less than very well1.5% of residents speak other language at home 78 62.4% Speak English very well47 37.6% Speak English less than very well
English speakers - Native, born elsewhere 70.5% of residents of Altus speak English at home.
19.0% of residents speak Spanish at home 51 100.0% Speak English very well8.2% of residents speak other language at home 14 63.6% Speak English very well8 36.4% Speak English less than very well
English speakers - Foreign-born 15.4% of residents of Altus speak English at home.
66.0% of residents speak Spanish at home 249 33.1% Speak English very well503 66.9% Speak English less than very well18.9% of residents speak other language at home 146 67.9% Speak English very well69 32.1% Speak English less than very well
White (Caucasian) - Speak only English Native:
89.8% (10,570)Foreign-born:
33.2% (87)
White (Caucasian) - Speak another language Native:
7.6% (894)Foreign-born:
66.7% (175)
Black or African American - Speak only English Native:
99.7% (1,251)Foreign-born:
7.0% (2)
Black or African American - Speak another language Native:
0.5% (6)Foreign-born:
97.5% (32)
Asian - Speak only English Native:
50.1% (101)Foreign-born:
16.2% (27)
Asian - Speak another language Native:
49.9% (100)Foreign-born:
83.7% (138)
Native Hawaiian / Pacific Islander - Speak another language Native:
48.2% (18)Foreign-born:
100.0% (7)
Other race - Speak only English Native:
51.6% (531)Foreign-born:
9.8% (34)
Other race - Speak another language Native:
47.6% (490)Foreign-born:
90.2% (309)
Two or more races - Speak only English Native:
75.0% (1,489)Foreign-born:
12.5% (38)
Two or more races - Speak another language Native:
28.9% (575)Foreign-born:
84.9% (258)
White alone - Speak only English Native:
97.8% (9,672)Foreign-born:
61.2% (80)
White alone - Speak another language Native:
2.1% (211)Foreign-born:
39.7% (52)
Hispanic or Latino - Speak only English Native:
52.3% (2,245)Foreign-born:
9.8% (81)
Hispanic or Latino - Speak another language Native:
47.7% (2,050)Foreign-born:
90.5% (744)
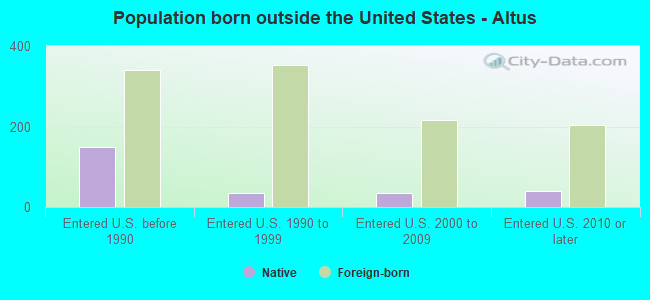
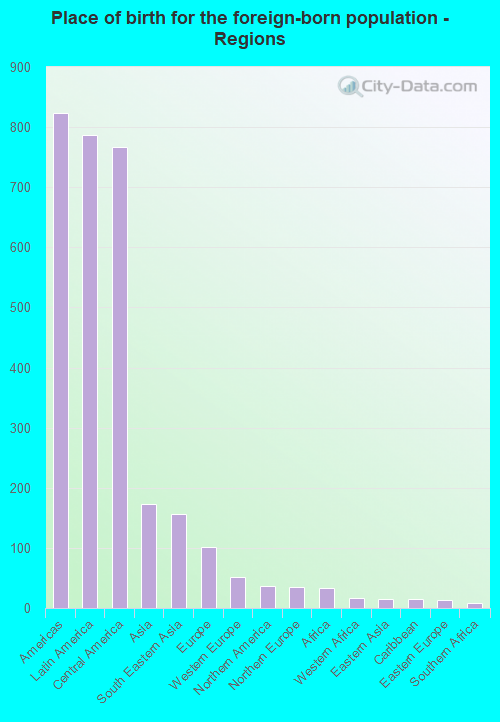
Foreign-born residents in Altus 1,141 residents are foreign born (4.2% Latin America , 0.9% Asia ).
This city:
6.0%Oklahoma:
6.1%
Marital status for residents in Altus Marital status - White (Caucasian) population 15 years and over
Males 29.2% Never married54.9% Now married2.4% Separated4.3% Widowed9.2% DivorcedFemales 22.2% Never married50.4% Now married1.9% Separated11.8% Widowed13.8% DivorcedWomen who gave birth in the past 12 months Now married:
70.2% (186)Unmarried:
29.8% (79)
Women who did not give birth in the past 12 months Now married:
56.3% (1,605)Unmarried:
43.7% (1,248)
Marital status - Black or African American population 15 years and over
Males 45.8% Never married42.6% Now married1.3% Separated5.2% Widowed5.0% DivorcedFemales 38.3% Never married30.5% Now married0.0% Separated9.1% Widowed22.0% DivorcedWomen who gave birth in the past 12 months Now married:
16.5% (18)Unmarried:
83.5% (90)
Women who did not give birth in the past 12 months Now married:
42.0% (74)Unmarried:
58.0% (102)
Marital status - American Indian / Alaska Native population 15 years and over
Males 7.3% Never married82.9% Now married0.0% Separated0.0% Widowed9.8% DivorcedFemales 30.6% Never married63.3% Now married0.0% Separated0.0% Widowed6.1% DivorcedWomen who did not give birth in the past 12 months Now married:
63.3% (63)Unmarried:
36.7% (37)
Marital status - Asian population 15 years and over
Males 6.3% Never married47.4% Now married17.9% Separated0.0% Widowed28.4% DivorcedFemales 12.0% Never married82.7% Now married0.0% Separated0.0% Widowed5.2% DivorcedWomen who did not give birth in the past 12 months Now married:
83.2% (114)Unmarried:
16.8% (23)
Marital status - Native Hawaiian / Pacific Islander population 15 years and over
Males 100.0% Never married0.0% Now married0.0% Separated0.0% Widowed0.0% DivorcedFemales 0.0% Never married100.0% Now married0.0% Separated0.0% Widowed0.0% DivorcedWomen who did not give birth in the past 12 months Now married:
100.0% (17)Unmarried:
0.0% (0)
Marital status - Other race population 15 years and over
Males 44.2% Never married40.1% Now married4.5% Separated4.7% Widowed6.4% DivorcedFemales 30.9% Never married33.6% Now married0.0% Separated2.2% Widowed33.3% DivorcedWomen who did not give birth in the past 12 months Now married:
34.1% (164)Unmarried:
65.9% (317)
Marital status - Two or more races population 15 years and over
Males 38.5% Never married43.6% Now married12.3% Separated0.0% Widowed5.7% DivorcedFemales 49.0% Never married36.1% Now married9.2% Separated3.5% Widowed2.1% DivorcedWomen who gave birth in the past 12 months Now married:
100.0% (20)Unmarried:
0.0% (0)
Women who did not give birth in the past 12 months Now married:
30.7% (175)Unmarried:
69.3% (395)
Marital status - White alone, not Hispanic / Latino population 15 years and over
Males 26.7% Never married56.9% Now married2.3% Separated4.6% Widowed9.4% DivorcedFemales 20.2% Never married51.1% Now married1.7% Separated13.9% Widowed13.2% DivorcedWomen who gave birth in the past 12 months Now married:
82.8% (187)Unmarried:
17.2% (39)
Women who did not give birth in the past 12 months Now married:
58.9% (1,372)Unmarried:
41.1% (957)
Marital status - Hispanic or Latino population 15 years and over
Males 39.5% Never married45.6% Now married6.3% Separated2.6% Widowed6.0% DivorcedFemales 36.2% Never married41.7% Now married1.7% Separated2.2% Widowed18.2% DivorcedWomen who gave birth in the past 12 months Now married:
17.3% (10)Unmarried:
82.7% (47)
Women who did not give birth in the past 12 months Now married:
41.4% (618)Unmarried:
58.6% (875)
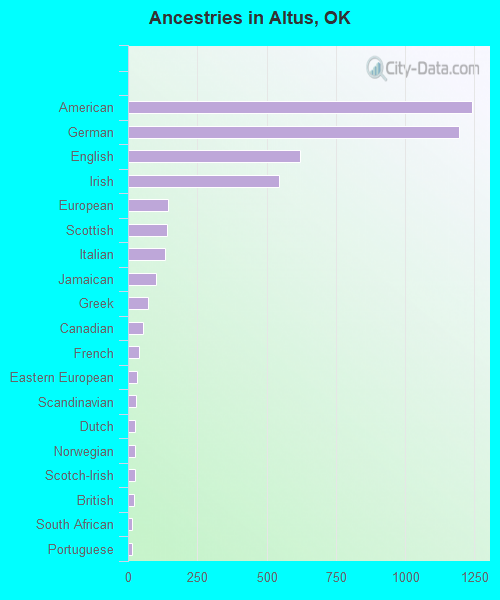
Ancestries in Altus
1,241 12.1% American1,193 11.6% German621 6.1% English546 5.3% Irish144 1.4% European139 1.4% Scottish135 1.3% Italian100 1.0% Jamaican71 0.7% Greek55 0.5% Canadian39 0.4% French31 0.3% Eastern European30 0.3% Scandinavian25 0.2% Dutch25 0.2% Norwegian25 0.2% Scotch-Irish21 0.2% British14 0.1% South African13 0.1% Portuguese11 0.1% Polish9 0.09% Iranian8 0.08% Croatian7 0.07% Lebanese6 0.06% African
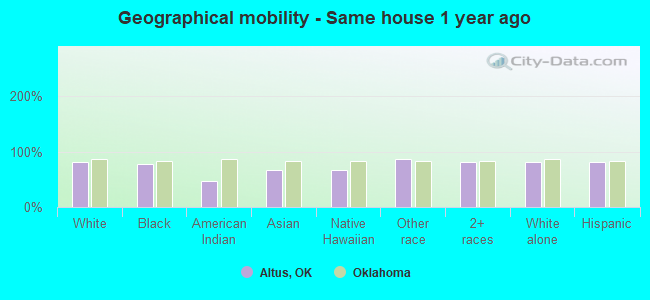
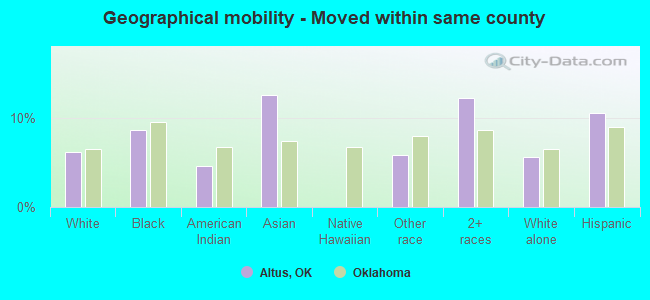
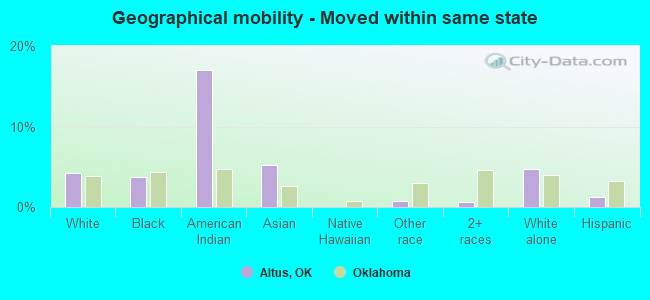
Geographical mobility in Altus Same house 1 year ago 10,131 80.4% White (Caucasian)1,051 76.7% Black or African American108 46.8% American Indian / Alaska Native259 67.4% Asian26 66.9% Native Hawaiian / Pacific Islander1,236 87.0% Other race2,165 80.6% Two or more races8,369 80.5% White alone, not Hispanic / Latino4,519 80.9% Hispanic or LatinoMoved within same county 768 6.1% White / Caucasian118 8.6% Black or African American11 4.6% American Indian / Alaska Native48 12.5% Asian83 5.9% Other race329 12.2% Two or more races579 5.6% White alone, not Hispanic / Latino587 10.5% Hispanic or LatinoMoved within same state 528 4.2% White / Caucasian52 3.8% Black or African American39 17.0% American Indian / Alaska Native20 5.3% Asian10 0.7% Other race18 0.7% Two or more races491 4.7% White alone, not Hispanic / Latino72 1.3% Hispanic or LatinoMoved from different state 1,194 9.5% White / Caucasian126 9.2% Black or African American87 37.8% American Indian / Alaska Native36 9.4% Asian19 47.8% Native Hawaiian / Pacific Islander91 6.4% Other race155 5.8% Two or more races1,002 9.6% White alone, not Hispanic / Latino365 6.5% Hispanic or LatinoMoved from abroad 20 0.2% White43 3.2% Black or African American18 4.7% Asian9 0.1% White alone, not Hispanic / Latino23 0.4% Hispanic or Latino
Children Nativity (place of birth) in Altus
Children under 6 years - Living with two parents Both parents native 922 100.0% NativeBoth parents foreign-born 42 100.0% NativeOne native, one foreign-born parent 88 100.0% NativeChildren under 6 years - Living with one parent Native parent 471 100.0% NativeChildren 6 to 17 years - Living with two parents Both parents native 1,559 100.0% Native0 0.0% Foreign-bornBoth parents foreign-born 26 75.1% Native9 24.9% Foreign-bornOne native, one foreign-born parent 188 100.0% NativeChildren 6 to 17 years - Living with one parent Native parent 1,006 100.0% NativeForeign-born parent 35 49.9% Native35 50.1% Foreign-born
Grandparents responsible for own grandchildren in Altus
Grandparents (30 to 59 years) White / Caucasian 32 24.5% Responsible for grandchildren98 75.5% Not responsible for grandchildrenAmerican Indian / Alaska Native 33 100.0% Not responsible for grandchildrenOther race 26 67.9% Responsible for grandchildren12 32.1% Not responsible for grandchildrenTwo or more races 25 100.0% Responsible for grandchildrenWhite alone, not Hispanic / Latino 33 23.5% Responsible for grandchildren109 76.5% Not responsible for grandchildrenHispanic or Latino 43 85.8% Responsible for grandchildren7 14.2% Not responsible for grandchildrenGrandparents (60 years and over) White / Caucasian 41 29.2% Responsible for grandchildren99 70.8% Not responsible for grandchildrenOther race 17 100.0% Responsible for grandchildrenWhite alone, not Hispanic / Latino 24 19.0% Responsible for grandchildren103 81.0% Not responsible for grandchildrenHispanic or Latino 48 100.0% Responsible for grandchildren