Races in Alvin, Texas (TX) Detailed Stats
Data:
Races - White alone (%)
Races - White alone (% change since 2000)
Races - Black alone (%)
Races - Black alone (% change since 2000)
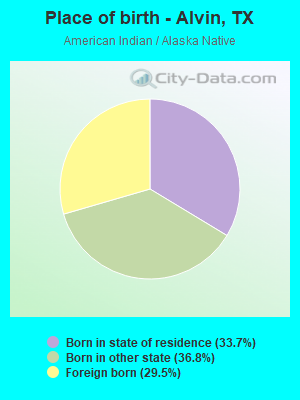
Races - American Indian alone (%)
Races - American Indian alone (% change since 2000)
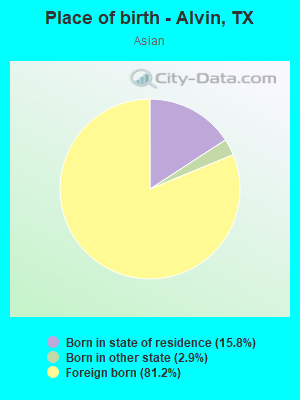
Races - Asian alone (%)
Races - Asian alone (% change since 2000)
Races - Hispanic (%)
Races - Hispanic (% change since 2000)
Races - Native Hawaiian and Other Pacific Islander alone (%)
Races - Native Hawaiian and Other Pacific Islander alone (% change since 2000)
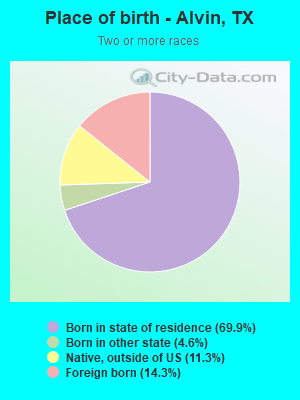
Races - Two or more races(%)
Races - Two or more races(% change since 2000)
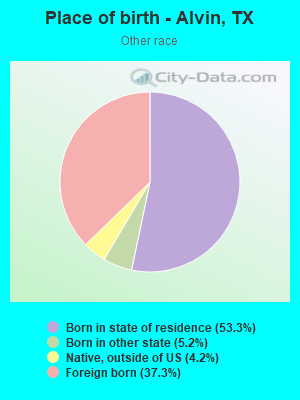
Races - Other race alone (%)
Races - Other race alone (% change since 2000)
Racial diversity
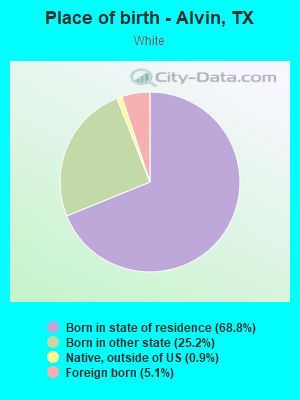
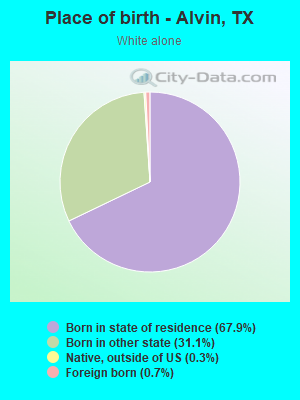
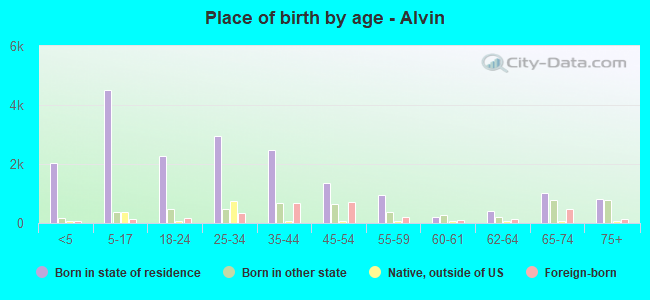
Place of birth - Born in state of residence (%)
Place of birth - Born in state of residence (%) - White
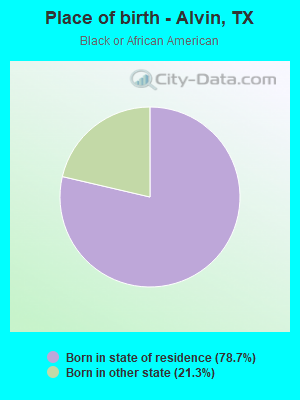
Place of birth - Born in state of residence (%) - Black or African American
Place of birth - Born in state of residence (%) - Asian
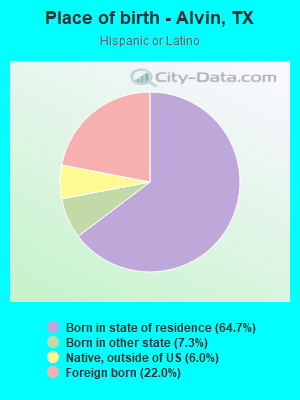
Place of birth - Born in state of residence (%) - Hispanic or Latino
Place of birth - Born in state of residence (%) - American Indian and Alaska Native
Place of birth - Born in state of residence (%) - Multirace
Place of birth - Born in state of residence (%) - Other Race
Place of birth - Born in other state (%)
Place of birth - Born in other state (%) - White
Place of birth - Born in other state (%) - Black or African American
Place of birth - Born in other state (%) - Asian
Place of birth - Born in other state (%) - Hispanic or Latino
Place of birth - Born in other state (%) - American Indian and Alaska Native
Place of birth - Born in other state (%) - Multirace
Place of birth - Born in other state (%) - Other Race
Place of birth - Native, outside of US (%)
Place of birth - Native, outside of US (%) - White
Place of birth - Native, outside of US (%) - Black or African American
Place of birth - Native, outside of US (%) - Asian
Place of birth - Native, outside of US (%) - Hispanic or Latino
Place of birth - Native, outside of US (%) - American Indian and Alaska Native
Place of birth - Native, outside of US (%) - Multirace
Place of birth - Native, outside of US (%) - Other Race
Place of birth - Foreign born (%)
Place of birth - Foreign born (%) - White
Place of birth - Foreign born (%) - Black or African American
Place of birth - Foreign born (%) - Asian
Place of birth - Foreign born (%) - Hispanic or Latino
Place of birth - Foreign born (%) - American Indian and Alaska Native
Place of birth - Foreign born (%) - Multirace
Place of birth - Foreign born (%) - Other Race
Residents speaking English at home (%)
Residents speaking English at home - Born in the United States (%)
Residents speaking English at home - Native, born elsewhere (%)
Residents speaking English at home - Foreign born (%)
Residents speaking Spanish at home (%)
Residents speaking Spanish at home - Born in the United States (%)
Residents speaking Spanish at home - Native, born elsewhere (%)
Residents speaking Spanish at home - Foreign born (%)
Residents speaking other language at home (%)
Residents speaking other language at home - Born in the United States (%)
Residents speaking other language at home - Native, born elsewhere (%)
Residents speaking other language at home - Foreign born (%)
Marital status - Never married (%)
Marital status - Now married (%)
Marital status - Separated (%)
Marital status - Widowed (%)
Marital status - Divorced (%)
Ancestries Reported - Arab (%)
Ancestries Reported - Czech (%)
Ancestries Reported - Danish (%)
Ancestries Reported - Dutch (%)
Ancestries Reported - English (%)
Ancestries Reported - French (%)
Ancestries Reported - French Canadian (%)
Ancestries Reported - German (%)
Ancestries Reported - Greek (%)
Ancestries Reported - Hungarian (%)
Ancestries Reported - Irish (%)
Ancestries Reported - Italian (%)
Ancestries Reported - Lithuanian (%)
Ancestries Reported - Norwegian (%)
Ancestries Reported - Polish (%)
Ancestries Reported - Portuguese (%)
Ancestries Reported - Russian (%)
Ancestries Reported - Scotch-Irish (%)
Ancestries Reported - Scottish (%)
Ancestries Reported - Slovak (%)
Ancestries Reported - Subsaharan African (%)
Ancestries Reported - Swedish (%)
Ancestries Reported - Swiss (%)
Ancestries Reported - Ukrainian (%)
Ancestries Reported - United States (%)
Ancestries Reported - Welsh (%)
Ancestries Reported - West Indian (%)
Ancestries Reported - Other (%)
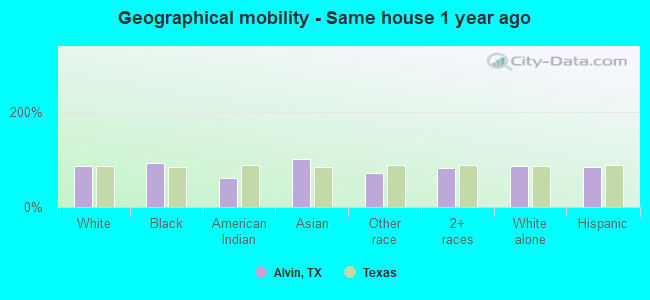
Geographical mobility - Same house 1 year ago (%)
Geographical mobility - Same house 1 year ago (%) - White
Geographical mobility - Same house 1 year ago (%) - Black or African American
Geographical mobility - Same house 1 year ago (%) - Asian
Geographical mobility - Same house 1 year ago (%) - Hispanic or Latino
Geographical mobility - Same house 1 year ago (%) - American Indian and Alaska Native
Geographical mobility - Same house 1 year ago (%) - Multirace
Geographical mobility - Same house 1 year ago (%) - Other Race
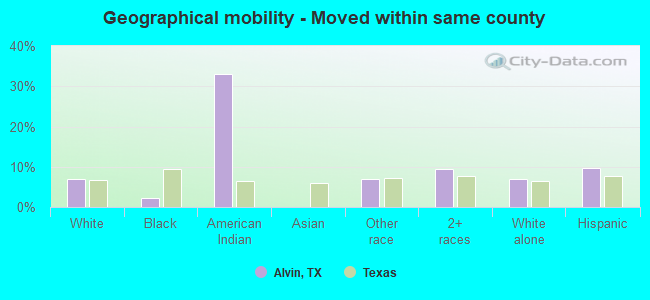
Geographical mobility - Moved within same county (%)
Geographical mobility - Moved within same county (%) - White
Geographical mobility - Moved within same county (%) - Black or African American
Geographical mobility - Moved within same county (%) - Asian
Geographical mobility - Moved within same county (%) - Hispanic or Latino
Geographical mobility - Moved within same county (%) - American Indian and Alaska Native
Geographical mobility - Moved within same county (%) - Multirace
Geographical mobility - Moved within same county (%) - Other Race
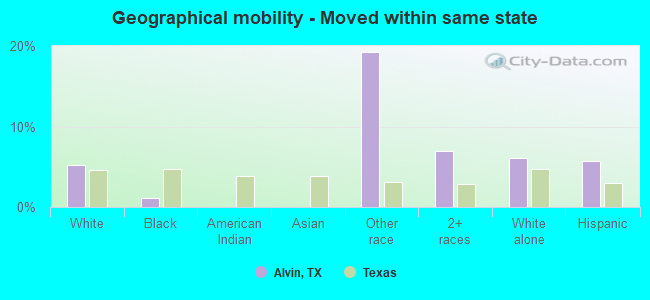
Geographical mobility - Moved from different county within same state (%)
Geographical mobility - Moved from different county within same state (%) - White
Geographical mobility - Moved from different county within same state (%) - Black or African American
Geographical mobility - Moved from different county within same state (%) - Asian
Geographical mobility - Moved from different county within same state (%) - Hispanic or Latino
Geographical mobility - Moved from different county within same state (%) - American Indian and Alaska Native
Geographical mobility - Moved from different county within same state (%) - Multirace
Geographical mobility - Moved from different county within same state (%) - Other Race
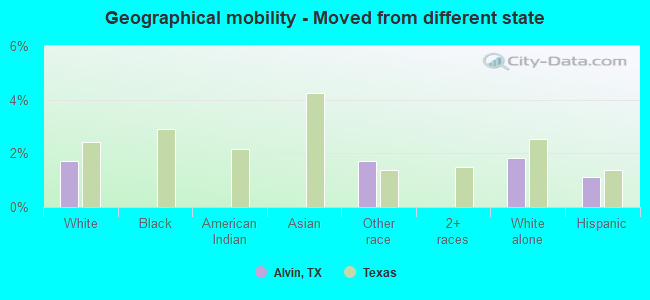
Geographical mobility - Moved from different state (%)
Geographical mobility - Moved from different state (%) - White
Geographical mobility - Moved from different state (%) - Black or African American
Geographical mobility - Moved from different state (%) - Asian
Geographical mobility - Moved from different state (%) - Hispanic or Latino
Geographical mobility - Moved from different state (%) - American Indian and Alaska Native
Geographical mobility - Moved from different state (%) - Multirace
Geographical mobility - Moved from different state (%) - Other Race
Geographical mobility - Moved from abroad (%)
Geographical mobility - Moved from abroad (%) - White
Geographical mobility - Moved from abroad (%) - Black or African American
Geographical mobility - Moved from abroad (%) - Asian
Geographical mobility - Moved from abroad (%) - Hispanic or Latino
Geographical mobility - Moved from abroad (%) - American Indian and Alaska Native
Geographical mobility - Moved from abroad (%) - Multirace
Geographical mobility - Moved from abroad (%) - Other Race
Place of birth for the foreign-born population - Ireland (%)
Place of birth for the foreign-born population - Denmark (%)
Place of birth for the foreign-born population - Norway (%)
Place of birth for the foreign-born population - Sweden (%)
Place of birth for the foreign-born population - United Kingdom (%)
Place of birth for the foreign-born population - England (%)
Place of birth for the foreign-born population - Scotland (%)
Place of birth for the foreign-born population - Other Northern Europe (%)
Place of birth for the foreign-born population - Austria (%)
Place of birth for the foreign-born population - Belgium (%)
Place of birth for the foreign-born population - France (%)
Place of birth for the foreign-born population - Germany (%)
Place of birth for the foreign-born population - Netherlands (%)
Place of birth for the foreign-born population - Switzerland (%)
Place of birth for the foreign-born population - Other Western Europe (%)
Place of birth for the foreign-born population - Greece (%)
Place of birth for the foreign-born population - Italy (%)
Place of birth for the foreign-born population - Portugal (%)
Place of birth for the foreign-born population - Spain (%)
Place of birth for the foreign-born population - Other Southern Europe (%)
Place of birth for the foreign-born population - Albania (%)
Place of birth for the foreign-born population - Belarus (%)
Place of birth for the foreign-born population - Bosnia and Herzegovina (%)
Place of birth for the foreign-born population - Bulgaria (%)
Place of birth for the foreign-born population - Croatia (%)
Place of birth for the foreign-born population - Czechoslovakia (%)
Place of birth for the foreign-born population - Hungary (%)
Place of birth for the foreign-born population - Latvia (%)
Place of birth for the foreign-born population - Lithuania (%)
Place of birth for the foreign-born population - North Macedonia (Macedonia) (%)
Place of birth for the foreign-born population - Moldova (%)
Place of birth for the foreign-born population - Poland (%)
Place of birth for the foreign-born population - Romania (%)
Place of birth for the foreign-born population - Russia (%)
Place of birth for the foreign-born population - Serbia (%)
Place of birth for the foreign-born population - Ukraine (%)
Place of birth for the foreign-born population - Other Eastern Europe (%)
Place of birth for the foreign-born population - China (%)
Place of birth for the foreign-born population - Hong Kong (%)
Place of birth for the foreign-born population - Taiwan (%)
Place of birth for the foreign-born population - Japan (%)
Place of birth for the foreign-born population - Korea (%)
Place of birth for the foreign-born population - Other Eastern Asia (%)
Place of birth for the foreign-born population - Afghanistan (%)
Place of birth for the foreign-born population - Bangladesh (%)
Place of birth for the foreign-born population - India (%)
Place of birth for the foreign-born population - Iran (%)
Place of birth for the foreign-born population - Kazakhstan (%)
Place of birth for the foreign-born population - Nepal (%)
Place of birth for the foreign-born population - Pakistan (%)
Place of birth for the foreign-born population - Sri Lanka (%)
Place of birth for the foreign-born population - Uzbekistan (%)
Place of birth for the foreign-born population - Other South Central Asia (%)
Place of birth for the foreign-born population - Burma (%)
Place of birth for the foreign-born population - Cambodia (%)
Place of birth for the foreign-born population - Indonesia (%)
Place of birth for the foreign-born population - Laos (%)
Place of birth for the foreign-born population - Malaysia (%)
Place of birth for the foreign-born population - Philippines (%)
Place of birth for the foreign-born population - Singapore (%)
Place of birth for the foreign-born population - Thailand (%)
Place of birth for the foreign-born population - Vietnam (%)
Place of birth for the foreign-born population - Other South Eastern Asia (%)
Place of birth for the foreign-born population - Armenia (%)
Place of birth for the foreign-born population - Iraq (%)
Place of birth for the foreign-born population - Israel (%)
Place of birth for the foreign-born population - Jordan (%)
Place of birth for the foreign-born population - Kuwait (%)
Place of birth for the foreign-born population - Lebanon (%)
Place of birth for the foreign-born population - Saudi Arabia (%)
Place of birth for the foreign-born population - Syria (%)
Place of birth for the foreign-born population - Turkey (%)
Place of birth for the foreign-born population - Yemen (%)
Place of birth for the foreign-born population - Other Western Asia (%)
Place of birth for the foreign-born population - Eritrea (%)
Place of birth for the foreign-born population - Ethiopia (%)
Place of birth for the foreign-born population - Kenya (%)
Place of birth for the foreign-born population - Somalia (%)
Place of birth for the foreign-born population - Uganda (%)
Place of birth for the foreign-born population - Zimbabwe (%)
Place of birth for the foreign-born population - Other Eastern Africa (%)
Place of birth for the foreign-born population - Cameroon (%)
Place of birth for the foreign-born population - Congo (%)
Place of birth for the foreign-born population - Democratic Republic of Congo (Zaire) (%)
Place of birth for the foreign-born population - Other Middle Africa (%)
Place of birth for the foreign-born population - Egypt (%)
Place of birth for the foreign-born population - Morocco (%)
Place of birth for the foreign-born population - Sudan (%)
Place of birth for the foreign-born population - Other Northern Africa (%)
Place of birth for the foreign-born population - South Africa (%)
Place of birth for the foreign-born population - Other Southern Africa (%)
Place of birth for the foreign-born population - Cabo Verde (%)
Place of birth for the foreign-born population - Ghana (%)
Place of birth for the foreign-born population - Liberia (%)
Place of birth for the foreign-born population - Nigeria (%)
Place of birth for the foreign-born population - Senegal (%)
Place of birth for the foreign-born population - Sierra Leone (%)
Place of birth for the foreign-born population - Other Western Africa (%)
Place of birth for the foreign-born population - Australia (%)
Place of birth for the foreign-born population - New Zealand (%)
Place of birth for the foreign-born population - Fiji (%)
Place of birth for the foreign-born population - Micronesia (%)
Place of birth for the foreign-born population - Bahamas (%)
Place of birth for the foreign-born population - Barbados (%)
Place of birth for the foreign-born population - Cuba (%)
Place of birth for the foreign-born population - Dominica (%)
Place of birth for the foreign-born population - Dominican Republic (%)
Place of birth for the foreign-born population - Grenada (%)
Place of birth for the foreign-born population - Haiti (%)
Place of birth for the foreign-born population - Jamaica (%)
Place of birth for the foreign-born population - St. Vincent and the Grenadines (%)
Place of birth for the foreign-born population - Trinidad and Tobago (%)
Place of birth for the foreign-born population - West Indies (%)
Place of birth for the foreign-born population - Other Caribbean (%)
Place of birth for the foreign-born population - Belize (%)
Place of birth for the foreign-born population - Costa Rica (%)
Place of birth for the foreign-born population - El Salvador (%)
Place of birth for the foreign-born population - Guatemala (%)
Place of birth for the foreign-born population - Honduras (%)
Place of birth for the foreign-born population - Mexico (%)
Place of birth for the foreign-born population - Nicaragua (%)
Place of birth for the foreign-born population - Panama (%)
Place of birth for the foreign-born population - Other Central America (%)
Place of birth for the foreign-born population - Argentina (%)
Place of birth for the foreign-born population - Bolivia (%)
Place of birth for the foreign-born population - Brazil (%)
Place of birth for the foreign-born population - Chile (%)
Place of birth for the foreign-born population - Colombia (%)
Place of birth for the foreign-born population - Ecuador (%)
Place of birth for the foreign-born population - Guyana (%)
Place of birth for the foreign-born population - Peru (%)
Place of birth for the foreign-born population - Uruguay (%)
Place of birth for the foreign-born population - Venezuela (%)
Place of birth for the foreign-born population - Other South America (%)
Place of birth for the foreign-born population - Canada (%)
Place of birth for the foreign-born population - Other Northern America (%)
Place of birth for the foreign-born population - Other (%)
Latest news about races in Alvin, TX collected exclusively by city-data.com from local newspapers, TV, and radio stations
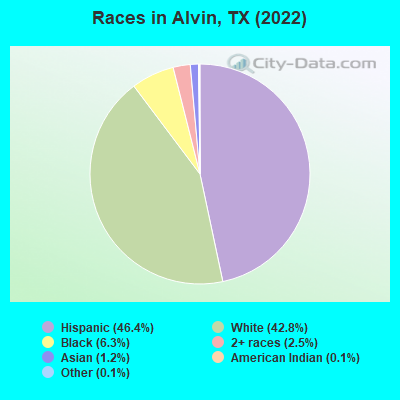
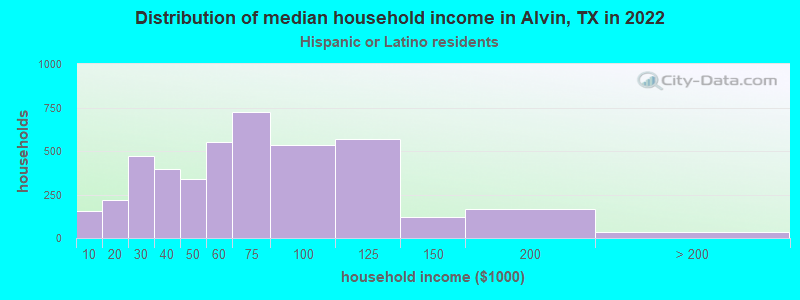
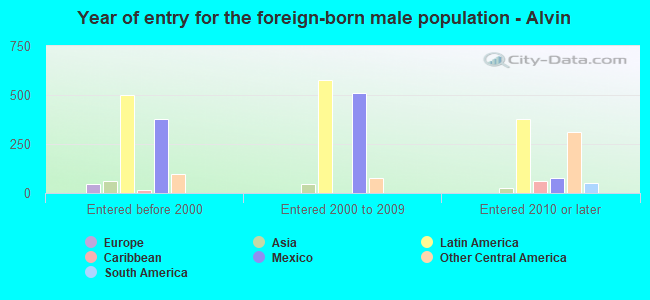
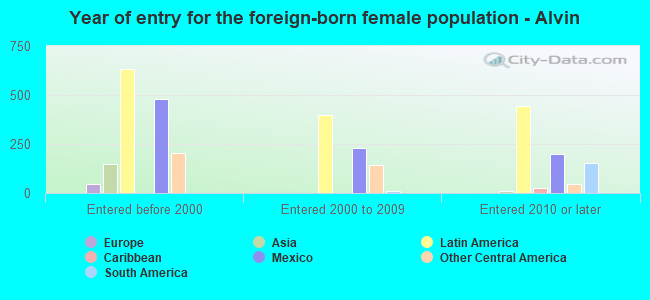
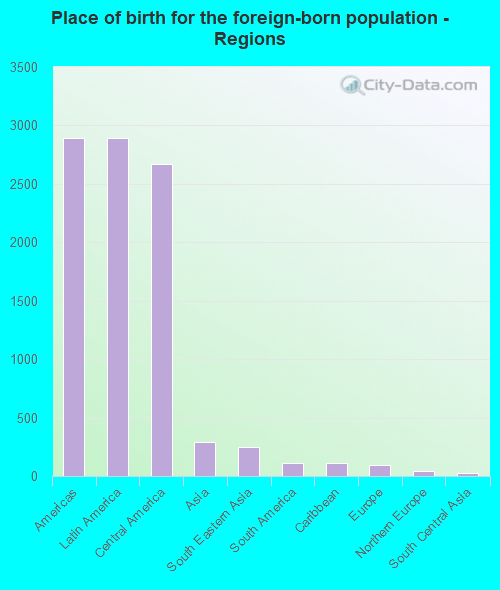
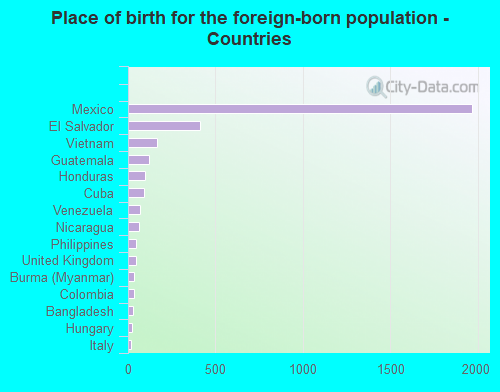
According to 2022 data, the most numerous races in Alvin, TX are Hispanic (13,130 residents), White alone (12,120 residents), and Black alone (1,784 residents). 71.3% of Alvin residents speak English at home. 11.6% of Alvin, TX residents are foreign-born (10.2% born in Latin America), which is 46.9% less than the foreign-born rate of 17.0% across the entire state of Texas.
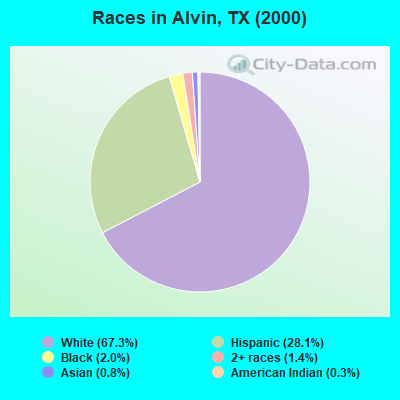
Race distribution in Alvin
2000 2022
10,933,313 52.4% White alone 6,669,666 32.0% Hispanic 2,364,255 11.3% Black alone 554,445 2.7% Asian alone 230,567 1.1% Two or more races 68,859 0.3% American Indian alone 19,958 0.10% Other race alone 10,757 0.05% Native Hawaiian and Other
12,070,642 40.2% Hispanic 11,683,430 38.9% White alone 3,508,706 11.7% Black alone 1,608,173 5.4% Asian alone 956,560 3.2% Two or more races 125,763 0.4% Other race alone 47,023 0.2% American Indian alone 29,275 0.10% Native Hawaiian and Other
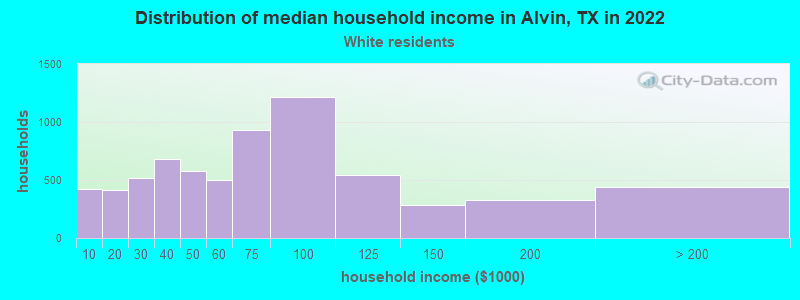
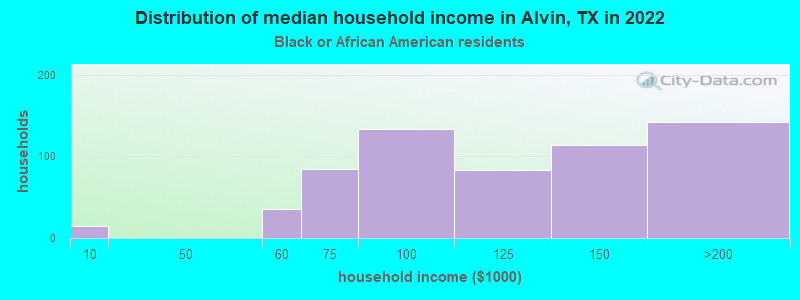
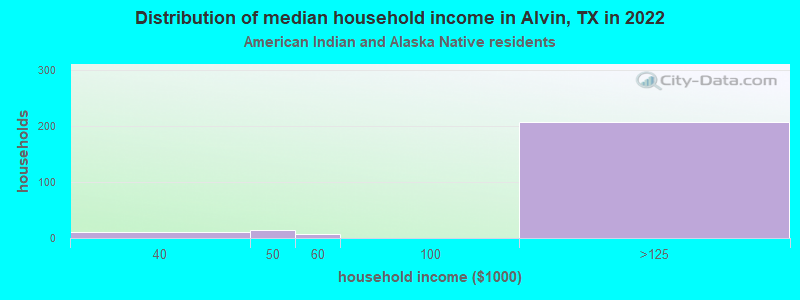
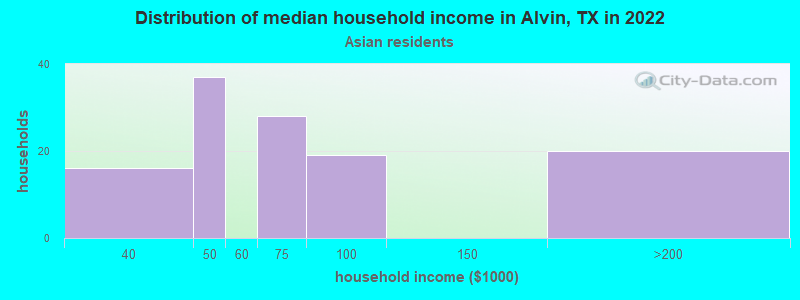
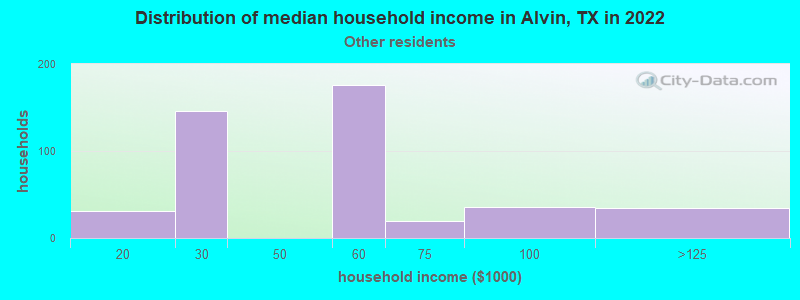
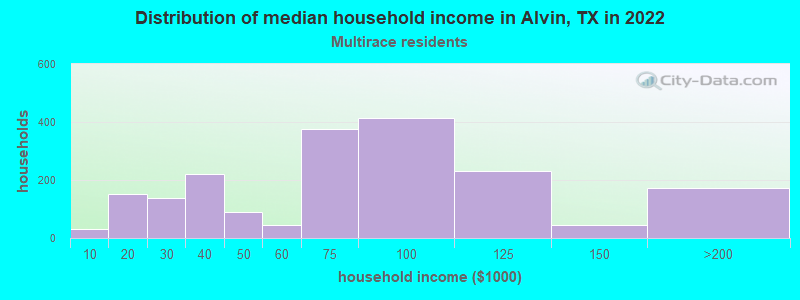
Income and house value in Alvin Median household income in 2022 $62,571 White non-Hispanic householders$96,235 Black householders$97,855 American Indian and Alaska Native householders$71,447 Asian householders$47,182 Some other race householders$59,528 Two or more races householders$60,647 Hispanic or Latino race householdersMedian 2022 house value $252,203 White Non-Hispanic householders$202,635 Black or African American householders$218,222 American Indian or Alaska Native householders $307,382 Asian householders$145,897 Some other race householders$247,526 Two or more races householders$203,570 Hispanic or Latino householders
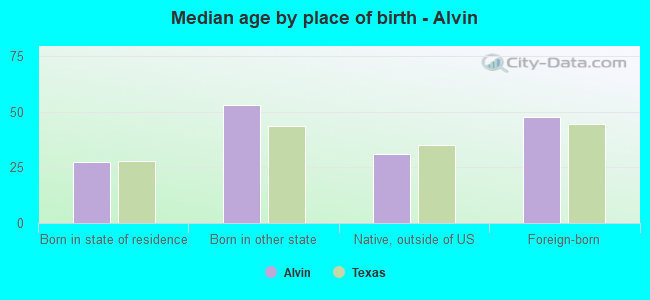
Median age by race in Alvin
37.6 Median age for White residents34.8 40.6 37.3 Median age for Black or African American residents35.9 37.9 36.4 Median age for American Indian / Alaska Native residents44.2 36.1 52.7 Median age for Asian residents45.5 72.1 -1,307,359,306.1 Median age for Native Hawaiian / Pacific Islander residents-688,430,698.1 -577,777,777.2 44.5 Median age for Other race residents41.1 47.8 24.3 Median age for Two or more races residents20.7 26.0 40.0 Median age for White alone residents35.6 44.7 27.3 Median age for Hispanic or Latino residents26.4 28.6
Owner/renter occupied households by race in Alvin
House owners and renters - White residents 4,167 63.4% Owner occupied2,408 36.6% Renter occupiedHouse owners and renters - Black or African American residents 397 69.9% Owner occupied171 30.1% Renter occupiedHouse owners and renters - American Indian / Alaska Native residents 97 75.7% Owner occupied31 24.3% Renter occupiedHouse owners and renters - Asian residents 136 83.2% Owner occupied27 16.8% Renter occupiedHouse owners and renters - Other race residents 272 61.9% Owner occupied167 38.1% Renter occupiedHouse owners and renters - Two or more races residents 976 36.8% Owner occupied1,677 63.2% Renter occupiedHouse owners and renters - White alone residents 3,351 63.8% Owner occupied1,898 36.2% Renter occupiedHouse owners and renters - Hispanic or Latino residents 2,257 52.8% Owner occupied2,016 47.2% Renter occupied
Language usage in Alvin
English speakers - Total 71.3% of residents of Alvin speak English at home.
27.7% of residents speak Spanish at home 4,207 58.2% Speak English very well3,017 41.8% Speak English less than very well1.4% of residents speak other language at home 223 62.1% Speak English very well136 37.9% Speak English less than very well
English speakers - Born in the United States 94.4% of residents of Alvin speak English at home.
5.1% of residents speak Spanish at home 237 90.5% Speak English very well25 9.5% Speak English less than very well
English speakers - Native, born elsewhere 56.2% of residents of Alvin speak English at home.
51.1% of residents speak Spanish at home 397 93.9% Speak English very well26 6.1% Speak English less than very well
English speakers - Foreign-born 5.1% of residents of Alvin speak English at home.
90.0% of residents speak Spanish at home 734 25.9% Speak English very well2,100 74.1% Speak English less than very well8.8% of residents speak other language at home 155 55.8% Speak English very well123 44.2% Speak English less than very well
White (Caucasian) - Speak only English Native:
90.7% (12,688)Foreign-born:
11.8% (92)
White (Caucasian) - Speak another language Native:
8.5% (1,187)Foreign-born:
82.3% (640)
American Indian / Alaska Native - Speak another language Native:
40.0% (242)Foreign-born:
98.9% (238)
Asian - Speak only English Native:
13.3% (9)Foreign-born:
4.6% (13)
Asian - Speak another language Native:
93.4% (66)Foreign-born:
94.2% (266)
Other race - Speak only English Native:
57.9% (471)Foreign-born:
7.5% (39)
Other race - Speak another language Native:
45.7% (372)Foreign-born:
92.3% (482)
Two or more races - Speak another language Native:
49.6% (2,781)Foreign-born:
100.0% (1,116)
White alone - Speak only English Native:
98.9% (11,170)Foreign-born:
65.6% (57)
White alone - Speak another language Native:
1.3% (149)Foreign-born:
25.5% (22)
Hispanic or Latino - Speak only English Native:
52.9% (4,717)Foreign-born:
3.1% (89)
Hispanic or Latino - Speak another language Native:
47.2% (4,207)Foreign-born:
97.1% (2,792)
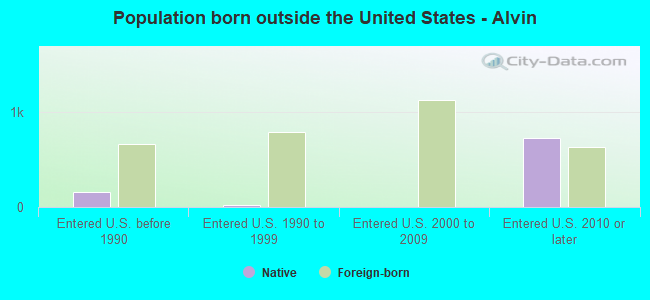
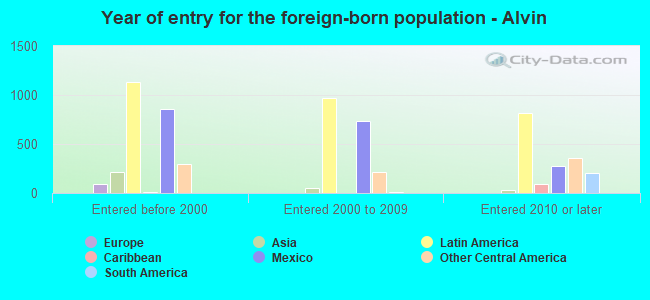
Foreign-born residents in Alvin 3,276 residents are foreign born (10.2% Latin America ).
This city:
11.6%Texas:
17.1%
Marital status for residents in Alvin Marital status - White (Caucasian) population 15 years and over
Males 34.1% Never married48.3% Now married1.5% Separated3.0% Widowed13.1% DivorcedFemales 27.7% Never married42.8% Now married2.0% Separated9.1% Widowed18.3% DivorcedWomen who gave birth in the past 12 months Now married:
73.2% (94)Unmarried:
26.8% (34)
Women who did not give birth in the past 12 months Now married:
40.9% (1,557)Unmarried:
59.1% (2,251)
Marital status - Black or African American population 15 years and over
Males 54.5% Never married43.5% Now married0.0% Separated0.0% Widowed2.0% DivorcedFemales 42.2% Never married41.5% Now married2.3% Separated3.5% Widowed10.5% DivorcedWomen who gave birth in the past 12 months Now married:
100.0% (10)Unmarried:
0.0% (0)
Women who did not give birth in the past 12 months Now married:
19.8% (73)Unmarried:
80.2% (296)
Marital status - American Indian / Alaska Native population 15 years and over
Males 0.0% Never married46.7% Now married0.0% Separated0.0% Widowed53.3% DivorcedFemales 75.0% Never married0.0% Now married0.0% Separated24.1% Widowed0.9% DivorcedWomen who did not give birth in the past 12 months Now married:
0.0% (0)Unmarried:
100.0% (602)
Marital status - Asian population 15 years and over
Males 53.1% Never married46.9% Now married0.0% Separated0.0% Widowed0.0% DivorcedFemales 5.7% Never married57.3% Now married0.0% Separated36.9% Widowed0.0% DivorcedWomen who did not give birth in the past 12 months Now married:
84.2% (50)Unmarried:
15.8% (9)
Marital status - Other race population 15 years and over
Males 38.8% Never married44.5% Now married2.7% Separated7.6% Widowed6.3% DivorcedFemales 23.9% Never married48.4% Now married10.1% Separated11.8% Widowed5.7% DivorcedWomen who gave birth in the past 12 months Now married:
45.9% (23)Unmarried:
54.1% (27)
Women who did not give birth in the past 12 months Now married:
62.6% (168)Unmarried:
37.4% (100)
Marital status - Two or more races population 15 years and over
Males 32.4% Never married64.6% Now married0.0% Separated1.0% Widowed2.0% DivorcedFemales 42.8% Never married50.5% Now married1.5% Separated2.9% Widowed2.3% DivorcedWomen who gave birth in the past 12 months Now married:
100.0% (115)Unmarried:
0.0% (0)
Women who did not give birth in the past 12 months Now married:
45.3% (1,010)Unmarried:
54.7% (1,218)
Marital status - White alone, not Hispanic / Latino population 15 years and over
Males 27.0% Never married52.6% Now married2.4% Separated2.5% Widowed15.5% DivorcedFemales 23.2% Never married42.6% Now married1.1% Separated11.8% Widowed21.3% DivorcedWomen who gave birth in the past 12 months Now married:
89.4% (83)Unmarried:
10.6% (10)
Women who did not give birth in the past 12 months Now married:
40.3% (1,066)Unmarried:
59.7% (1,580)
Marital status - Hispanic or Latino population 15 years and over
Males 42.0% Never married48.2% Now married0.3% Separated2.9% Widowed6.5% DivorcedFemales 40.8% Never married42.6% Now married3.5% Separated5.8% Widowed7.3% DivorcedWomen who gave birth in the past 12 months Now married:
69.0% (122)Unmarried:
31.0% (55)
Women who did not give birth in the past 12 months Now married:
41.0% (1,601)Unmarried:
59.0% (2,300)
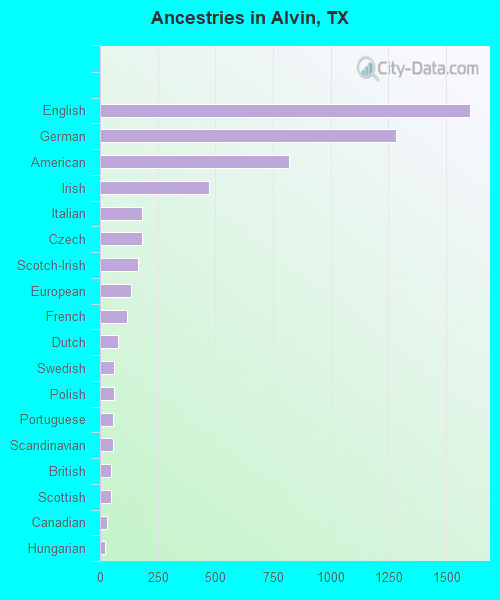
Ancestries in Alvin
1,606 9.2% English1,285 7.4% German819 4.7% American472 2.7% Irish181 1.0% Italian180 1.0% Czech163 0.9% Scotch-Irish133 0.8% European117 0.7% French79 0.5% Dutch62 0.4% Swedish61 0.4% Polish58 0.3% Portuguese58 0.3% Scandinavian49 0.3% British48 0.3% Scottish30 0.2% Canadian20 0.1% Hungarian11 0.06% Ukrainian9 0.05% Czechoslovakian7 0.04% Swiss2 0.01% African
Geographical mobility in Alvin Same house 1 year ago 13,643 85.8% White (Caucasian)1,721 92.4% Black or African American515 61.0% American Indian / Alaska Native354 100.0% Asian975 72.0% Other race6,225 82.1% Two or more races10,220 84.7% White alone, not Hispanic / Latino10,568 82.6% Hispanic or LatinoMoved within same county 1,119 7.0% White / Caucasian43 2.3% Black or African American279 33.0% American Indian / Alaska Native94 7.0% Other race716 9.4% Two or more races854 7.1% White alone, not Hispanic / Latino1,233 9.6% Hispanic or LatinoMoved within same state 823 5.2% White / Caucasian22 1.2% Black or African American260 19.2% Other race531 7.0% Two or more races737 6.1% White alone, not Hispanic / Latino726 5.7% Hispanic or LatinoMoved from different state 272 1.7% White / Caucasian23 1.7% Other race222 1.8% White alone, not Hispanic / Latino141 1.1% Hispanic or Latino
Children Nativity (place of birth) in Alvin
Children under 6 years - Living with two parents Both parents native 1,077 100.0% NativeBoth parents foreign-born 133 100.0% NativeOne native, one foreign-born parent 79 100.0% NativeChildren under 6 years - Living with one parent Native parent 1,387 100.0% NativeForeign-born parent 33 100.0% NativeChildren 6 to 17 years - Living with two parents Both parents native 2,034 100.0% NativeBoth parents foreign-born 437 84.7% Native79 15.3% Foreign-bornOne native, one foreign-born parent 198 100.0% NativeChildren 6 to 17 years - Living with one parent Native parent 1,993 100.0% NativeForeign-born parent 213 60.3% Native140 39.7% Foreign-born
Grandparents responsible for own grandchildren in Alvin
Grandparents (30 to 59 years) White / Caucasian 57 31.2% Responsible for grandchildren126 68.8% Not responsible for grandchildrenOther race 45 100.0% Not responsible for grandchildrenTwo or more races 42 24.5% Responsible for grandchildren131 75.5% Not responsible for grandchildrenWhite alone, not Hispanic / Latino 51 39.5% Responsible for grandchildren78 60.5% Not responsible for grandchildrenHispanic or Latino 85 27.2% Responsible for grandchildren228 72.8% Not responsible for grandchildrenGrandparents (60 years and over) White / Caucasian 78 50.5% Responsible for grandchildren76 49.5% Not responsible for grandchildrenTwo or more races 11 100.0% Responsible for grandchildrenWhite alone, not Hispanic / Latino 101 62.0% Responsible for grandchildren62 38.0% Not responsible for grandchildrenHispanic or Latino 7 16.8% Responsible for grandchildren35 83.2% Not responsible for grandchildren