Races in Amherst, Ohio (OH) Detailed Stats
Data:
Races - White alone (%)
Races - White alone (% change since 2000)
Races - Black alone (%)
Races - Black alone (% change since 2000)
Races - American Indian alone (%)
Races - American Indian alone (% change since 2000)
Races - Asian alone (%)
Races - Asian alone (% change since 2000)
Races - Hispanic (%)
Races - Hispanic (% change since 2000)
Races - Native Hawaiian and Other Pacific Islander alone (%)
Races - Native Hawaiian and Other Pacific Islander alone (% change since 2000)
Races - Two or more races(%)
Races - Two or more races(% change since 2000)
Races - Other race alone (%)
Races - Other race alone (% change since 2000)
Racial diversity
Place of birth - Born in state of residence (%)
Place of birth - Born in state of residence (%) - White
Place of birth - Born in state of residence (%) - Black or African American
Place of birth - Born in state of residence (%) - Asian
Place of birth - Born in state of residence (%) - Hispanic or Latino
Place of birth - Born in state of residence (%) - American Indian and Alaska Native
Place of birth - Born in state of residence (%) - Multirace
Place of birth - Born in state of residence (%) - Other Race
Place of birth - Born in other state (%)
Place of birth - Born in other state (%) - White
Place of birth - Born in other state (%) - Black or African American
Place of birth - Born in other state (%) - Asian
Place of birth - Born in other state (%) - Hispanic or Latino
Place of birth - Born in other state (%) - American Indian and Alaska Native
Place of birth - Born in other state (%) - Multirace
Place of birth - Born in other state (%) - Other Race
Place of birth - Native, outside of US (%)
Place of birth - Native, outside of US (%) - White
Place of birth - Native, outside of US (%) - Black or African American
Place of birth - Native, outside of US (%) - Asian
Place of birth - Native, outside of US (%) - Hispanic or Latino
Place of birth - Native, outside of US (%) - American Indian and Alaska Native
Place of birth - Native, outside of US (%) - Multirace
Place of birth - Native, outside of US (%) - Other Race
Place of birth - Foreign born (%)
Place of birth - Foreign born (%) - White
Place of birth - Foreign born (%) - Black or African American
Place of birth - Foreign born (%) - Asian
Place of birth - Foreign born (%) - Hispanic or Latino
Place of birth - Foreign born (%) - American Indian and Alaska Native
Place of birth - Foreign born (%) - Multirace
Place of birth - Foreign born (%) - Other Race
Residents speaking English at home (%)
Residents speaking English at home - Born in the United States (%)
Residents speaking English at home - Native, born elsewhere (%)
Residents speaking English at home - Foreign born (%)
Residents speaking Spanish at home (%)
Residents speaking Spanish at home - Born in the United States (%)
Residents speaking Spanish at home - Native, born elsewhere (%)
Residents speaking Spanish at home - Foreign born (%)
Residents speaking other language at home (%)
Residents speaking other language at home - Born in the United States (%)
Residents speaking other language at home - Native, born elsewhere (%)
Residents speaking other language at home - Foreign born (%)
Marital status - Never married (%)
Marital status - Now married (%)
Marital status - Separated (%)
Marital status - Widowed (%)
Marital status - Divorced (%)
Ancestries Reported - Arab (%)
Ancestries Reported - Czech (%)
Ancestries Reported - Danish (%)
Ancestries Reported - Dutch (%)
Ancestries Reported - English (%)
Ancestries Reported - French (%)
Ancestries Reported - French Canadian (%)
Ancestries Reported - German (%)
Ancestries Reported - Greek (%)
Ancestries Reported - Hungarian (%)
Ancestries Reported - Irish (%)
Ancestries Reported - Italian (%)
Ancestries Reported - Lithuanian (%)
Ancestries Reported - Norwegian (%)
Ancestries Reported - Polish (%)
Ancestries Reported - Portuguese (%)
Ancestries Reported - Russian (%)
Ancestries Reported - Scotch-Irish (%)
Ancestries Reported - Scottish (%)
Ancestries Reported - Slovak (%)
Ancestries Reported - Subsaharan African (%)
Ancestries Reported - Swedish (%)
Ancestries Reported - Swiss (%)
Ancestries Reported - Ukrainian (%)
Ancestries Reported - United States (%)
Ancestries Reported - Welsh (%)
Ancestries Reported - West Indian (%)
Ancestries Reported - Other (%)
Geographical mobility - Same house 1 year ago (%)
Geographical mobility - Same house 1 year ago (%) - White
Geographical mobility - Same house 1 year ago (%) - Black or African American
Geographical mobility - Same house 1 year ago (%) - Asian
Geographical mobility - Same house 1 year ago (%) - Hispanic or Latino
Geographical mobility - Same house 1 year ago (%) - American Indian and Alaska Native
Geographical mobility - Same house 1 year ago (%) - Multirace
Geographical mobility - Same house 1 year ago (%) - Other Race
Geographical mobility - Moved within same county (%)
Geographical mobility - Moved within same county (%) - White
Geographical mobility - Moved within same county (%) - Black or African American
Geographical mobility - Moved within same county (%) - Asian
Geographical mobility - Moved within same county (%) - Hispanic or Latino
Geographical mobility - Moved within same county (%) - American Indian and Alaska Native
Geographical mobility - Moved within same county (%) - Multirace
Geographical mobility - Moved within same county (%) - Other Race
Geographical mobility - Moved from different county within same state (%)
Geographical mobility - Moved from different county within same state (%) - White
Geographical mobility - Moved from different county within same state (%) - Black or African American
Geographical mobility - Moved from different county within same state (%) - Asian
Geographical mobility - Moved from different county within same state (%) - Hispanic or Latino
Geographical mobility - Moved from different county within same state (%) - American Indian and Alaska Native
Geographical mobility - Moved from different county within same state (%) - Multirace
Geographical mobility - Moved from different county within same state (%) - Other Race
Geographical mobility - Moved from different state (%)
Geographical mobility - Moved from different state (%) - White
Geographical mobility - Moved from different state (%) - Black or African American
Geographical mobility - Moved from different state (%) - Asian
Geographical mobility - Moved from different state (%) - Hispanic or Latino
Geographical mobility - Moved from different state (%) - American Indian and Alaska Native
Geographical mobility - Moved from different state (%) - Multirace
Geographical mobility - Moved from different state (%) - Other Race
Geographical mobility - Moved from abroad (%)
Geographical mobility - Moved from abroad (%) - White
Geographical mobility - Moved from abroad (%) - Black or African American
Geographical mobility - Moved from abroad (%) - Asian
Geographical mobility - Moved from abroad (%) - Hispanic or Latino
Geographical mobility - Moved from abroad (%) - American Indian and Alaska Native
Geographical mobility - Moved from abroad (%) - Multirace
Geographical mobility - Moved from abroad (%) - Other Race
Place of birth for the foreign-born population - Ireland (%)
Place of birth for the foreign-born population - Denmark (%)
Place of birth for the foreign-born population - Norway (%)
Place of birth for the foreign-born population - Sweden (%)
Place of birth for the foreign-born population - United Kingdom (%)
Place of birth for the foreign-born population - England (%)
Place of birth for the foreign-born population - Scotland (%)
Place of birth for the foreign-born population - Other Northern Europe (%)
Place of birth for the foreign-born population - Austria (%)
Place of birth for the foreign-born population - Belgium (%)
Place of birth for the foreign-born population - France (%)
Place of birth for the foreign-born population - Germany (%)
Place of birth for the foreign-born population - Netherlands (%)
Place of birth for the foreign-born population - Switzerland (%)
Place of birth for the foreign-born population - Other Western Europe (%)
Place of birth for the foreign-born population - Greece (%)
Place of birth for the foreign-born population - Italy (%)
Place of birth for the foreign-born population - Portugal (%)
Place of birth for the foreign-born population - Spain (%)
Place of birth for the foreign-born population - Other Southern Europe (%)
Place of birth for the foreign-born population - Albania (%)
Place of birth for the foreign-born population - Belarus (%)
Place of birth for the foreign-born population - Bosnia and Herzegovina (%)
Place of birth for the foreign-born population - Bulgaria (%)
Place of birth for the foreign-born population - Croatia (%)
Place of birth for the foreign-born population - Czechoslovakia (%)
Place of birth for the foreign-born population - Hungary (%)
Place of birth for the foreign-born population - Latvia (%)
Place of birth for the foreign-born population - Lithuania (%)
Place of birth for the foreign-born population - North Macedonia (Macedonia) (%)
Place of birth for the foreign-born population - Moldova (%)
Place of birth for the foreign-born population - Poland (%)
Place of birth for the foreign-born population - Romania (%)
Place of birth for the foreign-born population - Russia (%)
Place of birth for the foreign-born population - Serbia (%)
Place of birth for the foreign-born population - Ukraine (%)
Place of birth for the foreign-born population - Other Eastern Europe (%)
Place of birth for the foreign-born population - China (%)
Place of birth for the foreign-born population - Hong Kong (%)
Place of birth for the foreign-born population - Taiwan (%)
Place of birth for the foreign-born population - Japan (%)
Place of birth for the foreign-born population - Korea (%)
Place of birth for the foreign-born population - Other Eastern Asia (%)
Place of birth for the foreign-born population - Afghanistan (%)
Place of birth for the foreign-born population - Bangladesh (%)
Place of birth for the foreign-born population - India (%)
Place of birth for the foreign-born population - Iran (%)
Place of birth for the foreign-born population - Kazakhstan (%)
Place of birth for the foreign-born population - Nepal (%)
Place of birth for the foreign-born population - Pakistan (%)
Place of birth for the foreign-born population - Sri Lanka (%)
Place of birth for the foreign-born population - Uzbekistan (%)
Place of birth for the foreign-born population - Other South Central Asia (%)
Place of birth for the foreign-born population - Burma (%)
Place of birth for the foreign-born population - Cambodia (%)
Place of birth for the foreign-born population - Indonesia (%)
Place of birth for the foreign-born population - Laos (%)
Place of birth for the foreign-born population - Malaysia (%)
Place of birth for the foreign-born population - Philippines (%)
Place of birth for the foreign-born population - Singapore (%)
Place of birth for the foreign-born population - Thailand (%)
Place of birth for the foreign-born population - Vietnam (%)
Place of birth for the foreign-born population - Other South Eastern Asia (%)
Place of birth for the foreign-born population - Armenia (%)
Place of birth for the foreign-born population - Iraq (%)
Place of birth for the foreign-born population - Israel (%)
Place of birth for the foreign-born population - Jordan (%)
Place of birth for the foreign-born population - Kuwait (%)
Place of birth for the foreign-born population - Lebanon (%)
Place of birth for the foreign-born population - Saudi Arabia (%)
Place of birth for the foreign-born population - Syria (%)
Place of birth for the foreign-born population - Turkey (%)
Place of birth for the foreign-born population - Yemen (%)
Place of birth for the foreign-born population - Other Western Asia (%)
Place of birth for the foreign-born population - Eritrea (%)
Place of birth for the foreign-born population - Ethiopia (%)
Place of birth for the foreign-born population - Kenya (%)
Place of birth for the foreign-born population - Somalia (%)
Place of birth for the foreign-born population - Uganda (%)
Place of birth for the foreign-born population - Zimbabwe (%)
Place of birth for the foreign-born population - Other Eastern Africa (%)
Place of birth for the foreign-born population - Cameroon (%)
Place of birth for the foreign-born population - Congo (%)
Place of birth for the foreign-born population - Democratic Republic of Congo (Zaire) (%)
Place of birth for the foreign-born population - Other Middle Africa (%)
Place of birth for the foreign-born population - Egypt (%)
Place of birth for the foreign-born population - Morocco (%)
Place of birth for the foreign-born population - Sudan (%)
Place of birth for the foreign-born population - Other Northern Africa (%)
Place of birth for the foreign-born population - South Africa (%)
Place of birth for the foreign-born population - Other Southern Africa (%)
Place of birth for the foreign-born population - Cabo Verde (%)
Place of birth for the foreign-born population - Ghana (%)
Place of birth for the foreign-born population - Liberia (%)
Place of birth for the foreign-born population - Nigeria (%)
Place of birth for the foreign-born population - Senegal (%)
Place of birth for the foreign-born population - Sierra Leone (%)
Place of birth for the foreign-born population - Other Western Africa (%)
Place of birth for the foreign-born population - Australia (%)
Place of birth for the foreign-born population - New Zealand (%)
Place of birth for the foreign-born population - Fiji (%)
Place of birth for the foreign-born population - Micronesia (%)
Place of birth for the foreign-born population - Bahamas (%)
Place of birth for the foreign-born population - Barbados (%)
Place of birth for the foreign-born population - Cuba (%)
Place of birth for the foreign-born population - Dominica (%)
Place of birth for the foreign-born population - Dominican Republic (%)
Place of birth for the foreign-born population - Grenada (%)
Place of birth for the foreign-born population - Haiti (%)
Place of birth for the foreign-born population - Jamaica (%)
Place of birth for the foreign-born population - St. Vincent and the Grenadines (%)
Place of birth for the foreign-born population - Trinidad and Tobago (%)
Place of birth for the foreign-born population - West Indies (%)
Place of birth for the foreign-born population - Other Caribbean (%)
Place of birth for the foreign-born population - Belize (%)
Place of birth for the foreign-born population - Costa Rica (%)
Place of birth for the foreign-born population - El Salvador (%)
Place of birth for the foreign-born population - Guatemala (%)
Place of birth for the foreign-born population - Honduras (%)
Place of birth for the foreign-born population - Mexico (%)
Place of birth for the foreign-born population - Nicaragua (%)
Place of birth for the foreign-born population - Panama (%)
Place of birth for the foreign-born population - Other Central America (%)
Place of birth for the foreign-born population - Argentina (%)
Place of birth for the foreign-born population - Bolivia (%)
Place of birth for the foreign-born population - Brazil (%)
Place of birth for the foreign-born population - Chile (%)
Place of birth for the foreign-born population - Colombia (%)
Place of birth for the foreign-born population - Ecuador (%)
Place of birth for the foreign-born population - Guyana (%)
Place of birth for the foreign-born population - Peru (%)
Place of birth for the foreign-born population - Uruguay (%)
Place of birth for the foreign-born population - Venezuela (%)
Place of birth for the foreign-born population - Other South America (%)
Place of birth for the foreign-born population - Canada (%)
Place of birth for the foreign-born population - Other Northern America (%)
Place of birth for the foreign-born population - Other (%)
Latest news about races in Amherst, OH collected exclusively by city-data.com from local newspapers, TV, and radio stations
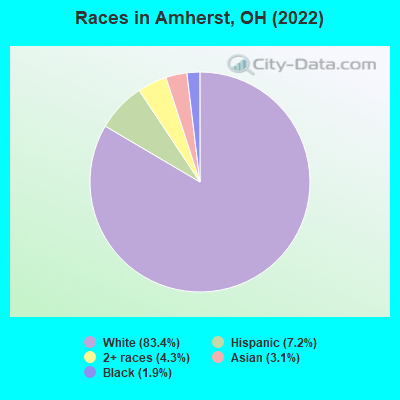
According to 2022 data, the most numerous races in Amherst, OH are White alone (10,730 residents), Black alone (241 residents), and Two or more races (556 residents). 95.1% of Amherst residents speak English at home. 4.6% of Amherst, OH residents are foreign-born (2.5% born in Asia, 1.0% born in Europe, 0.6% born in Latin America), which is 13.0% greater than the foreign-born rate of 4.0% across the entire state of Ohio.
Race distribution in Amherst
2000 2022
9,538,111 84.0% White alone 1,290,662 11.4% Black alone 217,123 1.9% Hispanic 137,770 1.2% Two or more races 131,670 1.2% Asian alone 21,985 0.2% American Indian alone 13,483 0.1% Other race alone 2,336 0.02% Native Hawaiian and Other
8,948,793 76.1% White alone 1,401,403 11.9% Black alone 529,291 4.5% Two or more races 517,232 4.4% Hispanic 293,387 2.5% Asian alone 52,805 0.4% Other race alone 9,785 0.08% American Indian alone 3,362 0.03% Native Hawaiian and Other
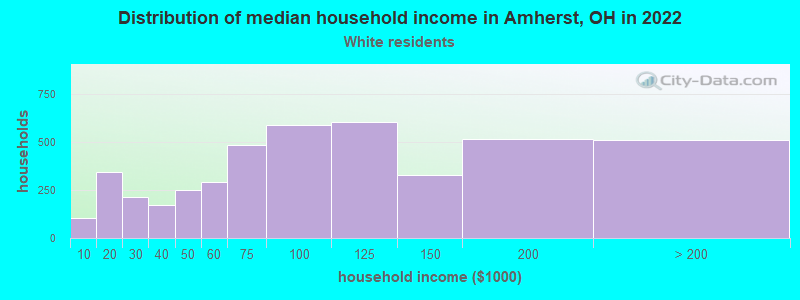
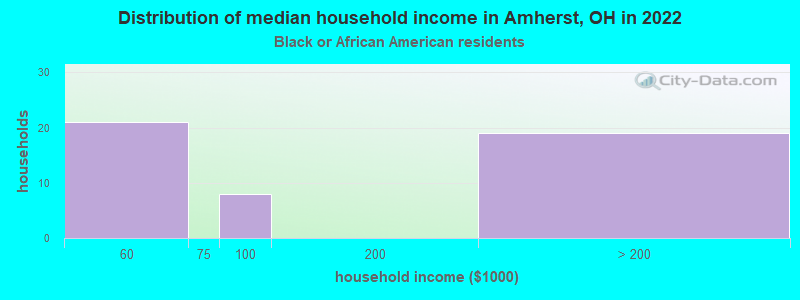
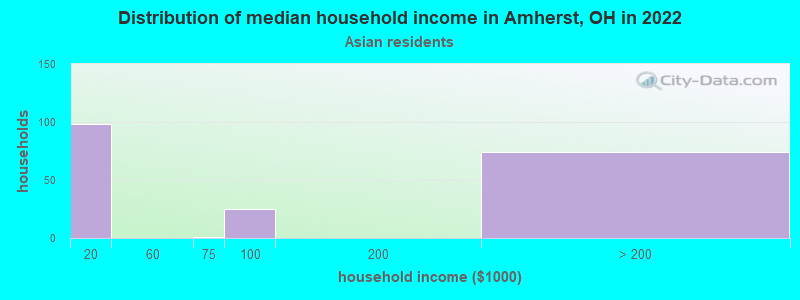
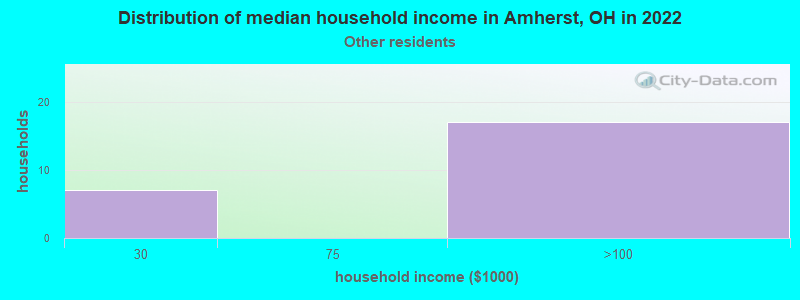
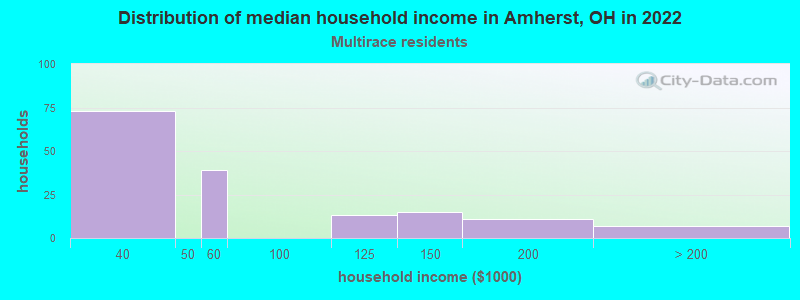
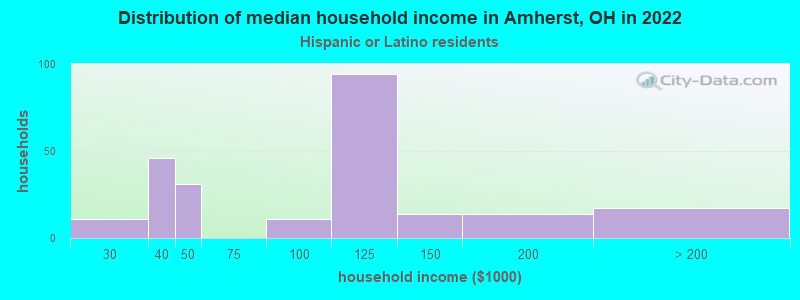
Income and house value in Amherst Median household income in 2022 $84,434 White non-Hispanic householdersover $200,000 Black householders$53,846 Two or more races householders$131,205 Hispanic or Latino race householdersMedian 2022 house value $222,359 White Non-Hispanic householders $151,102 Asian householders$357,874 Some other race householders$94,478 Two or more races householders$194,842 Hispanic or Latino householders
Median age by race in Amherst
46.2 Median age for White residents43.1 50.8 22.0 Median age for Black or African American residents22.2 28.5 -730,225,988.0 Median age for American Indian / Alaska Native residents-735,686,273.8 -708,672,086.0 84.7 Median age for Asian residents78.2 84.1 -666,666,666.0 Median age for Native Hawaiian / Pacific Islander residents-666,666,666.0 -666,666,666.0 31.6 Median age for Other race residents39.0 24.4 20.7 Median age for Two or more races residents19.4 24.2 46.7 Median age for White alone residents43.5 51.7 18.2 Median age for Hispanic or Latino residents12.6 24.2
Owner/renter occupied households by race in Amherst
House owners and renters - White residents 3,935 88.4% Owner occupied514 11.6% Renter occupiedHouse owners and renters - Black or African American residents 55 100.0% Owner occupiedHouse owners and renters - Asian residents 222 92.7% Owner occupied17 7.3% Renter occupiedHouse owners and renters - Other race residents 13 100.0% Owner occupiedHouse owners and renters - Two or more races residents 63 40.6% Owner occupied93 59.4% Renter occupiedHouse owners and renters - White alone residents 3,877 87.8% Owner occupied537 12.2% Renter occupiedHouse owners and renters - Hispanic or Latino residents 158 75.6% Owner occupied51 24.4% Renter occupied
Language usage in Amherst
English speakers - Total 95.1% of residents of Amherst speak English at home.
1.1% of residents speak Spanish at home 124 89.9% Speak English very well14 10.1% Speak English less than very well3.5% of residents speak other language at home 413 96.7% Speak English very well14 3.3% Speak English less than very well
English speakers - Born in the United States 95.3% of residents of Amherst speak English at home.
1.2% of residents speak Spanish at home 19 86.4% Speak English very well3 13.6% Speak English less than very well1.1% of residents speak other language at home 21 100.0% Speak English very well
English speakers - Native, born elsewhere 83.9% of residents of Amherst speak English at home.
9.7% of residents speak Spanish at home 3 100.0% Speak English very well
English speakers - Foreign-born 16.1% of residents of Amherst speak English at home.
16.9% of residents speak Spanish at home 90 100.0% Speak English very well74.7% of residents speak other language at home 390 97.7% Speak English very well9 2.3% Speak English less than very well
White (Caucasian) - Speak only English Native:
100.0% (10,492)Foreign-born:
100.0% (114)
White (Caucasian) - Speak another language Native:
0.5% (51)Foreign-born:
23.7% (27)
Black or African American - Speak only English Native:
99.8% (208)Foreign-born:
100.0% (40)
Asian - Speak only English Native:
91.6% (39)Foreign-born:
4.6% (15)
Two or more races - Speak only English Native:
94.8% (720)Foreign-born:
3.4% (4)
Two or more races - Speak another language Native:
2.9% (22)Foreign-born:
100.0% (104)
White alone - Speak only English Native:
100.0% (10,137)Foreign-born:
100.0% (116)
White alone - Speak another language Native:
0.3% (32)Foreign-born:
26.4% (31)
Hispanic or Latino - Speak only English Native:
85.3% (704)Foreign-born:
4.8% (3)
Hispanic or Latino - Speak another language Native:
10.3% (85)Foreign-born:
98.3% (68)
Foreign-born residents in Amherst 592 residents are foreign born (2.5% Asia , 1.0% Europe , 0.6% Latin America ).
Marital status for residents in Amherst Marital status - White (Caucasian) population 15 years and over
Males 31.5% Never married59.6% Now married0.3% Separated1.8% Widowed6.8% DivorcedFemales 24.3% Never married52.1% Now married0.9% Separated11.5% Widowed11.2% DivorcedWomen who gave birth in the past 12 months Now married:
88.2% (57)Unmarried:
11.8% (8)
Women who did not give birth in the past 12 months Now married:
45.5% (932)Unmarried:
54.5% (1,116)
Marital status - Black or African American population 15 years and over
Males 77.6% Never married19.2% Now married0.0% Separated3.2% Widowed0.0% DivorcedFemales 42.6% Never married40.4% Now married0.0% Separated12.8% Widowed4.3% DivorcedWomen who did not give birth in the past 12 months Now married:
42.2% (32)Unmarried:
57.8% (43)
Marital status - Asian population 15 years and over
Males 18.0% Never married72.1% Now married9.9% Separated0.0% Widowed0.0% DivorcedFemales 23.1% Never married76.9% Now married0.0% Separated0.0% Widowed0.0% DivorcedWomen who did not give birth in the past 12 months Now married:
35.0% (21)Unmarried:
65.0% (39)
Marital status - Other race population 15 years and over
Males 20.8% Never married50.0% Now married0.0% Separated0.0% Widowed29.2% DivorcedFemales 57.6% Never married42.4% Now married0.0% Separated0.0% Widowed0.0% DivorcedWomen who gave birth in the past 12 months Now married:
100.0% (18)Unmarried:
0.0% (0)
Women who did not give birth in the past 12 months Now married:
0.0% (0)Unmarried:
100.0% (25)
Marital status - Two or more races population 15 years and over
Males 72.0% Never married16.5% Now married0.0% Separated0.0% Widowed11.5% DivorcedFemales 64.0% Never married19.8% Now married0.0% Separated16.3% Widowed0.0% DivorcedWomen who did not give birth in the past 12 months Now married:
16.6% (62)Unmarried:
83.4% (313)
Marital status - White alone, not Hispanic / Latino population 15 years and over
Males 30.6% Never married60.2% Now married0.3% Separated1.8% Widowed7.0% DivorcedFemales 22.8% Never married52.9% Now married1.0% Separated11.8% Widowed11.6% DivorcedWomen who gave birth in the past 12 months Now married:
88.2% (59)Unmarried:
11.8% (8)
Women who did not give birth in the past 12 months Now married:
47.0% (922)Unmarried:
53.0% (1,039)
Marital status - Hispanic or Latino population 15 years and over
Males 54.4% Never married38.8% Now married0.0% Separated0.0% Widowed6.8% DivorcedFemales 50.7% Never married33.3% Now married0.0% Separated14.8% Widowed1.2% DivorcedWomen who gave birth in the past 12 months Now married:
100.0% (14)Unmarried:
0.0% (0)
Women who did not give birth in the past 12 months Now married:
28.3% (71)Unmarried:
71.7% (180)
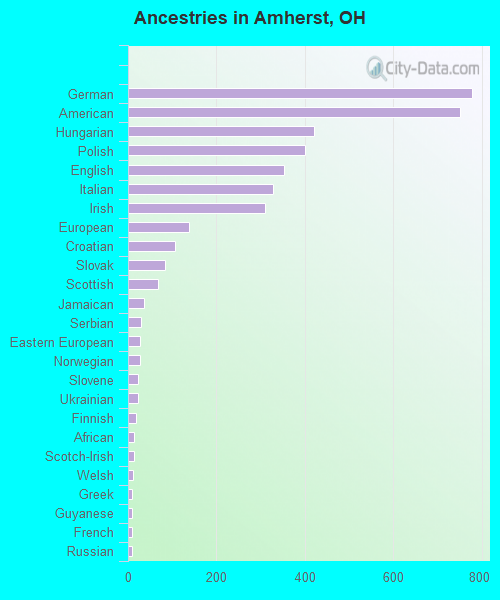
Ancestries in Amherst
778 15.1% German752 14.6% American421 8.2% Hungarian400 7.7% Polish354 6.9% English328 6.4% Italian310 6.0% Irish138 2.7% European107 2.1% Croatian84 1.6% Slovak68 1.3% Scottish36 0.7% Jamaican30 0.6% Serbian28 0.5% Eastern European27 0.5% Norwegian23 0.4% Slovene22 0.4% Ukrainian19 0.4% Finnish14 0.3% African13 0.3% Scotch-Irish11 0.2% Welsh10 0.2% Greek10 0.2% Guyanese9 0.2% French9 0.2% Russian8 0.2% Lebanese8 0.2% Carpatho Rusyn8 0.2% Swedish
Children Nativity (place of birth) in Amherst
Children under 6 years - Living with two parents Both parents native 512 100.0% NativeOne native, one foreign-born parent 13 100.0% NativeChildren under 6 years - Living with one parent Native parent 77 100.0% Native
Children 6 to 17 years - Living with two parents Both parents native 1,335 100.0% NativeBoth parents foreign-born 17 100.0% NativeOne native, one foreign-born parent 18 100.0% NativeChildren 6 to 17 years - Living with one parent Native parent 429 100.0% Native
Grandparents responsible for own grandchildren in Amherst
Grandparents (30 to 59 years) White / Caucasian 14 82.3% Responsible for grandchildren3 17.7% Not responsible for grandchildrenWhite alone, not Hispanic / Latino 14 81.8% Responsible for grandchildren3 18.2% Not responsible for grandchildrenGrandparents (60 years and over) White / Caucasian 17 18.1% Responsible for grandchildren78 81.9% Not responsible for grandchildrenWhite alone, not Hispanic / Latino 17 17.4% Responsible for grandchildren79 82.6% Not responsible for grandchildren