Races in Applewood, Colorado (CO) Detailed Stats
Ancestries, Foreign-born residents, place of birth
Settings
X


Recent posts about races in Applewood, Colorado on our local forum with over 2,400,000 registered users:
 | Golden and Wheat Ridge (8 replies) |
| Move to Denver from Charlotte - 36m/34f/2 girls/ 15mo and 10 (53 replies) |
| Mid Century Modern Houses or similar in Close-in Suburbs? (31 replies) |
| What part of town is better: Applewood or University (2 replies) |
| Anywhere but Applewood? (Bye, Berkeley!) (14 replies) |
| Relocating (Back) to Denver - Suburb Thoughts? (30 replies) |
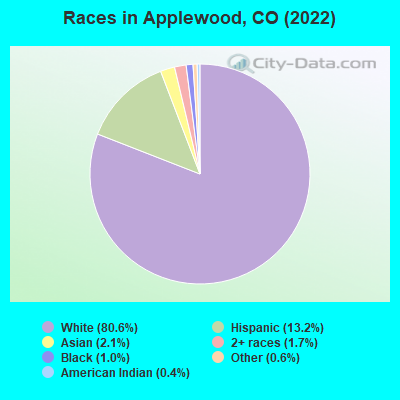
According to 2022 data, the most numerous races in Applewood, CO are White alone (7,017 residents), Hispanic (966 residents), and Two or more races (174 residents). 91.2% of Applewood residents speak English at home. 4.1% of Applewood, CO residents are foreign-born (1.4% born in Latin America, 1.1% born in Europe, 0.8% born in Asia, 0.7% born in North America), which is 117.4% less than the foreign-born rate of 9.0% across the entire state of Colorado.
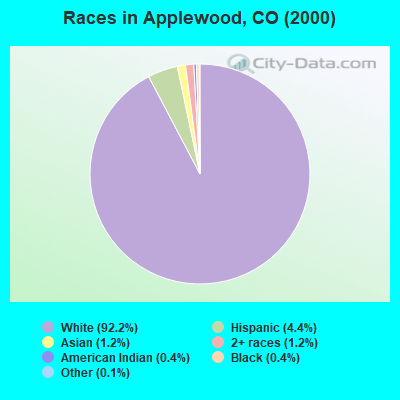
Race distribution in Applewood
2000
2022

- 6,56992.2%White alone
- 3124.4%Hispanic
- 861.2%Two or more races
- 871.2%Asian alone
- 260.4%Black alone
- 310.4%American Indian alone
- 90.1%Other race alone
- 30.04%Native Hawaiian and Other
Pacific Islander alone
-
- 7,01782.3%White alone
- 96611.3%Hispanic
- 1742.0%Two or more races
- 1421.7%Asian alone
- 690.8%Black alone
- 130.2%American Indian alone
2000
2022
-
- 3,202,88074.5%White alone
- 735,60117.1%Hispanic
- 158,4433.7%Black alone
- 93,2772.2%Asian alone
- 72,7211.7%Two or more races
- 28,9820.7%American Indian alone
- 5,5120.1%Other race alone
- 3,8450.09%Native Hawaiian and Other
Pacific Islander alone

-
- 3,793,27065.0%White alone
- 1,314,96222.5%Hispanic
- 268,7544.6%Two or more races
- 220,7563.8%Black alone
- 182,6583.1%Asian alone
- 29,7980.5%Other race alone
- 23,3890.4%American Indian alone
- 6,3390.1%Native Hawaiian and Other
Pacific Islander alone

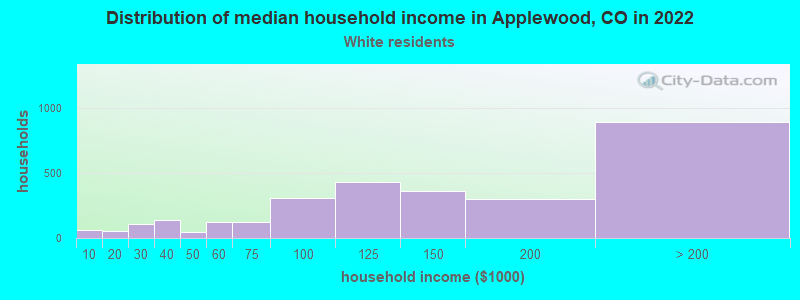
Income and house value in Applewood
- Median household income in 2022
- $137,550White non-Hispanic householders
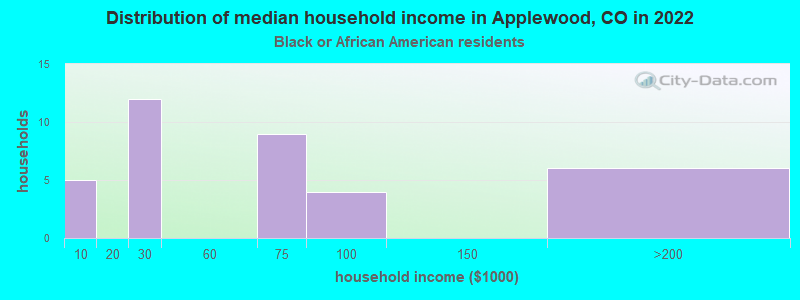
- $50,152Black householders
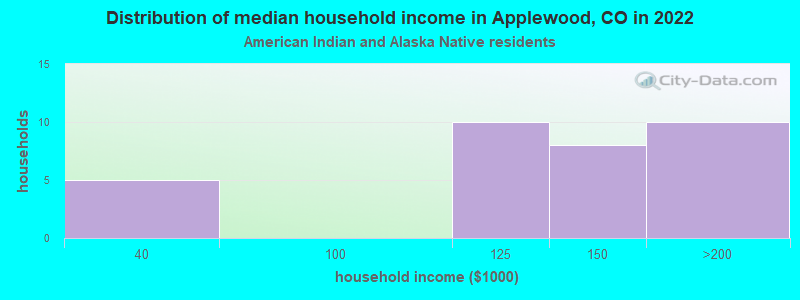
- $14,196American Indian and Alaska Native householders
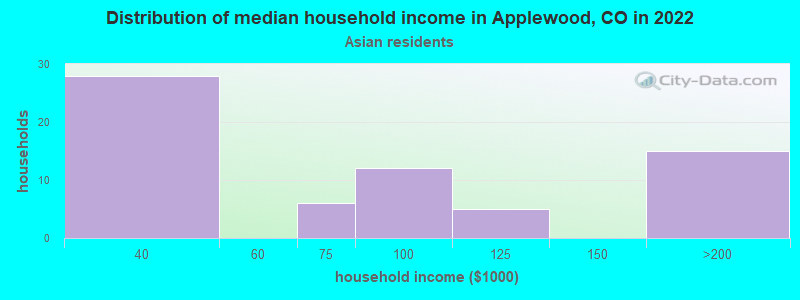
- over $200,000Asian householders
- $189,801Some other race householders
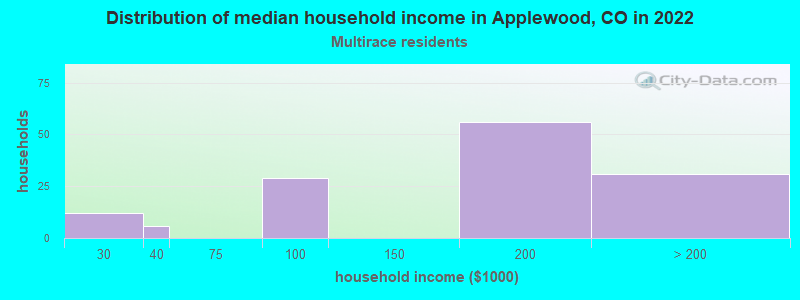
- over $200,000Two or more races householders
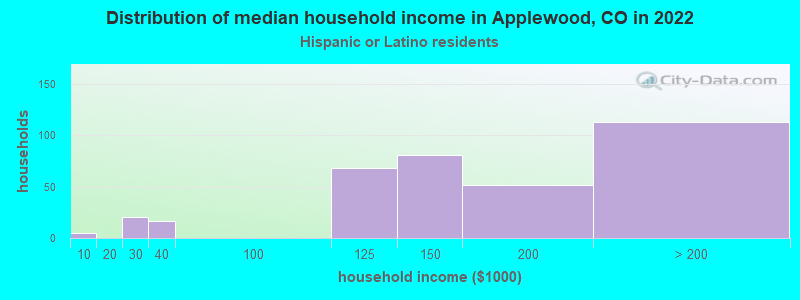
- $150,122Hispanic or Latino race householders
- Median 2022 house value
- $784,873White Non-Hispanic householders
- over $1,000,000Black or African American householders
- $456,128American Indian or Alaska Native householders
- $663,460Asian householders
- $642,893Two or more races householders
- $692,652Hispanic or Latino householders
Household income for White non-Hispanic householders
Household income for Black householders
Household income for American Indian and Alaska Native householders
Household income for Asian householders
Household income for Two or more races householders
Household income for Hispanic or Latino race householders
Median age by race in Applewood
- 42.0Median age for White residents
- 42.1Males
- 42.0Females
- 67.5Median age for Black or African American residents
- 77.0Males
- 44.4Females
- 47.7Median age for American Indian / Alaska Native residents
- 46.5Median age for Asian residents
- 54.2Males
- 44.1Females
- 52.6Median age for Other race residents
- 6.0Median age for Two or more races residents
- 101.6Males
- 3.2Females
- 43.3Median age for White alone residents
- 42.4Males
- 43.7Females
- 33.6Median age for Hispanic or Latino residents
- 36.0Males
- 33.6Females
Owner/renter occupied households by race in Applewood
- House owners and renters - White residents
- 2,40476.9%Owner occupied
- 72323.1%Renter occupied
- House owners and renters - Black or African American residents
- 1036.9%Owner occupied
- 1863.1%Renter occupied
- House owners and renters - American Indian / Alaska Native residents
- 321.6%Owner occupied
- 1178.4%Renter occupied
- House owners and renters - Asian residents
- 38100.0%Owner occupied
- House owners and renters - Other race residents
- 12100.0%Owner occupied
- House owners and renters - Two or more races residents
- 3832.9%Owner occupied
- 7867.1%Renter occupied
- House owners and renters - White alone residents
- 2,34079.9%Owner occupied
- 59020.1%Renter occupied
- House owners and renters - Hispanic or Latino residents
- 16746.2%Owner occupied
- 19553.8%Renter occupied
Language usage in Applewood
- English speakers - Total
- 91.2% of residents of Applewood speak English at home.
- 6.7% of residents speak Spanish at home
- 47192.2%Speak English very well
- 407.8%Speak English less than very well
- 2.5% of residents speak other language at home
- 17187.7%Speak English very well
- 2412.3%Speak English less than very well
- English speakers - Born in the United States
- 95.8% of residents of Applewood speak English at home.
- 3.0% of residents speak Spanish at home
- 129100.0%Speak English very well
- 1.2% of residents speak other language at home
- 52100.0%Speak English very well
- English speakers - Native, born elsewhere
- 69.6% of residents of Applewood speak English at home.
- 9.6% of residents speak Spanish at home
- 12100.0%Speak English very well
- 17.6% of residents speak other language at home
- 22100.0%Speak English very well
- English speakers - Foreign-born
- 42.5% of residents of Applewood speak English at home.
- 32.2% of residents speak Spanish at home
- 8475.0%Speak English very well
- 2825.0%Speak English less than very well
- 27.6% of residents speak other language at home
- 7275.0%Speak English very well
- 2425.0%Speak English less than very well
White (Caucasian) - Speak only English
| Native: | 95.2% (6,376) |
| Foreign-born: | 71.9% (125) |
White (Caucasian) - Speak another language
| Native: | 5.0% (336) |
| Foreign-born: | 47.4% (82) |
Asian - Speak only English
| Native: | 100.0% (65) |
| Foreign-born: | 19.8% (13) |
White alone - Speak only English
| Native: | 98.1% (6,196) |
| Foreign-born: | 73.1% (122) |
White alone - Speak another language
| Native: | 2.0% (125) |
| Foreign-born: | 29.0% (49) |
Hispanic or Latino - Speak another language
| Native: | 49.5% (392) |
| Foreign-born: | 94.3% (91) |
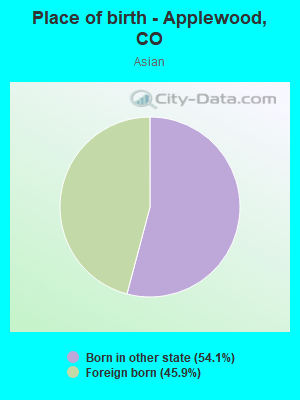
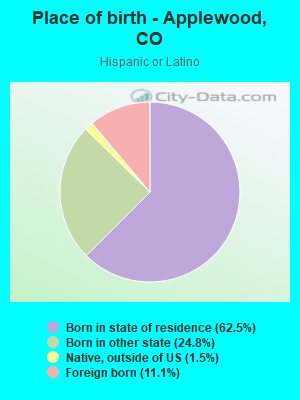
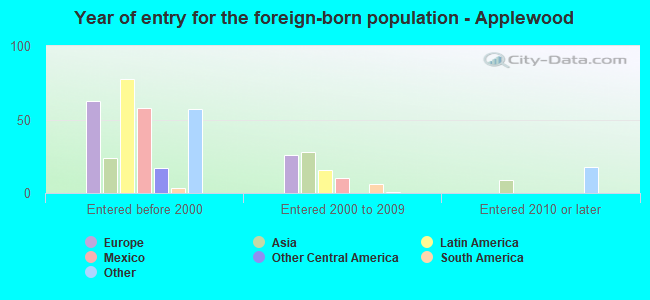
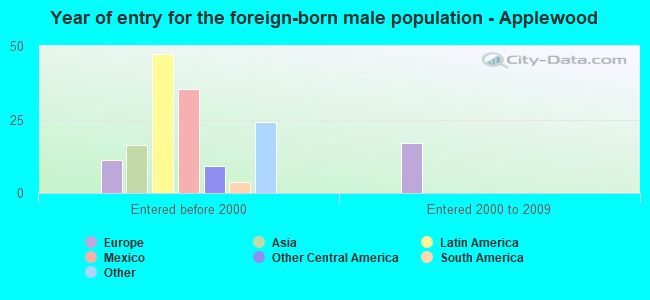
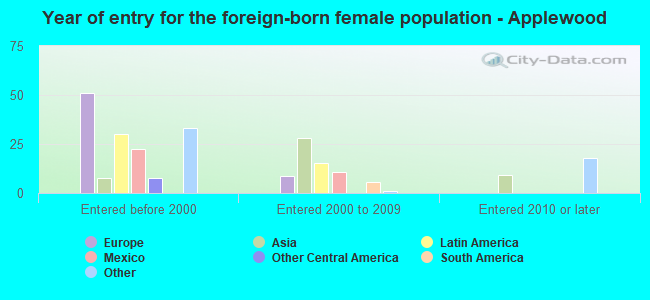
Foreign-born residents in Applewood
349 residents are foreign born (1.4% Latin America, 1.1% Europe, 0.8% Asia, 0.7% North America).
| This city: | 4.1% |
| Colorado: | 100.0% |


Marital status for residents in Applewood
Marital status - White (Caucasian) population 15 years and over
- Males
- 25.2%Never married
- 61.0%Now married
- 2.5%Separated
- 2.5%Widowed
- 8.8%Divorced
- Females
- 25.5%Never married
- 53.0%Now married
- 0.8%Separated
- 8.3%Widowed
- 12.4%Divorced
Women who gave birth in the past 12 months
| Now married: | 91.7% (82) |
| Unmarried: | 8.3% (7) |
Women who did not give birth in the past 12 months
| Now married: | 46.2% (721) |
| Unmarried: | 53.8% (838) |
Marital status - Black or African American population 15 years and over
- Males
- 13.9%Never married
- 86.1%Now married
- 0.0%Separated
- 0.0%Widowed
- 0.0%Divorced
- Females
- 3.1%Never married
- 62.5%Now married
- 0.0%Separated
- 0.0%Widowed
- 34.4%Divorced
Women who gave birth in the past 12 months
| Now married: | 100.0% (9) |
| Unmarried: | 0.0% (0) |
Women who did not give birth in the past 12 months
| Now married: | 20.0% (2) |
| Unmarried: | 80.0% (8) |
Marital status - American Indian / Alaska Native population 15 years and over
- Males
- 0.0%Never married
- 0.0%Now married
- 0.0%Separated
- 100.0%Widowed
- 0.0%Divorced
- Females
- 41.7%Never married
- 58.3%Now married
- 0.0%Separated
- 0.0%Widowed
- 0.0%Divorced
Women who did not give birth in the past 12 months
| Now married: | 100.0% (7) |
| Unmarried: | 0.0% (0) |
Marital status - Asian population 15 years and over
- Males
- 12.2%Never married
- 87.8%Now married
- 0.0%Separated
- 0.0%Widowed
- 0.0%Divorced
- Females
- 11.4%Never married
- 88.6%Now married
- 0.0%Separated
- 0.0%Widowed
- 0.0%Divorced
Women who did not give birth in the past 12 months
| Now married: | 87.1% (65) |
| Unmarried: | 12.9% (10) |
Marital status - Two or more races population 15 years and over
- Males
- 12.0%Never married
- 64.0%Now married
- 0.0%Separated
- 24.0%Widowed
- 0.0%Divorced
- Females
- 0.0%Never married
- 100.0%Now married
- 0.0%Separated
- 0.0%Widowed
- 0.0%Divorced
Women who did not give birth in the past 12 months
| Now married: | 100.0% (13) |
| Unmarried: | 0.0% (0) |
Marital status - White alone, not Hispanic / Latino population 15 years and over
- Males
- 24.2%Never married
- 62.0%Now married
- 1.7%Separated
- 2.7%Widowed
- 9.4%Divorced
- Females
- 22.7%Never married
- 54.0%Now married
- 0.9%Separated
- 9.1%Widowed
- 13.4%Divorced
Women who gave birth in the past 12 months
| Now married: | 92.6% (89) |
| Unmarried: | 7.4% (7) |
Women who did not give birth in the past 12 months
| Now married: | 46.9% (636) |
| Unmarried: | 53.1% (720) |
Marital status - Hispanic or Latino population 15 years and over
- Males
- 32.6%Never married
- 54.5%Now married
- 10.4%Separated
- 0.0%Widowed
- 2.5%Divorced
- Females
- 46.6%Never married
- 46.1%Now married
- 0.0%Separated
- 2.3%Widowed
- 5.0%Divorced
Women who gave birth in the past 12 months
| Now married: | 0.0% (0) |
| Unmarried: | 100.0% (1) |
Women who did not give birth in the past 12 months
| Now married: | 43.5% (155) |
| Unmarried: | 56.5% (201) |
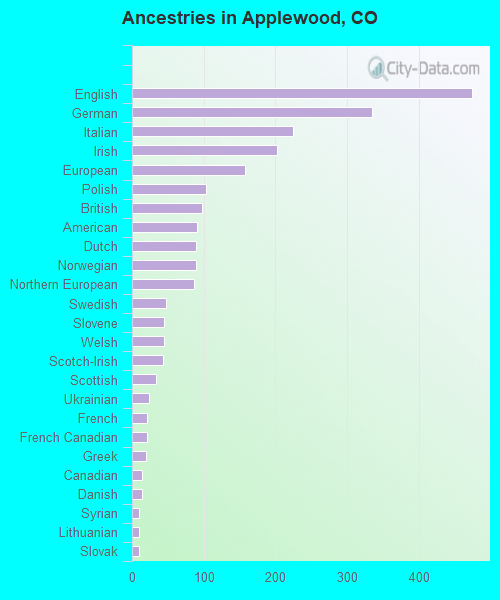
Ancestries in Applewood

- 37212.1%Irish
- 33610.9%European
- 3039.8%German
- 2849.2%American
- 2839.2%English
- 2167.0%Italian
- 983.2%Norwegian
- 832.7%Northern European
- 642.1%Celtic
- 622.0%French
- 561.8%Dutch
- 491.6%Swedish
- 471.5%Polish
- 391.3%French Canadian
- 381.2%Danish
- 280.9%Scottish
- 180.6%British
- 160.5%Eastern European
- 160.5%Lithuanian
- 160.5%Scotch-Irish
- 150.5%Slovene
- 140.5%Iraqi
- 120.4%Canadian
- 100.3%Finnish
- 100.3%Slovak
- 80.3%Ukrainian
- 80.3%Croatian
- 70.2%Lebanese
- 60.2%Scandinavian
- 60.2%Hungarian
- 60.2%Syrian
- 60.2%Russian
- 60.2%Alsatian
- 20.06%Austrian
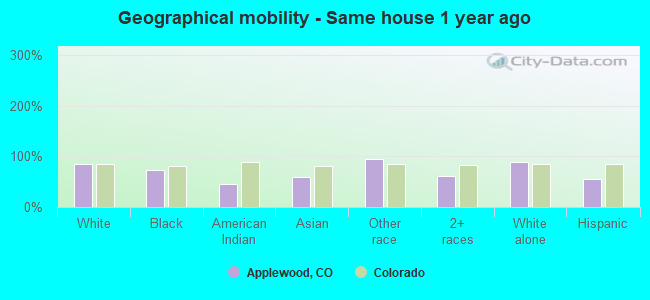
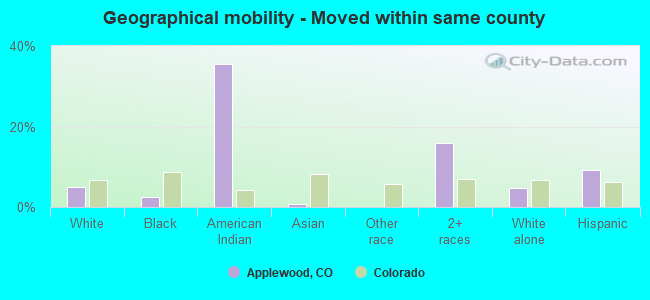
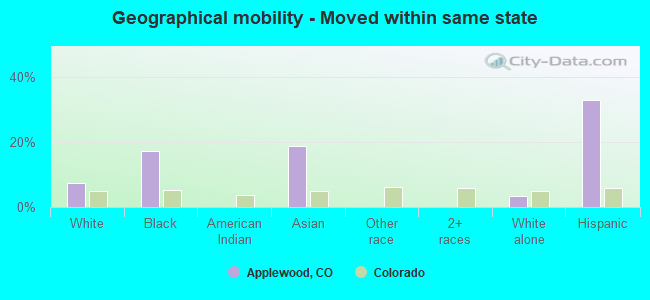
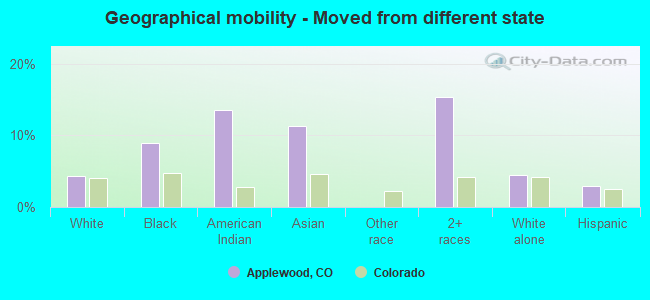
Geographical mobility in Applewood

- Same house 1 year ago
- 6,09184.1%White (Caucasian)
- 5172.5%Black or African American
- 844.6%American Indian / Alaska Native
- 8660.0%Asian
- 2794.1%Other race
- 15461.3%Two or more races
- 6,01487.9%White alone, not Hispanic / Latino
- 51155.4%Hispanic or Latino
-
- Moved within same county
- 3544.9%White / Caucasian
- 22.4%Black or African American
- 635.6%American Indian / Alaska Native
- 10.8%Asian
- 4015.8%Two or more races
- 3224.7%White alone, not Hispanic / Latino
- 849.1%Hispanic or Latino
-
- Moved within same state
- 5317.3%White / Caucasian
- 1217.3%Black or African American
- 2718.8%Asian
- 2223.2%White alone, not Hispanic / Latino
- 30533.0%Hispanic or Latino
-
- Moved from different state
- 3094.3%White / Caucasian
- 68.9%Black or African American
- 213.5%American Indian / Alaska Native
- 1611.3%Asian
- 3915.4%Two or more races
- 3034.4%White alone, not Hispanic / Latino
- 273.0%Hispanic or Latino
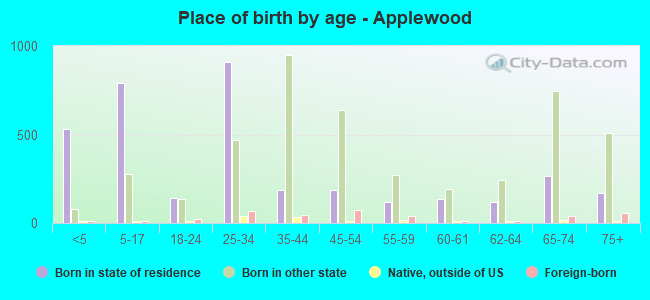
Children Nativity (place of birth) in Applewood
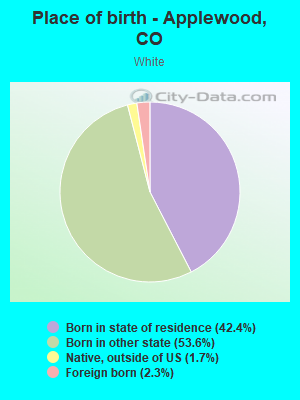
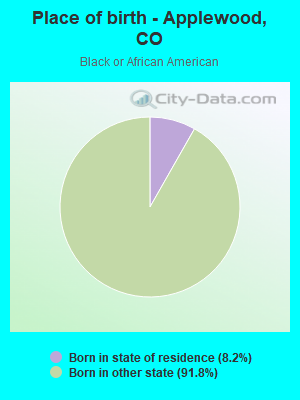
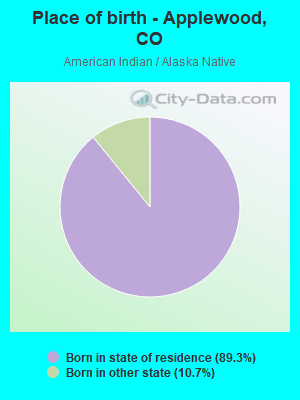
Place of birth for residents in Applewood
![Place of birth for the foreign-born population - Regions]()
- 176Americas
- 116Latin America
- 107Central America
- 91Europe
- 64Asia
- 62Northern Europe
- 59Northern America
- 53Eastern Asia
- 34China
- 29Western Europe
- 17Africa
- 17Southern Africa
- 11South Eastern Asia
- 9South America

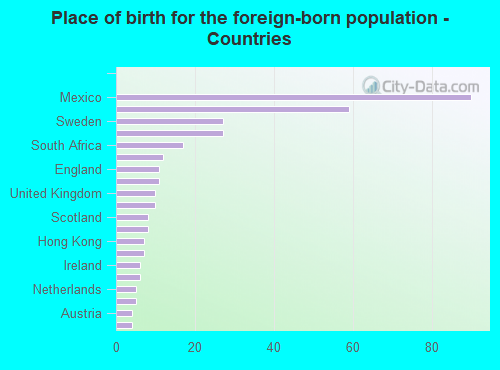
![Place of birth for the foreign-born population - Countries]()
- 90Mexico
- 59Canada
- 27Sweden
- 27China
- 17South Africa
- 12Germany
- 11England
- 11Indonesia
- 10United Kingdom
- 10Costa Rica
- 8Scotland
- 8France
- 7Hong Kong
- 7Nicaragua
- 6Ireland
- 6Japan
- 5Netherlands
- 5Chile
- 4Austria
- 4Argentina