Races in Arcadia, California (CA) Detailed Stats
Data:
Races - White alone (%)
Races - White alone (% change since 2000)
Races - Black alone (%)
Races - Black alone (% change since 2000)
Races - American Indian alone (%)
Races - American Indian alone (% change since 2000)
Races - Asian alone (%)
Races - Asian alone (% change since 2000)
Races - Hispanic (%)
Races - Hispanic (% change since 2000)
Races - Native Hawaiian and Other Pacific Islander alone (%)
Races - Native Hawaiian and Other Pacific Islander alone (% change since 2000)
Races - Two or more races(%)
Races - Two or more races(% change since 2000)
Races - Other race alone (%)
Races - Other race alone (% change since 2000)
Racial diversity
Place of birth - Born in state of residence (%)
Place of birth - Born in state of residence (%) - White
Place of birth - Born in state of residence (%) - Black or African American
Place of birth - Born in state of residence (%) - Asian
Place of birth - Born in state of residence (%) - Hispanic or Latino
Place of birth - Born in state of residence (%) - American Indian and Alaska Native
Place of birth - Born in state of residence (%) - Multirace
Place of birth - Born in state of residence (%) - Other Race
Place of birth - Born in other state (%)
Place of birth - Born in other state (%) - White
Place of birth - Born in other state (%) - Black or African American
Place of birth - Born in other state (%) - Asian
Place of birth - Born in other state (%) - Hispanic or Latino
Place of birth - Born in other state (%) - American Indian and Alaska Native
Place of birth - Born in other state (%) - Multirace
Place of birth - Born in other state (%) - Other Race
Place of birth - Native, outside of US (%)
Place of birth - Native, outside of US (%) - White
Place of birth - Native, outside of US (%) - Black or African American
Place of birth - Native, outside of US (%) - Asian
Place of birth - Native, outside of US (%) - Hispanic or Latino
Place of birth - Native, outside of US (%) - American Indian and Alaska Native
Place of birth - Native, outside of US (%) - Multirace
Place of birth - Native, outside of US (%) - Other Race
Place of birth - Foreign born (%)
Place of birth - Foreign born (%) - White
Place of birth - Foreign born (%) - Black or African American
Place of birth - Foreign born (%) - Asian
Place of birth - Foreign born (%) - Hispanic or Latino
Place of birth - Foreign born (%) - American Indian and Alaska Native
Place of birth - Foreign born (%) - Multirace
Place of birth - Foreign born (%) - Other Race
Residents speaking English at home (%)
Residents speaking English at home - Born in the United States (%)
Residents speaking English at home - Native, born elsewhere (%)
Residents speaking English at home - Foreign born (%)
Residents speaking Spanish at home (%)
Residents speaking Spanish at home - Born in the United States (%)
Residents speaking Spanish at home - Native, born elsewhere (%)
Residents speaking Spanish at home - Foreign born (%)
Residents speaking other language at home (%)
Residents speaking other language at home - Born in the United States (%)
Residents speaking other language at home - Native, born elsewhere (%)
Residents speaking other language at home - Foreign born (%)
Marital status - Never married (%)
Marital status - Now married (%)
Marital status - Separated (%)
Marital status - Widowed (%)
Marital status - Divorced (%)
Ancestries Reported - Arab (%)
Ancestries Reported - Czech (%)
Ancestries Reported - Danish (%)
Ancestries Reported - Dutch (%)
Ancestries Reported - English (%)
Ancestries Reported - French (%)
Ancestries Reported - French Canadian (%)
Ancestries Reported - German (%)
Ancestries Reported - Greek (%)
Ancestries Reported - Hungarian (%)
Ancestries Reported - Irish (%)
Ancestries Reported - Italian (%)
Ancestries Reported - Lithuanian (%)
Ancestries Reported - Norwegian (%)
Ancestries Reported - Polish (%)
Ancestries Reported - Portuguese (%)
Ancestries Reported - Russian (%)
Ancestries Reported - Scotch-Irish (%)
Ancestries Reported - Scottish (%)
Ancestries Reported - Slovak (%)
Ancestries Reported - Subsaharan African (%)
Ancestries Reported - Swedish (%)
Ancestries Reported - Swiss (%)
Ancestries Reported - Ukrainian (%)
Ancestries Reported - United States (%)
Ancestries Reported - Welsh (%)
Ancestries Reported - West Indian (%)
Ancestries Reported - Other (%)
Geographical mobility - Same house 1 year ago (%)
Geographical mobility - Same house 1 year ago (%) - White
Geographical mobility - Same house 1 year ago (%) - Black or African American
Geographical mobility - Same house 1 year ago (%) - Asian
Geographical mobility - Same house 1 year ago (%) - Hispanic or Latino
Geographical mobility - Same house 1 year ago (%) - American Indian and Alaska Native
Geographical mobility - Same house 1 year ago (%) - Multirace
Geographical mobility - Same house 1 year ago (%) - Other Race
Geographical mobility - Moved within same county (%)
Geographical mobility - Moved within same county (%) - White
Geographical mobility - Moved within same county (%) - Black or African American
Geographical mobility - Moved within same county (%) - Asian
Geographical mobility - Moved within same county (%) - Hispanic or Latino
Geographical mobility - Moved within same county (%) - American Indian and Alaska Native
Geographical mobility - Moved within same county (%) - Multirace
Geographical mobility - Moved within same county (%) - Other Race
Geographical mobility - Moved from different county within same state (%)
Geographical mobility - Moved from different county within same state (%) - White
Geographical mobility - Moved from different county within same state (%) - Black or African American
Geographical mobility - Moved from different county within same state (%) - Asian
Geographical mobility - Moved from different county within same state (%) - Hispanic or Latino
Geographical mobility - Moved from different county within same state (%) - American Indian and Alaska Native
Geographical mobility - Moved from different county within same state (%) - Multirace
Geographical mobility - Moved from different county within same state (%) - Other Race
Geographical mobility - Moved from different state (%)
Geographical mobility - Moved from different state (%) - White
Geographical mobility - Moved from different state (%) - Black or African American
Geographical mobility - Moved from different state (%) - Asian
Geographical mobility - Moved from different state (%) - Hispanic or Latino
Geographical mobility - Moved from different state (%) - American Indian and Alaska Native
Geographical mobility - Moved from different state (%) - Multirace
Geographical mobility - Moved from different state (%) - Other Race
Geographical mobility - Moved from abroad (%)
Geographical mobility - Moved from abroad (%) - White
Geographical mobility - Moved from abroad (%) - Black or African American
Geographical mobility - Moved from abroad (%) - Asian
Geographical mobility - Moved from abroad (%) - Hispanic or Latino
Geographical mobility - Moved from abroad (%) - American Indian and Alaska Native
Geographical mobility - Moved from abroad (%) - Multirace
Geographical mobility - Moved from abroad (%) - Other Race
Place of birth for the foreign-born population - Ireland (%)
Place of birth for the foreign-born population - Denmark (%)
Place of birth for the foreign-born population - Norway (%)
Place of birth for the foreign-born population - Sweden (%)
Place of birth for the foreign-born population - United Kingdom (%)
Place of birth for the foreign-born population - England (%)
Place of birth for the foreign-born population - Scotland (%)
Place of birth for the foreign-born population - Other Northern Europe (%)
Place of birth for the foreign-born population - Austria (%)
Place of birth for the foreign-born population - Belgium (%)
Place of birth for the foreign-born population - France (%)
Place of birth for the foreign-born population - Germany (%)
Place of birth for the foreign-born population - Netherlands (%)
Place of birth for the foreign-born population - Switzerland (%)
Place of birth for the foreign-born population - Other Western Europe (%)
Place of birth for the foreign-born population - Greece (%)
Place of birth for the foreign-born population - Italy (%)
Place of birth for the foreign-born population - Portugal (%)
Place of birth for the foreign-born population - Spain (%)
Place of birth for the foreign-born population - Other Southern Europe (%)
Place of birth for the foreign-born population - Albania (%)
Place of birth for the foreign-born population - Belarus (%)
Place of birth for the foreign-born population - Bosnia and Herzegovina (%)
Place of birth for the foreign-born population - Bulgaria (%)
Place of birth for the foreign-born population - Croatia (%)
Place of birth for the foreign-born population - Czechoslovakia (%)
Place of birth for the foreign-born population - Hungary (%)
Place of birth for the foreign-born population - Latvia (%)
Place of birth for the foreign-born population - Lithuania (%)
Place of birth for the foreign-born population - North Macedonia (Macedonia) (%)
Place of birth for the foreign-born population - Moldova (%)
Place of birth for the foreign-born population - Poland (%)
Place of birth for the foreign-born population - Romania (%)
Place of birth for the foreign-born population - Russia (%)
Place of birth for the foreign-born population - Serbia (%)
Place of birth for the foreign-born population - Ukraine (%)
Place of birth for the foreign-born population - Other Eastern Europe (%)
Place of birth for the foreign-born population - China (%)
Place of birth for the foreign-born population - Hong Kong (%)
Place of birth for the foreign-born population - Taiwan (%)
Place of birth for the foreign-born population - Japan (%)
Place of birth for the foreign-born population - Korea (%)
Place of birth for the foreign-born population - Other Eastern Asia (%)
Place of birth for the foreign-born population - Afghanistan (%)
Place of birth for the foreign-born population - Bangladesh (%)
Place of birth for the foreign-born population - India (%)
Place of birth for the foreign-born population - Iran (%)
Place of birth for the foreign-born population - Kazakhstan (%)
Place of birth for the foreign-born population - Nepal (%)
Place of birth for the foreign-born population - Pakistan (%)
Place of birth for the foreign-born population - Sri Lanka (%)
Place of birth for the foreign-born population - Uzbekistan (%)
Place of birth for the foreign-born population - Other South Central Asia (%)
Place of birth for the foreign-born population - Burma (%)
Place of birth for the foreign-born population - Cambodia (%)
Place of birth for the foreign-born population - Indonesia (%)
Place of birth for the foreign-born population - Laos (%)
Place of birth for the foreign-born population - Malaysia (%)
Place of birth for the foreign-born population - Philippines (%)
Place of birth for the foreign-born population - Singapore (%)
Place of birth for the foreign-born population - Thailand (%)
Place of birth for the foreign-born population - Vietnam (%)
Place of birth for the foreign-born population - Other South Eastern Asia (%)
Place of birth for the foreign-born population - Armenia (%)
Place of birth for the foreign-born population - Iraq (%)
Place of birth for the foreign-born population - Israel (%)
Place of birth for the foreign-born population - Jordan (%)
Place of birth for the foreign-born population - Kuwait (%)
Place of birth for the foreign-born population - Lebanon (%)
Place of birth for the foreign-born population - Saudi Arabia (%)
Place of birth for the foreign-born population - Syria (%)
Place of birth for the foreign-born population - Turkey (%)
Place of birth for the foreign-born population - Yemen (%)
Place of birth for the foreign-born population - Other Western Asia (%)
Place of birth for the foreign-born population - Eritrea (%)
Place of birth for the foreign-born population - Ethiopia (%)
Place of birth for the foreign-born population - Kenya (%)
Place of birth for the foreign-born population - Somalia (%)
Place of birth for the foreign-born population - Uganda (%)
Place of birth for the foreign-born population - Zimbabwe (%)
Place of birth for the foreign-born population - Other Eastern Africa (%)
Place of birth for the foreign-born population - Cameroon (%)
Place of birth for the foreign-born population - Congo (%)
Place of birth for the foreign-born population - Democratic Republic of Congo (Zaire) (%)
Place of birth for the foreign-born population - Other Middle Africa (%)
Place of birth for the foreign-born population - Egypt (%)
Place of birth for the foreign-born population - Morocco (%)
Place of birth for the foreign-born population - Sudan (%)
Place of birth for the foreign-born population - Other Northern Africa (%)
Place of birth for the foreign-born population - South Africa (%)
Place of birth for the foreign-born population - Other Southern Africa (%)
Place of birth for the foreign-born population - Cabo Verde (%)
Place of birth for the foreign-born population - Ghana (%)
Place of birth for the foreign-born population - Liberia (%)
Place of birth for the foreign-born population - Nigeria (%)
Place of birth for the foreign-born population - Senegal (%)
Place of birth for the foreign-born population - Sierra Leone (%)
Place of birth for the foreign-born population - Other Western Africa (%)
Place of birth for the foreign-born population - Australia (%)
Place of birth for the foreign-born population - New Zealand (%)
Place of birth for the foreign-born population - Fiji (%)
Place of birth for the foreign-born population - Micronesia (%)
Place of birth for the foreign-born population - Bahamas (%)
Place of birth for the foreign-born population - Barbados (%)
Place of birth for the foreign-born population - Cuba (%)
Place of birth for the foreign-born population - Dominica (%)
Place of birth for the foreign-born population - Dominican Republic (%)
Place of birth for the foreign-born population - Grenada (%)
Place of birth for the foreign-born population - Haiti (%)
Place of birth for the foreign-born population - Jamaica (%)
Place of birth for the foreign-born population - St. Vincent and the Grenadines (%)
Place of birth for the foreign-born population - Trinidad and Tobago (%)
Place of birth for the foreign-born population - West Indies (%)
Place of birth for the foreign-born population - Other Caribbean (%)
Place of birth for the foreign-born population - Belize (%)
Place of birth for the foreign-born population - Costa Rica (%)
Place of birth for the foreign-born population - El Salvador (%)
Place of birth for the foreign-born population - Guatemala (%)
Place of birth for the foreign-born population - Honduras (%)
Place of birth for the foreign-born population - Mexico (%)
Place of birth for the foreign-born population - Nicaragua (%)
Place of birth for the foreign-born population - Panama (%)
Place of birth for the foreign-born population - Other Central America (%)
Place of birth for the foreign-born population - Argentina (%)
Place of birth for the foreign-born population - Bolivia (%)
Place of birth for the foreign-born population - Brazil (%)
Place of birth for the foreign-born population - Chile (%)
Place of birth for the foreign-born population - Colombia (%)
Place of birth for the foreign-born population - Ecuador (%)
Place of birth for the foreign-born population - Guyana (%)
Place of birth for the foreign-born population - Peru (%)
Place of birth for the foreign-born population - Uruguay (%)
Place of birth for the foreign-born population - Venezuela (%)
Place of birth for the foreign-born population - Other South America (%)
Place of birth for the foreign-born population - Canada (%)
Place of birth for the foreign-born population - Other Northern America (%)
Place of birth for the foreign-born population - Other (%)
Latest news about races in Arcadia, CA collected exclusively by city-data.com from local newspapers, TV, and radio stations
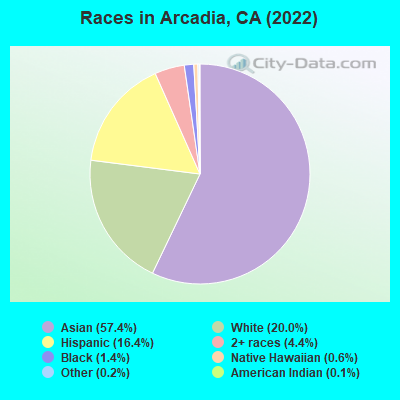
According to 2022 data, the most numerous races in Arcadia, CA are Hispanic (6,566 residents), White alone (11,987 residents), and Asian alone (37,385 residents). 37.9% of Arcadia residents speak English at home. 49.7% of Arcadia, CA residents are foreign-born (43.7% born in Asia), which is 47.7% greater than the foreign-born rate of 26.0% across the entire state of California.
Race distribution in Arcadia
2000 2022
15,816,790 46.7% White alone 10,966,556 32.4% Hispanic 3,648,860 10.8% Asian alone 2,181,926 6.4% Black alone 903,115 2.7% Two or more races 178,984 0.5% American Indian alone 103,736 0.3% Native Hawaiian and Other 71,681 0.2% Other race alone
15,732,184 40.3% Hispanic 13,160,426 33.7% White alone 5,957,867 15.3% Asian alone 2,025,218 5.2% Black alone 1,663,222 4.3% Two or more races 251,618 0.6% Other race alone 135,777 0.3% Native Hawaiian and Other 103,030 0.3% American Indian alone
Income and house value in Arcadia Median household income in 2022 $113,100 White non-Hispanic householders$65,562 Black householders$115,019 American Indian and Alaska Native householders$133,431 Asian householdersover $200,000 Native Hawaiian and other Pacific Islander householders$124,990 Some other race householders$115,537 Two or more races householders$106,705 Hispanic or Latino race householdersMedian 2022 house value over $1,000,000 White Non-Hispanic householders$839,715 Black or African American householders$517,578 American Indian or Alaska Native householders over $1,000,000 Asian householders$526,577 Native Hawaiian and other Pacific Islander householdersover $1,000,000 Some other race householdersover $1,000,000 Two or more races householdersover $1,000,000 Hispanic or Latino householders
Median age by race in Arcadia
54.0 Median age for White residents51.5 57.3 31.4 Median age for Black or African American residents28.8 41.0 68.3 Median age for American Indian / Alaska Native residents44.6 Median age for Asian residents41.8 46.2 52.5 Median age for Native Hawaiian / Pacific Islander residents48.5 60.2 39.5 Median age for Other race residents39.6 39.4 32.9 Median age for Two or more races residents32.0 35.2 56.5 Median age for White alone residents52.7 60.2 36.9 Median age for Hispanic or Latino residents31.5 38.1
Owner/renter occupied households by race in Arcadia
House owners and renters - White residents 3,074 53.5% Owner occupied2,668 46.5% Renter occupiedHouse owners and renters - Black or African American residents 35 9.6% Owner occupied333 90.4% Renter occupiedHouse owners and renters - American Indian / Alaska Native residents 43 64.6% Owner occupied23 35.4% Renter occupiedHouse owners and renters - Asian residents 8,783 69.7% Owner occupied3,826 30.3% Renter occupiedHouse owners and renters - Native Hawaiian / Pacific Islander residents 73 69.3% Owner occupied33 30.7% Renter occupiedHouse owners and renters - Other race residents 145 17.6% Owner occupied679 82.4% Renter occupiedHouse owners and renters - Two or more races residents 597 48.6% Owner occupied630 51.4% Renter occupiedHouse owners and renters - White alone residents 2,934 55.1% Owner occupied2,390 44.9% Renter occupiedHouse owners and renters - Hispanic or Latino residents 523 27.6% Owner occupied1,373 72.4% Renter occupied
Language usage in Arcadia
English speakers - Total 37.9% of residents of Arcadia speak English at home.
6.4% of residents speak Spanish at home 2,807 78.6% Speak English very well763 21.4% Speak English less than very well56.2% of residents speak other language at home 15,445 49.4% Speak English very well15,806 50.6% Speak English less than very well
English speakers - Born in the United States 83.0% of residents of Arcadia speak English at home.
4.8% of residents speak Spanish at home 205 74.8% Speak English very well69 25.2% Speak English less than very well12.9% of residents speak other language at home 639 87.1% Speak English very well95 12.9% Speak English less than very well
English speakers - Native, born elsewhere 31.7% of residents of Arcadia speak English at home.
7.3% of residents speak Spanish at home 37 67.3% Speak English very well18 32.7% Speak English less than very well58.3% of residents speak other language at home 298 67.6% Speak English very well143 32.4% Speak English less than very well
English speakers - Foreign-born 9.4% of residents of Arcadia speak English at home.
4.2% of residents speak Spanish at home 649 55.0% Speak English very well530 45.0% Speak English less than very well88.1% of residents speak other language at home 9,838 39.8% Speak English very well14,862 60.2% Speak English less than very well
White (Caucasian) - Speak only English Native:
91.2% (10,279)Foreign-born:
29.8% (529)
White (Caucasian) - Speak another language Native:
9.9% (1,116)Foreign-born:
73.3% (1,302)
Black or African American - Speak only English Native:
95.4% (921)Foreign-born:
80.6% (98)
Black or African American - Speak another language Native:
4.3% (42)Foreign-born:
8.6% (10)
Asian - Speak only English Native:
42.2% (4,583)Foreign-born:
7.1% (1,749)
Asian - Speak another language Native:
56.8% (6,169)Foreign-born:
92.5% (22,946)
Native Hawaiian / Pacific Islander - Speak another language Native:
7.7% (7)Foreign-born:
97.0% (100)
Other race - Speak only English Native:
53.8% (1,150)Foreign-born:
12.8% (57)
Other race - Speak another language Native:
49.6% (1,061)Foreign-born:
89.1% (396)
Two or more races - Speak only English Native:
64.6% (2,167)Foreign-born:
10.6% (288)
Two or more races - Speak another language Native:
34.1% (1,144)Foreign-born:
88.3% (2,410)
White alone - Speak only English Native:
95.6% (9,204)Foreign-born:
27.2% (525)
White alone - Speak another language Native:
4.3% (416)Foreign-born:
72.8% (1,406)
Hispanic or Latino - Speak only English Native:
56.2% (2,910)Foreign-born:
10.4% (119)
Hispanic or Latino - Speak another language Native:
45.2% (2,340)Foreign-born:
90.6% (1,034)
Foreign-born residents in Arcadia 28,832 residents are foreign born (43.7% Asia ).
This city:
49.7%California:
100.0%
Marital status for residents in Arcadia Marital status - White (Caucasian) population 15 years and over
Males 26.9% Never married57.8% Now married1.0% Separated2.8% Widowed11.5% DivorcedFemales 25.7% Never married45.8% Now married0.8% Separated13.9% Widowed13.9% DivorcedWomen who gave birth in the past 12 months Now married:
89.6% (127)Unmarried:
10.4% (15)
Women who did not give birth in the past 12 months Now married:
38.9% (845)Unmarried:
61.1% (1,327)
Marital status - Black or African American population 15 years and over
Males 41.2% Never married37.2% Now married3.4% Separated3.6% Widowed14.5% DivorcedFemales 26.7% Never married36.6% Now married7.1% Separated19.4% Widowed10.2% DivorcedWomen who did not give birth in the past 12 months Now married:
53.4% (110)Unmarried:
46.6% (96)
Marital status - American Indian / Alaska Native population 15 years and over
Males 65.2% Never married34.8% Now married0.0% Separated0.0% Widowed0.0% DivorcedFemales 68.2% Never married31.8% Now married0.0% Separated0.0% Widowed0.0% DivorcedMarital status - Asian population 15 years and over
Males 31.6% Never married64.7% Now married0.9% Separated1.1% Widowed1.8% DivorcedFemales 23.8% Never married59.9% Now married1.4% Separated7.3% Widowed7.6% DivorcedWomen who gave birth in the past 12 months Now married:
89.1% (310)Unmarried:
10.9% (38)
Women who did not give birth in the past 12 months Now married:
55.1% (4,578)Unmarried:
44.9% (3,725)
Marital status - Native Hawaiian / Pacific Islander population 15 years and over
Males 58.2% Never married20.9% Now married0.0% Separated0.0% Widowed20.9% DivorcedFemales 39.3% Never married32.8% Now married9.0% Separated0.0% Widowed18.9% DivorcedWomen who did not give birth in the past 12 months Now married:
33.3% (23)Unmarried:
66.7% (46)
Marital status - Other race population 15 years and over
Males 34.1% Never married54.4% Now married0.0% Separated0.0% Widowed11.5% DivorcedFemales 41.9% Never married37.8% Now married5.0% Separated3.8% Widowed11.5% DivorcedWomen who gave birth in the past 12 months Now married:
100.0% (29)Unmarried:
0.0% (0)
Women who did not give birth in the past 12 months Now married:
38.1% (299)Unmarried:
61.9% (487)
Marital status - Two or more races population 15 years and over
Males 53.1% Never married39.9% Now married3.9% Separated0.0% Widowed3.1% DivorcedFemales 54.2% Never married35.4% Now married0.0% Separated7.2% Widowed3.2% DivorcedWomen who gave birth in the past 12 months Now married:
0.0% (0)Unmarried:
100.0% (38)
Women who did not give birth in the past 12 months Now married:
25.7% (306)Unmarried:
74.3% (882)
Marital status - White alone, not Hispanic / Latino population 15 years and over
Males 22.5% Never married63.1% Now married0.9% Separated3.2% Widowed10.3% DivorcedFemales 21.5% Never married50.3% Now married0.8% Separated14.5% Widowed12.9% DivorcedWomen who gave birth in the past 12 months Now married:
100.0% (89)Unmarried:
0.0% (0)
Women who did not give birth in the past 12 months Now married:
48.2% (808)Unmarried:
51.8% (869)
Marital status - Hispanic or Latino population 15 years and over
Males 42.0% Never married42.1% Now married2.0% Separated0.3% Widowed13.7% DivorcedFemales 42.1% Never married31.6% Now married2.7% Separated8.8% Widowed14.9% DivorcedWomen who gave birth in the past 12 months Now married:
82.9% (92)Unmarried:
17.1% (19)
Women who did not give birth in the past 12 months Now married:
27.3% (468)Unmarried:
72.7% (1,245)
Ancestries in Arcadia
563 1.3% European548 1.3% Italian548 1.3% English455 1.1% Armenian445 1.1% Irish444 1.1% American427 1.0% German336 0.8% Egyptian167 0.4% Syrian164 0.4% Iranian138 0.3% Bulgarian131 0.3% Brazilian116 0.3% Lebanese114 0.3% Scandinavian114 0.3% Welsh105 0.2% French96 0.2% British94 0.2% Russian84 0.2% Scottish80 0.2% Canadian78 0.2% Norwegian70 0.2% Polish56 0.1% Swedish50 0.1% Dutch45 0.1% Hungarian43 0.1% Scotch-Irish42 0.10% Ugandan35 0.08% Northern European30 0.07% Eastern European29 0.07% Ukrainian28 0.07% Trinidadian and Tobagonian23 0.05% Greek21 0.05% Ethiopian18 0.04% Danish17 0.04% Croatian17 0.04% Portuguese16 0.04% Austrian15 0.04% African11 0.03% Serbian11 0.03% Jamaican9 0.02% Celtic8 0.02% Palestinian8 0.02% Slovak8 0.02% Finnish7 0.02% Slovene6 0.01% Belgian5 0.01% Lithuanian5 0.01% Czech5 0.01% French Canadian
Geographical mobility in Arcadia Same house 1 year ago 12,314 91.9% White (Caucasian)995 91.4% Black or African American102 100.0% American Indian / Alaska Native33,761 90.7% Asian145 75.6% Native Hawaiian / Pacific Islander2,563 97.7% Other race5,465 98.2% Two or more races11,170 92.4% White alone, not Hispanic / Latino6,026 92.8% Hispanic or LatinoMoved within same county 648 4.8% White / Caucasian64 5.8% Black or African American2,237 6.0% Asian82 3.1% Other race236 4.2% Two or more races505 4.2% White alone, not Hispanic / Latino370 5.7% Hispanic or LatinoMoved within same state 265 2.0% White / Caucasian16 1.4% Black or African American207 0.6% Asian7 0.3% Other race29 0.5% Two or more races301 2.5% White alone, not Hispanic / Latino52 0.8% Hispanic or LatinoMoved from different state 110 0.8% White / Caucasian277 0.7% Asian16 8.5% Native Hawaiian / Pacific Islander93 0.8% White alone, not Hispanic / Latino25 0.4% Hispanic or LatinoMoved from abroad 78 0.6% White21 1.9% Black or African American653 1.8% Asian36 18.7% Native Hawaiian / Pacific Islander18 0.3% Two or more races80 0.7% White alone, not Hispanic / Latino33 0.5% Hispanic or Latino
Children Nativity (place of birth) in Arcadia
Children under 6 years - Living with two parents Both parents native 772 99.8% Native2 0.2% Foreign-bornBoth parents foreign-born 1,029 87.5% Native147 12.5% Foreign-bornOne native, one foreign-born parent 465 100.0% NativeChildren under 6 years - Living with one parent Native parent 262 99.9% Native0 0.1% Foreign-bornForeign-born parent 324 98.0% Native6 2.0% Foreign-bornChildren 6 to 17 years - Living with two parents Both parents native 1,592 99.7% Native4 0.3% Foreign-bornBoth parents foreign-born 3,044 80.8% Native722 19.2% Foreign-bornOne native, one foreign-born parent 1,187 97.9% Native26 2.1% Foreign-bornChildren 6 to 17 years - Living with one parent Native parent 539 100.0% NativeForeign-born parent 1,087 60.5% Native710 39.5% Foreign-born
Place of birth for residents in Arcadia 25,761 Asia18,794 Eastern Asia17,443 China4,624 South Eastern Asia1,872 South Central Asia1,767 Americas1,610 Latin America983 Central America930 Europe476 South America454 Western Asia307 Eastern Europe250 Africa226 Southern Europe207 Western Europe188 Northern Europe183 Northern Africa156 Northern America150 Caribbean122 Oceania49 Eastern Africa9 Western Africa8 Middle Africa7 Australia and New Zealand Subregion10,385 China5,341 Taiwan1,715 Hong Kong1,597 Philippines1,401 Vietnam1,373 India1,015 Korea763 Mexico486 Indonesia400 Burma383 Thailand363 Iran329 Japan182 Egypt156 Canada151 Bulgaria144 El Salvador143 Peru130 Singapore125 Colombia122 Italy115 Lebanon115 Fiji113 France112 Saudi Arabia106 Argentina106 Malaysia98 Spain93 Cambodia90 Brazil82 Syria68 Armenia67 Trinidad and Tobago63 Germany61 Pakistan56 England50 United Kingdom49 Sri Lanka48 Russia45 Guatemala44 Cuba33 Belarus30 Uganda29 Hungary28 West Indies25 Laos23 Bangladesh22 Ireland22 Nicaragua21 Sweden19 Ethiopia17 Denmark14 Poland13 Scotland12 Austria11 Moldova11 Netherlands10 Czechoslovakia10 Iraq10 Israel10 Jamaica10 Uruguay9 Croatia9 Ghana8 Jordan7 Belgium7 Australia7 Norway7 Panama6 Greece1 Nepal1 Sudan
Grandparents responsible for own grandchildren in Arcadia
Grandparents (30 to 59 years) White / Caucasian 15 100.0% Not responsible for grandchildrenAsian 53 43.0% Responsible for grandchildren70 57.0% Not responsible for grandchildrenTwo or more races 32 100.0% Not responsible for grandchildrenHispanic or Latino 23 100.0% Not responsible for grandchildrenGrandparents (60 years and over) White / Caucasian 94 41.2% Responsible for grandchildren134 58.8% Not responsible for grandchildrenAsian 193 16.9% Responsible for grandchildren948 83.1% Not responsible for grandchildrenHispanic or Latino 15 16.9% Responsible for grandchildren73 83.1% Not responsible for grandchildren