Races in Arden Hills, Minnesota (MN) Detailed Stats
Data:
Races - White alone (%)
Races - White alone (% change since 2000)
Races - Black alone (%)
Races - Black alone (% change since 2000)
Races - American Indian alone (%)
Races - American Indian alone (% change since 2000)
Races - Asian alone (%)
Races - Asian alone (% change since 2000)
Races - Hispanic (%)
Races - Hispanic (% change since 2000)
Races - Native Hawaiian and Other Pacific Islander alone (%)
Races - Native Hawaiian and Other Pacific Islander alone (% change since 2000)
Races - Two or more races(%)
Races - Two or more races(% change since 2000)
Races - Other race alone (%)
Races - Other race alone (% change since 2000)
Racial diversity
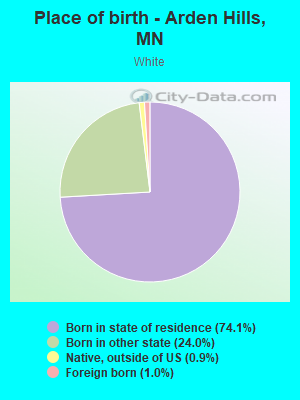
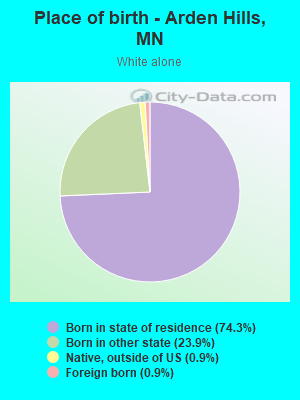
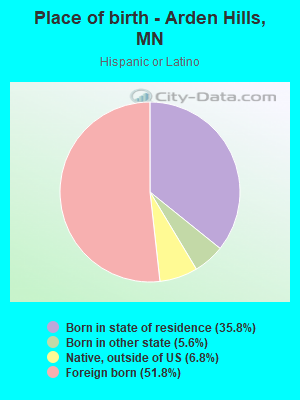
Place of birth - Born in state of residence (%)
Place of birth - Born in state of residence (%) - White
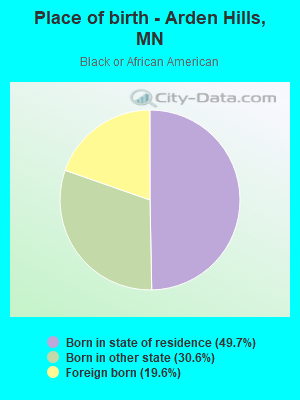
Place of birth - Born in state of residence (%) - Black or African American
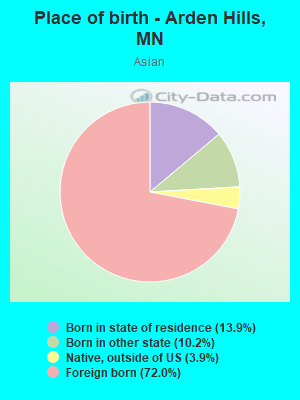
Place of birth - Born in state of residence (%) - Asian
Place of birth - Born in state of residence (%) - Hispanic or Latino
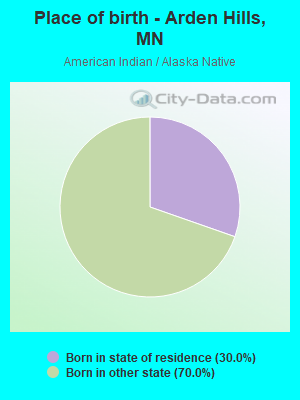
Place of birth - Born in state of residence (%) - American Indian and Alaska Native
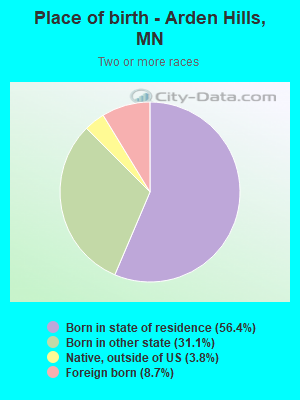
Place of birth - Born in state of residence (%) - Multirace
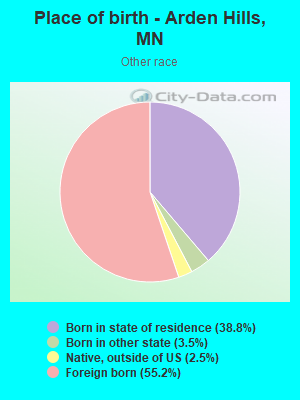
Place of birth - Born in state of residence (%) - Other Race
Place of birth - Born in other state (%)
Place of birth - Born in other state (%) - White
Place of birth - Born in other state (%) - Black or African American
Place of birth - Born in other state (%) - Asian
Place of birth - Born in other state (%) - Hispanic or Latino
Place of birth - Born in other state (%) - American Indian and Alaska Native
Place of birth - Born in other state (%) - Multirace
Place of birth - Born in other state (%) - Other Race
Place of birth - Native, outside of US (%)
Place of birth - Native, outside of US (%) - White
Place of birth - Native, outside of US (%) - Black or African American
Place of birth - Native, outside of US (%) - Asian
Place of birth - Native, outside of US (%) - Hispanic or Latino
Place of birth - Native, outside of US (%) - American Indian and Alaska Native
Place of birth - Native, outside of US (%) - Multirace
Place of birth - Native, outside of US (%) - Other Race
Place of birth - Foreign born (%)
Place of birth - Foreign born (%) - White
Place of birth - Foreign born (%) - Black or African American
Place of birth - Foreign born (%) - Asian
Place of birth - Foreign born (%) - Hispanic or Latino
Place of birth - Foreign born (%) - American Indian and Alaska Native
Place of birth - Foreign born (%) - Multirace
Place of birth - Foreign born (%) - Other Race
Residents speaking English at home (%)
Residents speaking English at home - Born in the United States (%)
Residents speaking English at home - Native, born elsewhere (%)
Residents speaking English at home - Foreign born (%)
Residents speaking Spanish at home (%)
Residents speaking Spanish at home - Born in the United States (%)
Residents speaking Spanish at home - Native, born elsewhere (%)
Residents speaking Spanish at home - Foreign born (%)
Residents speaking other language at home (%)
Residents speaking other language at home - Born in the United States (%)
Residents speaking other language at home - Native, born elsewhere (%)
Residents speaking other language at home - Foreign born (%)
Marital status - Never married (%)
Marital status - Now married (%)
Marital status - Separated (%)
Marital status - Widowed (%)
Marital status - Divorced (%)
Ancestries Reported - Arab (%)
Ancestries Reported - Czech (%)
Ancestries Reported - Danish (%)
Ancestries Reported - Dutch (%)
Ancestries Reported - English (%)
Ancestries Reported - French (%)
Ancestries Reported - French Canadian (%)
Ancestries Reported - German (%)
Ancestries Reported - Greek (%)
Ancestries Reported - Hungarian (%)
Ancestries Reported - Irish (%)
Ancestries Reported - Italian (%)
Ancestries Reported - Lithuanian (%)
Ancestries Reported - Norwegian (%)
Ancestries Reported - Polish (%)
Ancestries Reported - Portuguese (%)
Ancestries Reported - Russian (%)
Ancestries Reported - Scotch-Irish (%)
Ancestries Reported - Scottish (%)
Ancestries Reported - Slovak (%)
Ancestries Reported - Subsaharan African (%)
Ancestries Reported - Swedish (%)
Ancestries Reported - Swiss (%)
Ancestries Reported - Ukrainian (%)
Ancestries Reported - United States (%)
Ancestries Reported - Welsh (%)
Ancestries Reported - West Indian (%)
Ancestries Reported - Other (%)
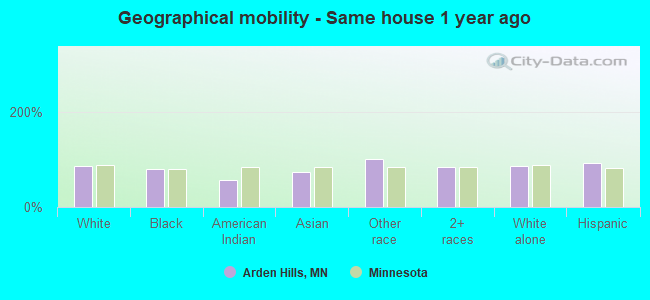
Geographical mobility - Same house 1 year ago (%)
Geographical mobility - Same house 1 year ago (%) - White
Geographical mobility - Same house 1 year ago (%) - Black or African American
Geographical mobility - Same house 1 year ago (%) - Asian
Geographical mobility - Same house 1 year ago (%) - Hispanic or Latino
Geographical mobility - Same house 1 year ago (%) - American Indian and Alaska Native
Geographical mobility - Same house 1 year ago (%) - Multirace
Geographical mobility - Same house 1 year ago (%) - Other Race
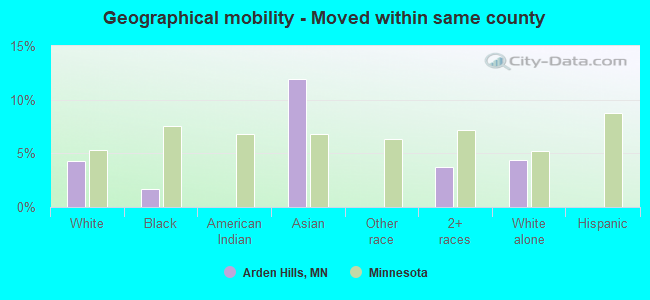
Geographical mobility - Moved within same county (%)
Geographical mobility - Moved within same county (%) - White
Geographical mobility - Moved within same county (%) - Black or African American
Geographical mobility - Moved within same county (%) - Asian
Geographical mobility - Moved within same county (%) - Hispanic or Latino
Geographical mobility - Moved within same county (%) - American Indian and Alaska Native
Geographical mobility - Moved within same county (%) - Multirace
Geographical mobility - Moved within same county (%) - Other Race
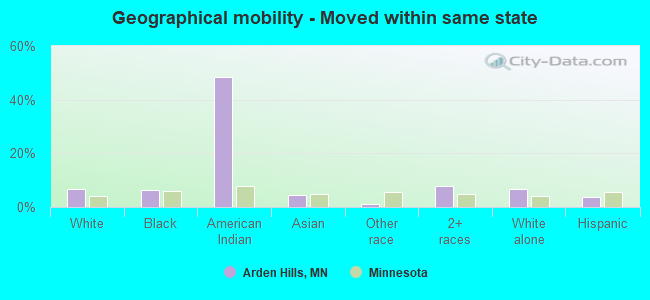
Geographical mobility - Moved from different county within same state (%)
Geographical mobility - Moved from different county within same state (%) - White
Geographical mobility - Moved from different county within same state (%) - Black or African American
Geographical mobility - Moved from different county within same state (%) - Asian
Geographical mobility - Moved from different county within same state (%) - Hispanic or Latino
Geographical mobility - Moved from different county within same state (%) - American Indian and Alaska Native
Geographical mobility - Moved from different county within same state (%) - Multirace
Geographical mobility - Moved from different county within same state (%) - Other Race
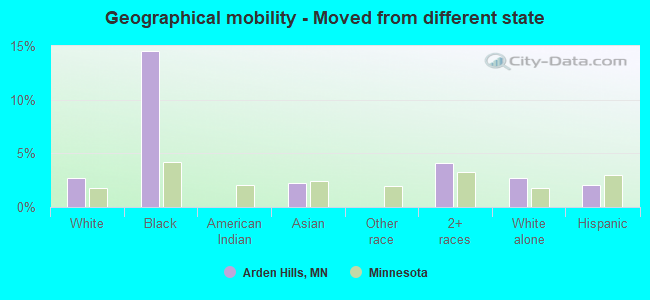
Geographical mobility - Moved from different state (%)
Geographical mobility - Moved from different state (%) - White
Geographical mobility - Moved from different state (%) - Black or African American
Geographical mobility - Moved from different state (%) - Asian
Geographical mobility - Moved from different state (%) - Hispanic or Latino
Geographical mobility - Moved from different state (%) - American Indian and Alaska Native
Geographical mobility - Moved from different state (%) - Multirace
Geographical mobility - Moved from different state (%) - Other Race
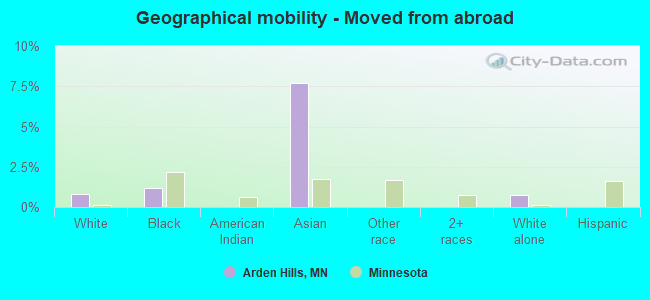
Geographical mobility - Moved from abroad (%)
Geographical mobility - Moved from abroad (%) - White
Geographical mobility - Moved from abroad (%) - Black or African American
Geographical mobility - Moved from abroad (%) - Asian
Geographical mobility - Moved from abroad (%) - Hispanic or Latino
Geographical mobility - Moved from abroad (%) - American Indian and Alaska Native
Geographical mobility - Moved from abroad (%) - Multirace
Geographical mobility - Moved from abroad (%) - Other Race
Place of birth for the foreign-born population - Ireland (%)
Place of birth for the foreign-born population - Denmark (%)
Place of birth for the foreign-born population - Norway (%)
Place of birth for the foreign-born population - Sweden (%)
Place of birth for the foreign-born population - United Kingdom (%)
Place of birth for the foreign-born population - England (%)
Place of birth for the foreign-born population - Scotland (%)
Place of birth for the foreign-born population - Other Northern Europe (%)
Place of birth for the foreign-born population - Austria (%)
Place of birth for the foreign-born population - Belgium (%)
Place of birth for the foreign-born population - France (%)
Place of birth for the foreign-born population - Germany (%)
Place of birth for the foreign-born population - Netherlands (%)
Place of birth for the foreign-born population - Switzerland (%)
Place of birth for the foreign-born population - Other Western Europe (%)
Place of birth for the foreign-born population - Greece (%)
Place of birth for the foreign-born population - Italy (%)
Place of birth for the foreign-born population - Portugal (%)
Place of birth for the foreign-born population - Spain (%)
Place of birth for the foreign-born population - Other Southern Europe (%)
Place of birth for the foreign-born population - Albania (%)
Place of birth for the foreign-born population - Belarus (%)
Place of birth for the foreign-born population - Bosnia and Herzegovina (%)
Place of birth for the foreign-born population - Bulgaria (%)
Place of birth for the foreign-born population - Croatia (%)
Place of birth for the foreign-born population - Czechoslovakia (%)
Place of birth for the foreign-born population - Hungary (%)
Place of birth for the foreign-born population - Latvia (%)
Place of birth for the foreign-born population - Lithuania (%)
Place of birth for the foreign-born population - North Macedonia (Macedonia) (%)
Place of birth for the foreign-born population - Moldova (%)
Place of birth for the foreign-born population - Poland (%)
Place of birth for the foreign-born population - Romania (%)
Place of birth for the foreign-born population - Russia (%)
Place of birth for the foreign-born population - Serbia (%)
Place of birth for the foreign-born population - Ukraine (%)
Place of birth for the foreign-born population - Other Eastern Europe (%)
Place of birth for the foreign-born population - China (%)
Place of birth for the foreign-born population - Hong Kong (%)
Place of birth for the foreign-born population - Taiwan (%)
Place of birth for the foreign-born population - Japan (%)
Place of birth for the foreign-born population - Korea (%)
Place of birth for the foreign-born population - Other Eastern Asia (%)
Place of birth for the foreign-born population - Afghanistan (%)
Place of birth for the foreign-born population - Bangladesh (%)
Place of birth for the foreign-born population - India (%)
Place of birth for the foreign-born population - Iran (%)
Place of birth for the foreign-born population - Kazakhstan (%)
Place of birth for the foreign-born population - Nepal (%)
Place of birth for the foreign-born population - Pakistan (%)
Place of birth for the foreign-born population - Sri Lanka (%)
Place of birth for the foreign-born population - Uzbekistan (%)
Place of birth for the foreign-born population - Other South Central Asia (%)
Place of birth for the foreign-born population - Burma (%)
Place of birth for the foreign-born population - Cambodia (%)
Place of birth for the foreign-born population - Indonesia (%)
Place of birth for the foreign-born population - Laos (%)
Place of birth for the foreign-born population - Malaysia (%)
Place of birth for the foreign-born population - Philippines (%)
Place of birth for the foreign-born population - Singapore (%)
Place of birth for the foreign-born population - Thailand (%)
Place of birth for the foreign-born population - Vietnam (%)
Place of birth for the foreign-born population - Other South Eastern Asia (%)
Place of birth for the foreign-born population - Armenia (%)
Place of birth for the foreign-born population - Iraq (%)
Place of birth for the foreign-born population - Israel (%)
Place of birth for the foreign-born population - Jordan (%)
Place of birth for the foreign-born population - Kuwait (%)
Place of birth for the foreign-born population - Lebanon (%)
Place of birth for the foreign-born population - Saudi Arabia (%)
Place of birth for the foreign-born population - Syria (%)
Place of birth for the foreign-born population - Turkey (%)
Place of birth for the foreign-born population - Yemen (%)
Place of birth for the foreign-born population - Other Western Asia (%)
Place of birth for the foreign-born population - Eritrea (%)
Place of birth for the foreign-born population - Ethiopia (%)
Place of birth for the foreign-born population - Kenya (%)
Place of birth for the foreign-born population - Somalia (%)
Place of birth for the foreign-born population - Uganda (%)
Place of birth for the foreign-born population - Zimbabwe (%)
Place of birth for the foreign-born population - Other Eastern Africa (%)
Place of birth for the foreign-born population - Cameroon (%)
Place of birth for the foreign-born population - Congo (%)
Place of birth for the foreign-born population - Democratic Republic of Congo (Zaire) (%)
Place of birth for the foreign-born population - Other Middle Africa (%)
Place of birth for the foreign-born population - Egypt (%)
Place of birth for the foreign-born population - Morocco (%)
Place of birth for the foreign-born population - Sudan (%)
Place of birth for the foreign-born population - Other Northern Africa (%)
Place of birth for the foreign-born population - South Africa (%)
Place of birth for the foreign-born population - Other Southern Africa (%)
Place of birth for the foreign-born population - Cabo Verde (%)
Place of birth for the foreign-born population - Ghana (%)
Place of birth for the foreign-born population - Liberia (%)
Place of birth for the foreign-born population - Nigeria (%)
Place of birth for the foreign-born population - Senegal (%)
Place of birth for the foreign-born population - Sierra Leone (%)
Place of birth for the foreign-born population - Other Western Africa (%)
Place of birth for the foreign-born population - Australia (%)
Place of birth for the foreign-born population - New Zealand (%)
Place of birth for the foreign-born population - Fiji (%)
Place of birth for the foreign-born population - Micronesia (%)
Place of birth for the foreign-born population - Bahamas (%)
Place of birth for the foreign-born population - Barbados (%)
Place of birth for the foreign-born population - Cuba (%)
Place of birth for the foreign-born population - Dominica (%)
Place of birth for the foreign-born population - Dominican Republic (%)
Place of birth for the foreign-born population - Grenada (%)
Place of birth for the foreign-born population - Haiti (%)
Place of birth for the foreign-born population - Jamaica (%)
Place of birth for the foreign-born population - St. Vincent and the Grenadines (%)
Place of birth for the foreign-born population - Trinidad and Tobago (%)
Place of birth for the foreign-born population - West Indies (%)
Place of birth for the foreign-born population - Other Caribbean (%)
Place of birth for the foreign-born population - Belize (%)
Place of birth for the foreign-born population - Costa Rica (%)
Place of birth for the foreign-born population - El Salvador (%)
Place of birth for the foreign-born population - Guatemala (%)
Place of birth for the foreign-born population - Honduras (%)
Place of birth for the foreign-born population - Mexico (%)
Place of birth for the foreign-born population - Nicaragua (%)
Place of birth for the foreign-born population - Panama (%)
Place of birth for the foreign-born population - Other Central America (%)
Place of birth for the foreign-born population - Argentina (%)
Place of birth for the foreign-born population - Bolivia (%)
Place of birth for the foreign-born population - Brazil (%)
Place of birth for the foreign-born population - Chile (%)
Place of birth for the foreign-born population - Colombia (%)
Place of birth for the foreign-born population - Ecuador (%)
Place of birth for the foreign-born population - Guyana (%)
Place of birth for the foreign-born population - Peru (%)
Place of birth for the foreign-born population - Uruguay (%)
Place of birth for the foreign-born population - Venezuela (%)
Place of birth for the foreign-born population - Other South America (%)
Place of birth for the foreign-born population - Canada (%)
Place of birth for the foreign-born population - Other Northern America (%)
Place of birth for the foreign-born population - Other (%)
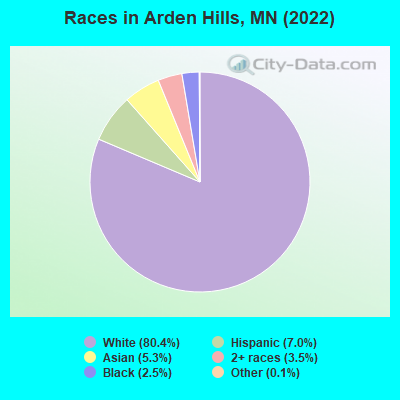
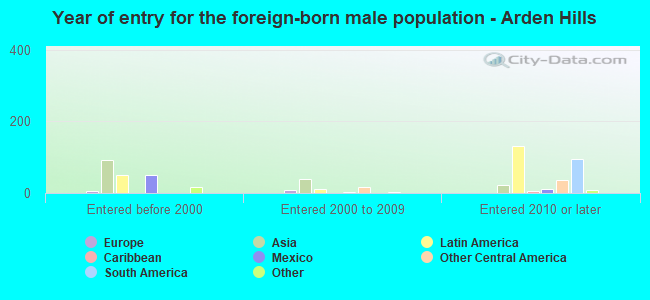
According to 2022 data, the most numerous races in Arden Hills, MN are White alone (7,727 residents), Black alone (245 residents), and Hispanic (672 residents). 88.3% of Arden Hills residents speak English at home. 9.0% of Arden Hills, MN residents are foreign-born (3.9% born in Asia, 3.6% born in Latin America), which is 11.2% greater than the foreign-born rate of 8.0% across the entire state of Minnesota.
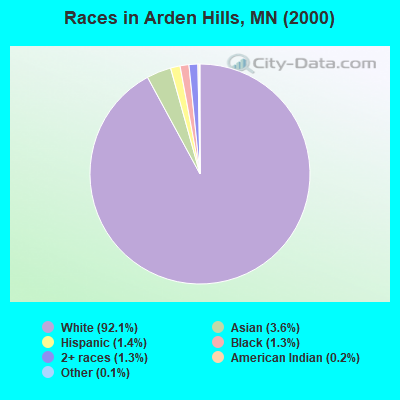
Race distribution in Arden Hills
2000 2022
4,337,143 88.2% White alone 168,813 3.4% Black alone 143,382 2.9% Hispanic 141,083 2.9% Asian alone 70,304 1.4% Two or more races 52,009 1.1% American Indian alone 5,031 0.1% Other race alone 1,714 0.03% Native Hawaiian and Other
4,356,347 76.2% White alone 395,179 6.9% Black alone 333,830 5.8% Hispanic 294,800 5.2% Asian alone 259,649 4.5% Two or more races 42,125 0.7% American Indian alone 32,976 0.6% Other race alone 2,278 0.04% Native Hawaiian and Other
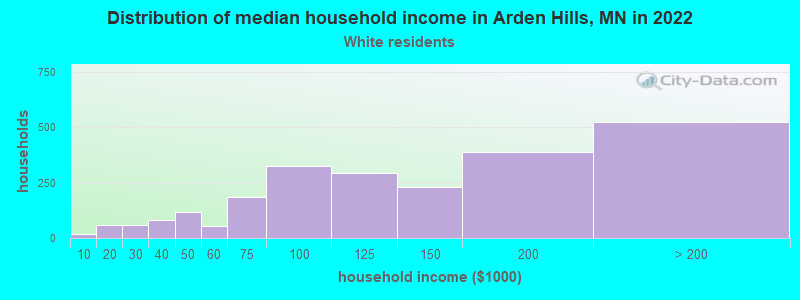
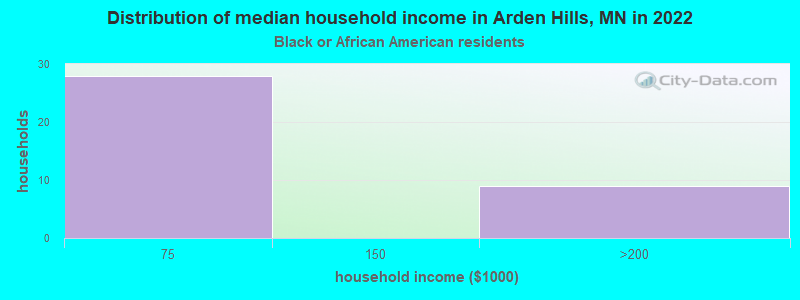
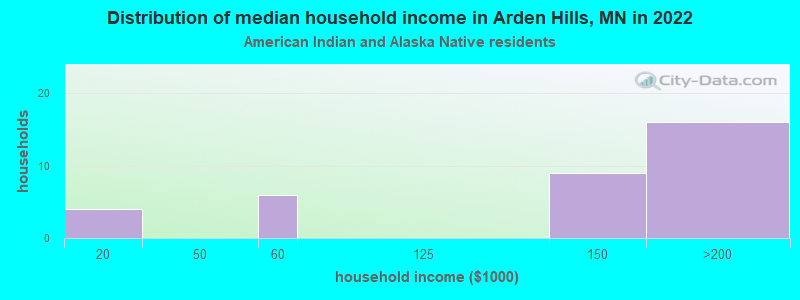
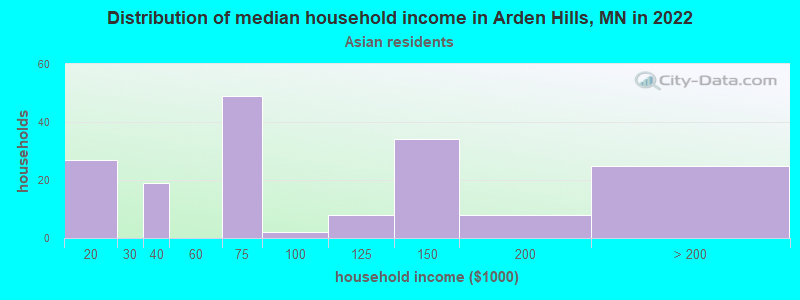
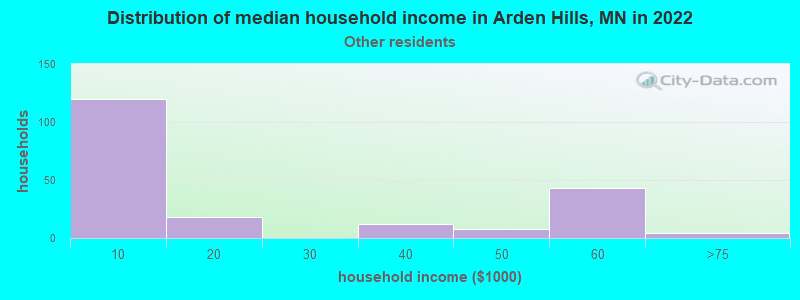
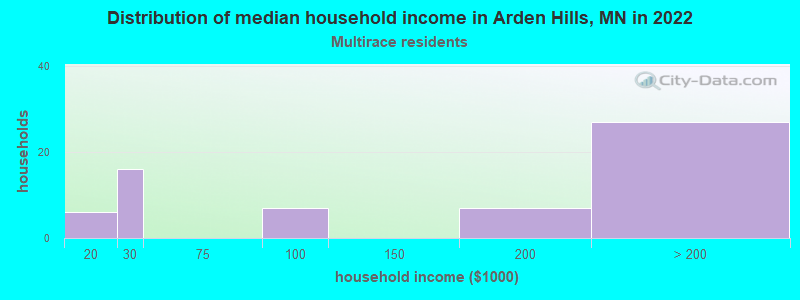
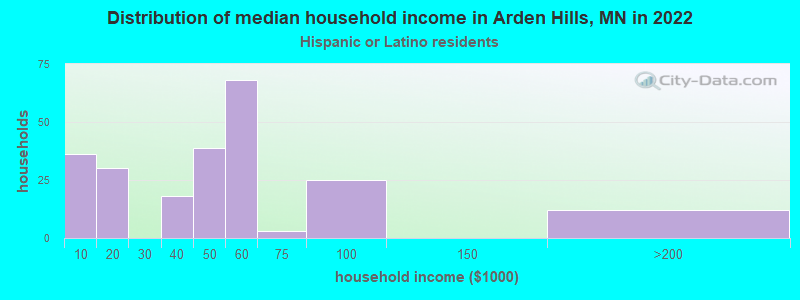
Income and house value in Arden Hills Median household income in 2022 $130,375 White non-Hispanic householders$66,131 Black householders$103,659 Asian householders$1,925 Some other race householdersMedian 2022 house value $452,204 White Non-Hispanic householders$284,114 Black or African American householders $561,621 Asian householders$363,402 Some other race householders$470,705 Two or more races householders$370,009 Hispanic or Latino householders
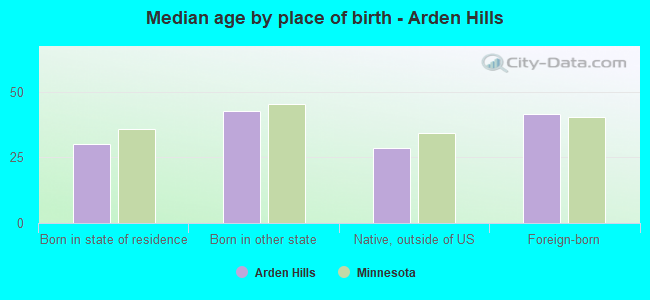
Median age by race in Arden Hills
39.8 Median age for White residents39.0 40.3 20.0 Median age for Black or African American residents19.7 19.6 76.6 Median age for American Indian / Alaska Native residents100.9 -696,340,256.5 34.0 Median age for Asian residents33.1 35.4 -744,336,568.8 Median age for Native Hawaiian / Pacific Islander residents-856,799,036.4 -534,959,349.1 30.2 Median age for Other race residents25.5 32.3 22.3 Median age for Two or more races residents24.2 21.1 39.2 Median age for White alone residents38.8 39.5 28.3 Median age for Hispanic or Latino residents21.7 28.4
Owner/renter occupied households by race in Arden Hills
House owners and renters - White residents 2,067 86.3% Owner occupied329 13.7% Renter occupiedHouse owners and renters - Black or African American residents 34 88.9% Owner occupied4 11.1% Renter occupiedHouse owners and renters - American Indian / Alaska Native residents 6 100.0% Owner occupiedHouse owners and renters - Asian residents 145 88.0% Owner occupied20 12.0% Renter occupiedHouse owners and renters - Other race residents 196 100.0% Owner occupiedHouse owners and renters - Two or more races residents 52 72.2% Owner occupied20 27.8% Renter occupiedHouse owners and renters - White alone residents 2,043 86.6% Owner occupied317 13.4% Renter occupiedHouse owners and renters - Hispanic or Latino residents 211 85.7% Owner occupied35 14.3% Renter occupied
Language usage in Arden Hills
English speakers - Total 88.3% of residents of Arden Hills speak English at home.
5.4% of residents speak Spanish at home 195 39.9% Speak English very well294 60.1% Speak English less than very well6.7% of residents speak other language at home 437 72.0% Speak English very well170 28.0% Speak English less than very well
English speakers - Born in the United States 95.5% of residents of Arden Hills speak English at home.
0.7% of residents speak Spanish at home 15 100.0% Speak English very well3.5% of residents speak other language at home 74 100.0% Speak English very well
English speakers - Native, born elsewhere 67.3% of residents of Arden Hills speak English at home.
9.7% of residents speak Spanish at home 16 100.0% Speak English very well15.8% of residents speak other language at home 26 100.0% Speak English very well
English speakers - Foreign-born 23.9% of residents of Arden Hills speak English at home.
34.6% of residents speak Spanish at home 35 12.3% Speak English very well249 87.7% Speak English less than very well43.2% of residents speak other language at home 207 58.5% Speak English very well147 41.5% Speak English less than very well
White (Caucasian) - Speak only English Native:
99.1% (7,142)Foreign-born:
49.4% (36)
White (Caucasian) - Speak another language Native:
1.4% (100)Foreign-born:
53.4% (39)
Black or African American - Speak only English Native:
66.8% (138)Foreign-born:
18.8% (9)
Black or African American - Speak another language Native:
30.7% (63)Foreign-born:
80.1% (39)
Asian - Speak only English Native:
14.0% (20)Foreign-born:
21.6% (79)
Asian - Speak another language Native:
81.9% (116)Foreign-born:
79.1% (288)
Other race - Speak only English Native:
35.6% (84)Foreign-born:
31.3% (120)
Other race - Speak another language Native:
63.9% (150)Foreign-born:
69.9% (267)
Two or more races - Speak only English Native:
89.1% (296)Foreign-born:
13.4% (5)
Two or more races - Speak another language Native:
10.8% (36)Foreign-born:
79.3% (30)
White alone - Speak only English Native:
98.4% (7,142)Foreign-born:
62.6% (41)
White alone - Speak another language Native:
1.7% (120)Foreign-born:
40.1% (26)
Hispanic or Latino - Speak only English Native:
44.3% (112)Foreign-born:
23.8% (84)
Hispanic or Latino - Speak another language Native:
56.3% (142)Foreign-born:
76.7% (271)
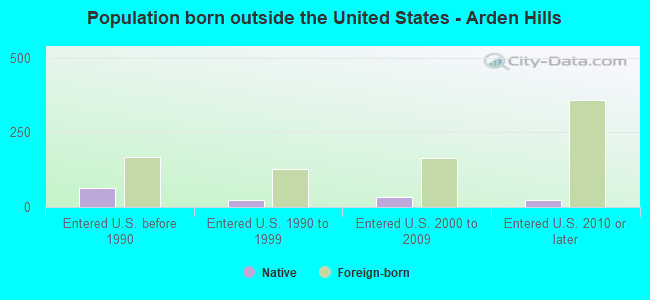
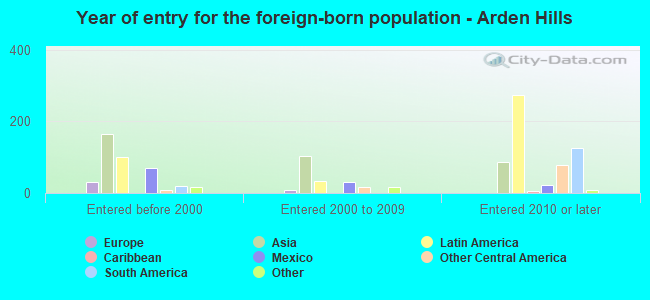
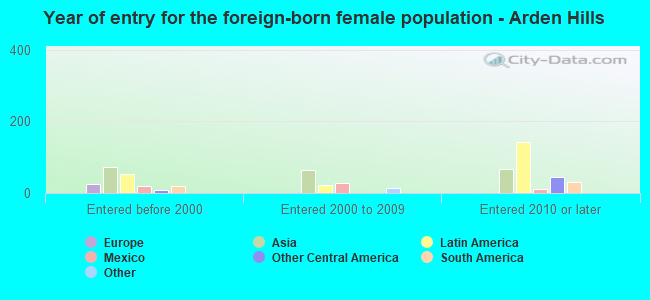
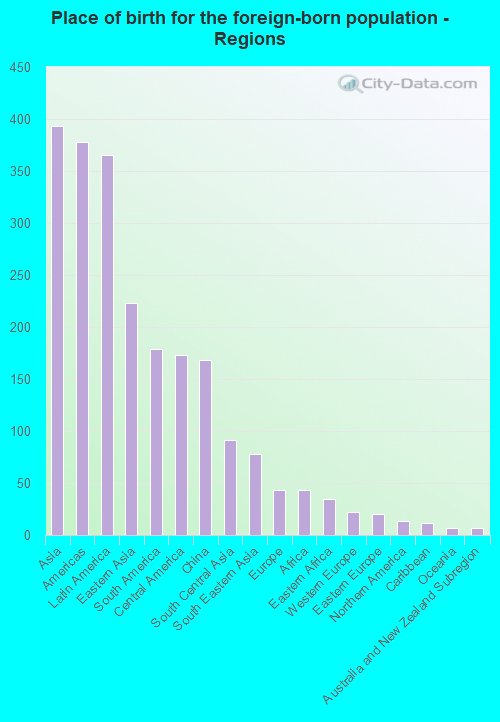
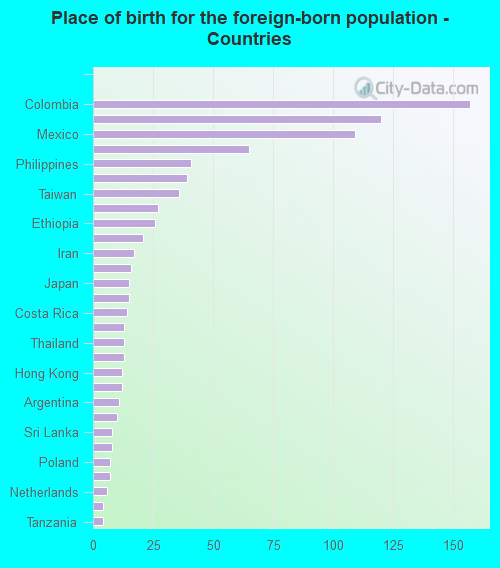
Foreign-born residents in Arden Hills 866 residents are foreign born (3.9% Asia , 3.6% Latin America ).
This city:
9.0%Minnesota:
8.5%
Marital status for residents in Arden Hills Marital status - White (Caucasian) population 15 years and over
Males 40.2% Never married52.1% Now married0.8% Separated2.3% Widowed4.6% DivorcedFemales 36.3% Never married50.2% Now married0.2% Separated6.2% Widowed7.1% DivorcedWomen who gave birth in the past 12 months Now married:
90.8% (82)Unmarried:
9.2% (8)
Women who did not give birth in the past 12 months Now married:
33.1% (596)Unmarried:
66.9% (1,202)
Marital status - Black or African American population 15 years and over
Males 88.8% Never married11.2% Now married0.0% Separated0.0% Widowed0.0% DivorcedFemales 80.0% Never married0.0% Now married0.0% Separated14.7% Widowed5.3% DivorcedWomen who did not give birth in the past 12 months Now married:
0.0% (0)Unmarried:
100.0% (58)
Marital status - Asian population 15 years and over
Males 42.4% Never married55.8% Now married0.0% Separated0.0% Widowed1.8% DivorcedFemales 45.5% Never married41.8% Now married4.5% Separated6.0% Widowed2.2% DivorcedWomen who gave birth in the past 12 months Now married:
100.0% (10)Unmarried:
0.0% (0)
Women who did not give birth in the past 12 months Now married:
29.1% (49)Unmarried:
70.9% (120)
Marital status - Other race population 15 years and over
Males 20.4% Never married79.6% Now married0.0% Separated0.0% Widowed0.0% DivorcedFemales 32.3% Never married66.1% Now married1.6% Separated0.0% Widowed0.0% DivorcedWomen who did not give birth in the past 12 months Now married:
67.7% (214)Unmarried:
32.3% (102)
Marital status - Two or more races population 15 years and over
Males 60.5% Never married30.6% Now married0.0% Separated0.0% Widowed8.8% DivorcedFemales 65.6% Never married34.4% Now married0.0% Separated0.0% Widowed0.0% DivorcedWomen who did not give birth in the past 12 months Now married:
8.7% (6)Unmarried:
91.3% (64)
Marital status - White alone, not Hispanic / Latino population 15 years and over
Males 39.6% Never married52.6% Now married0.8% Separated2.4% Widowed4.7% DivorcedFemales 36.2% Never married50.1% Now married0.2% Separated6.3% Widowed7.2% DivorcedWomen who gave birth in the past 12 months Now married:
90.8% (85)Unmarried:
9.2% (9)
Women who did not give birth in the past 12 months Now married:
32.7% (595)Unmarried:
67.3% (1,222)
Marital status - Hispanic or Latino population 15 years and over
Males 41.5% Never married58.5% Now married0.0% Separated0.0% Widowed0.0% DivorcedFemales 36.9% Never married62.0% Now married1.2% Separated0.0% Widowed0.0% DivorcedWomen who did not give birth in the past 12 months Now married:
62.0% (145)Unmarried:
38.0% (89)
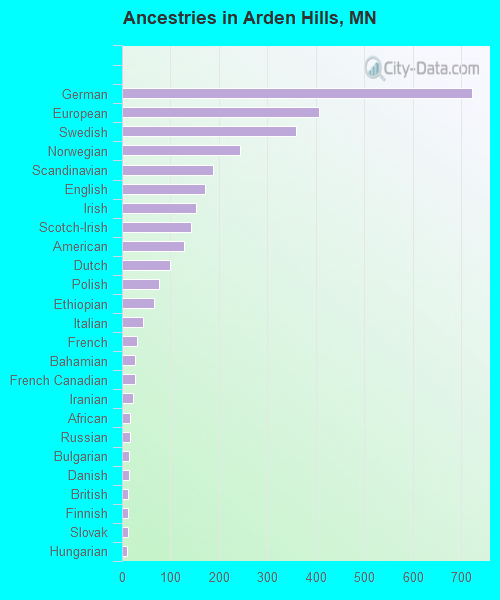
Ancestries in Arden Hills
721 16.7% German406 9.4% European359 8.3% Swedish243 5.6% Norwegian187 4.3% Scandinavian172 4.0% English152 3.5% Irish142 3.3% Scotch-Irish128 3.0% American99 2.3% Dutch76 1.8% Polish65 1.5% Ethiopian43 1.0% Italian31 0.7% French27 0.6% Bahamian26 0.6% French Canadian23 0.5% Iranian17 0.4% African16 0.4% Russian15 0.3% Bulgarian15 0.3% Danish13 0.3% British13 0.3% Finnish12 0.3% Slovak11 0.3% Hungarian9 0.2% Luxembourger9 0.2% Guyanese9 0.2% Scottish8 0.2% Northern European8 0.2% Greek7 0.2% Austrian7 0.2% Ukrainian6 0.1% Turkish5 0.1% Czech2 0.05% Liberian2 0.05% Zimbabwean
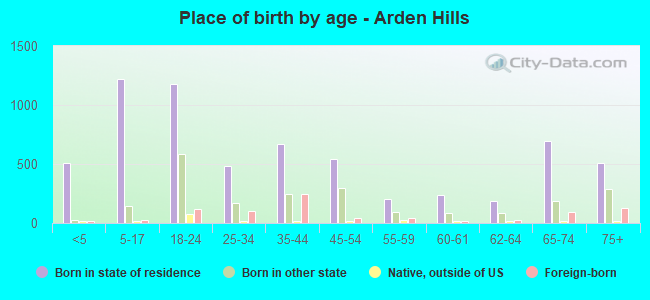
Children Nativity (place of birth) in Arden Hills
Children under 6 years - Living with two parents Both parents native 466 100.0% NativeBoth parents foreign-born 43 100.0% NativeOne native, one foreign-born parent 45 100.0% NativeChildren under 6 years - Living with one parent Native parent 39 100.0% NativeForeign-born parent 26 93.5% Native2 6.5% Foreign-bornChildren 6 to 17 years - Living with two parents Both parents native 886 98.2% Native16 1.8% Foreign-bornBoth parents foreign-born 73 86.9% Native11 13.1% Foreign-bornOne native, one foreign-born parent 49 100.0% NativeChildren 6 to 17 years - Living with one parent Native parent 106 100.0% NativeForeign-born parent 112 48.4% Native120 51.6% Foreign-born
Grandparents responsible for own grandchildren in Arden Hills
Grandparents (30 to 59 years) Other race 100 100.0% Responsible for grandchildrenHispanic or Latino 60 100.0% Responsible for grandchildren
Grandparents (60 years and over) Other race 63 100.0% Not responsible for grandchildrenHispanic or Latino 57 100.0% Not responsible for grandchildren