Races in Ardmore, Oklahoma (OK) Detailed Stats
Data:
Races - White alone (%)
Races - White alone (% change since 2000)
Races - Black alone (%)
Races - Black alone (% change since 2000)
Races - American Indian alone (%)
Races - American Indian alone (% change since 2000)
Races - Asian alone (%)
Races - Asian alone (% change since 2000)
Races - Hispanic (%)
Races - Hispanic (% change since 2000)
Races - Native Hawaiian and Other Pacific Islander alone (%)
Races - Native Hawaiian and Other Pacific Islander alone (% change since 2000)
Races - Two or more races(%)
Races - Two or more races(% change since 2000)
Races - Other race alone (%)
Races - Other race alone (% change since 2000)
Racial diversity
Place of birth - Born in state of residence (%)
Place of birth - Born in state of residence (%) - White
Place of birth - Born in state of residence (%) - Black or African American
Place of birth - Born in state of residence (%) - Asian
Place of birth - Born in state of residence (%) - Hispanic or Latino
Place of birth - Born in state of residence (%) - American Indian and Alaska Native
Place of birth - Born in state of residence (%) - Multirace
Place of birth - Born in state of residence (%) - Other Race
Place of birth - Born in other state (%)
Place of birth - Born in other state (%) - White
Place of birth - Born in other state (%) - Black or African American
Place of birth - Born in other state (%) - Asian
Place of birth - Born in other state (%) - Hispanic or Latino
Place of birth - Born in other state (%) - American Indian and Alaska Native
Place of birth - Born in other state (%) - Multirace
Place of birth - Born in other state (%) - Other Race
Place of birth - Native, outside of US (%)
Place of birth - Native, outside of US (%) - White
Place of birth - Native, outside of US (%) - Black or African American
Place of birth - Native, outside of US (%) - Asian
Place of birth - Native, outside of US (%) - Hispanic or Latino
Place of birth - Native, outside of US (%) - American Indian and Alaska Native
Place of birth - Native, outside of US (%) - Multirace
Place of birth - Native, outside of US (%) - Other Race
Place of birth - Foreign born (%)
Place of birth - Foreign born (%) - White
Place of birth - Foreign born (%) - Black or African American
Place of birth - Foreign born (%) - Asian
Place of birth - Foreign born (%) - Hispanic or Latino
Place of birth - Foreign born (%) - American Indian and Alaska Native
Place of birth - Foreign born (%) - Multirace
Place of birth - Foreign born (%) - Other Race
Residents speaking English at home (%)
Residents speaking English at home - Born in the United States (%)
Residents speaking English at home - Native, born elsewhere (%)
Residents speaking English at home - Foreign born (%)
Residents speaking Spanish at home (%)
Residents speaking Spanish at home - Born in the United States (%)
Residents speaking Spanish at home - Native, born elsewhere (%)
Residents speaking Spanish at home - Foreign born (%)
Residents speaking other language at home (%)
Residents speaking other language at home - Born in the United States (%)
Residents speaking other language at home - Native, born elsewhere (%)
Residents speaking other language at home - Foreign born (%)
Marital status - Never married (%)
Marital status - Now married (%)
Marital status - Separated (%)
Marital status - Widowed (%)
Marital status - Divorced (%)
Ancestries Reported - Arab (%)
Ancestries Reported - Czech (%)
Ancestries Reported - Danish (%)
Ancestries Reported - Dutch (%)
Ancestries Reported - English (%)
Ancestries Reported - French (%)
Ancestries Reported - French Canadian (%)
Ancestries Reported - German (%)
Ancestries Reported - Greek (%)
Ancestries Reported - Hungarian (%)
Ancestries Reported - Irish (%)
Ancestries Reported - Italian (%)
Ancestries Reported - Lithuanian (%)
Ancestries Reported - Norwegian (%)
Ancestries Reported - Polish (%)
Ancestries Reported - Portuguese (%)
Ancestries Reported - Russian (%)
Ancestries Reported - Scotch-Irish (%)
Ancestries Reported - Scottish (%)
Ancestries Reported - Slovak (%)
Ancestries Reported - Subsaharan African (%)
Ancestries Reported - Swedish (%)
Ancestries Reported - Swiss (%)
Ancestries Reported - Ukrainian (%)
Ancestries Reported - United States (%)
Ancestries Reported - Welsh (%)
Ancestries Reported - West Indian (%)
Ancestries Reported - Other (%)
Geographical mobility - Same house 1 year ago (%)
Geographical mobility - Same house 1 year ago (%) - White
Geographical mobility - Same house 1 year ago (%) - Black or African American
Geographical mobility - Same house 1 year ago (%) - Asian
Geographical mobility - Same house 1 year ago (%) - Hispanic or Latino
Geographical mobility - Same house 1 year ago (%) - American Indian and Alaska Native
Geographical mobility - Same house 1 year ago (%) - Multirace
Geographical mobility - Same house 1 year ago (%) - Other Race
Geographical mobility - Moved within same county (%)
Geographical mobility - Moved within same county (%) - White
Geographical mobility - Moved within same county (%) - Black or African American
Geographical mobility - Moved within same county (%) - Asian
Geographical mobility - Moved within same county (%) - Hispanic or Latino
Geographical mobility - Moved within same county (%) - American Indian and Alaska Native
Geographical mobility - Moved within same county (%) - Multirace
Geographical mobility - Moved within same county (%) - Other Race
Geographical mobility - Moved from different county within same state (%)
Geographical mobility - Moved from different county within same state (%) - White
Geographical mobility - Moved from different county within same state (%) - Black or African American
Geographical mobility - Moved from different county within same state (%) - Asian
Geographical mobility - Moved from different county within same state (%) - Hispanic or Latino
Geographical mobility - Moved from different county within same state (%) - American Indian and Alaska Native
Geographical mobility - Moved from different county within same state (%) - Multirace
Geographical mobility - Moved from different county within same state (%) - Other Race
Geographical mobility - Moved from different state (%)
Geographical mobility - Moved from different state (%) - White
Geographical mobility - Moved from different state (%) - Black or African American
Geographical mobility - Moved from different state (%) - Asian
Geographical mobility - Moved from different state (%) - Hispanic or Latino
Geographical mobility - Moved from different state (%) - American Indian and Alaska Native
Geographical mobility - Moved from different state (%) - Multirace
Geographical mobility - Moved from different state (%) - Other Race
Geographical mobility - Moved from abroad (%)
Geographical mobility - Moved from abroad (%) - White
Geographical mobility - Moved from abroad (%) - Black or African American
Geographical mobility - Moved from abroad (%) - Asian
Geographical mobility - Moved from abroad (%) - Hispanic or Latino
Geographical mobility - Moved from abroad (%) - American Indian and Alaska Native
Geographical mobility - Moved from abroad (%) - Multirace
Geographical mobility - Moved from abroad (%) - Other Race
Place of birth for the foreign-born population - Ireland (%)
Place of birth for the foreign-born population - Denmark (%)
Place of birth for the foreign-born population - Norway (%)
Place of birth for the foreign-born population - Sweden (%)
Place of birth for the foreign-born population - United Kingdom (%)
Place of birth for the foreign-born population - England (%)
Place of birth for the foreign-born population - Scotland (%)
Place of birth for the foreign-born population - Other Northern Europe (%)
Place of birth for the foreign-born population - Austria (%)
Place of birth for the foreign-born population - Belgium (%)
Place of birth for the foreign-born population - France (%)
Place of birth for the foreign-born population - Germany (%)
Place of birth for the foreign-born population - Netherlands (%)
Place of birth for the foreign-born population - Switzerland (%)
Place of birth for the foreign-born population - Other Western Europe (%)
Place of birth for the foreign-born population - Greece (%)
Place of birth for the foreign-born population - Italy (%)
Place of birth for the foreign-born population - Portugal (%)
Place of birth for the foreign-born population - Spain (%)
Place of birth for the foreign-born population - Other Southern Europe (%)
Place of birth for the foreign-born population - Albania (%)
Place of birth for the foreign-born population - Belarus (%)
Place of birth for the foreign-born population - Bosnia and Herzegovina (%)
Place of birth for the foreign-born population - Bulgaria (%)
Place of birth for the foreign-born population - Croatia (%)
Place of birth for the foreign-born population - Czechoslovakia (%)
Place of birth for the foreign-born population - Hungary (%)
Place of birth for the foreign-born population - Latvia (%)
Place of birth for the foreign-born population - Lithuania (%)
Place of birth for the foreign-born population - North Macedonia (Macedonia) (%)
Place of birth for the foreign-born population - Moldova (%)
Place of birth for the foreign-born population - Poland (%)
Place of birth for the foreign-born population - Romania (%)
Place of birth for the foreign-born population - Russia (%)
Place of birth for the foreign-born population - Serbia (%)
Place of birth for the foreign-born population - Ukraine (%)
Place of birth for the foreign-born population - Other Eastern Europe (%)
Place of birth for the foreign-born population - China (%)
Place of birth for the foreign-born population - Hong Kong (%)
Place of birth for the foreign-born population - Taiwan (%)
Place of birth for the foreign-born population - Japan (%)
Place of birth for the foreign-born population - Korea (%)
Place of birth for the foreign-born population - Other Eastern Asia (%)
Place of birth for the foreign-born population - Afghanistan (%)
Place of birth for the foreign-born population - Bangladesh (%)
Place of birth for the foreign-born population - India (%)
Place of birth for the foreign-born population - Iran (%)
Place of birth for the foreign-born population - Kazakhstan (%)
Place of birth for the foreign-born population - Nepal (%)
Place of birth for the foreign-born population - Pakistan (%)
Place of birth for the foreign-born population - Sri Lanka (%)
Place of birth for the foreign-born population - Uzbekistan (%)
Place of birth for the foreign-born population - Other South Central Asia (%)
Place of birth for the foreign-born population - Burma (%)
Place of birth for the foreign-born population - Cambodia (%)
Place of birth for the foreign-born population - Indonesia (%)
Place of birth for the foreign-born population - Laos (%)
Place of birth for the foreign-born population - Malaysia (%)
Place of birth for the foreign-born population - Philippines (%)
Place of birth for the foreign-born population - Singapore (%)
Place of birth for the foreign-born population - Thailand (%)
Place of birth for the foreign-born population - Vietnam (%)
Place of birth for the foreign-born population - Other South Eastern Asia (%)
Place of birth for the foreign-born population - Armenia (%)
Place of birth for the foreign-born population - Iraq (%)
Place of birth for the foreign-born population - Israel (%)
Place of birth for the foreign-born population - Jordan (%)
Place of birth for the foreign-born population - Kuwait (%)
Place of birth for the foreign-born population - Lebanon (%)
Place of birth for the foreign-born population - Saudi Arabia (%)
Place of birth for the foreign-born population - Syria (%)
Place of birth for the foreign-born population - Turkey (%)
Place of birth for the foreign-born population - Yemen (%)
Place of birth for the foreign-born population - Other Western Asia (%)
Place of birth for the foreign-born population - Eritrea (%)
Place of birth for the foreign-born population - Ethiopia (%)
Place of birth for the foreign-born population - Kenya (%)
Place of birth for the foreign-born population - Somalia (%)
Place of birth for the foreign-born population - Uganda (%)
Place of birth for the foreign-born population - Zimbabwe (%)
Place of birth for the foreign-born population - Other Eastern Africa (%)
Place of birth for the foreign-born population - Cameroon (%)
Place of birth for the foreign-born population - Congo (%)
Place of birth for the foreign-born population - Democratic Republic of Congo (Zaire) (%)
Place of birth for the foreign-born population - Other Middle Africa (%)
Place of birth for the foreign-born population - Egypt (%)
Place of birth for the foreign-born population - Morocco (%)
Place of birth for the foreign-born population - Sudan (%)
Place of birth for the foreign-born population - Other Northern Africa (%)
Place of birth for the foreign-born population - South Africa (%)
Place of birth for the foreign-born population - Other Southern Africa (%)
Place of birth for the foreign-born population - Cabo Verde (%)
Place of birth for the foreign-born population - Ghana (%)
Place of birth for the foreign-born population - Liberia (%)
Place of birth for the foreign-born population - Nigeria (%)
Place of birth for the foreign-born population - Senegal (%)
Place of birth for the foreign-born population - Sierra Leone (%)
Place of birth for the foreign-born population - Other Western Africa (%)
Place of birth for the foreign-born population - Australia (%)
Place of birth for the foreign-born population - New Zealand (%)
Place of birth for the foreign-born population - Fiji (%)
Place of birth for the foreign-born population - Micronesia (%)
Place of birth for the foreign-born population - Bahamas (%)
Place of birth for the foreign-born population - Barbados (%)
Place of birth for the foreign-born population - Cuba (%)
Place of birth for the foreign-born population - Dominica (%)
Place of birth for the foreign-born population - Dominican Republic (%)
Place of birth for the foreign-born population - Grenada (%)
Place of birth for the foreign-born population - Haiti (%)
Place of birth for the foreign-born population - Jamaica (%)
Place of birth for the foreign-born population - St. Vincent and the Grenadines (%)
Place of birth for the foreign-born population - Trinidad and Tobago (%)
Place of birth for the foreign-born population - West Indies (%)
Place of birth for the foreign-born population - Other Caribbean (%)
Place of birth for the foreign-born population - Belize (%)
Place of birth for the foreign-born population - Costa Rica (%)
Place of birth for the foreign-born population - El Salvador (%)
Place of birth for the foreign-born population - Guatemala (%)
Place of birth for the foreign-born population - Honduras (%)
Place of birth for the foreign-born population - Mexico (%)
Place of birth for the foreign-born population - Nicaragua (%)
Place of birth for the foreign-born population - Panama (%)
Place of birth for the foreign-born population - Other Central America (%)
Place of birth for the foreign-born population - Argentina (%)
Place of birth for the foreign-born population - Bolivia (%)
Place of birth for the foreign-born population - Brazil (%)
Place of birth for the foreign-born population - Chile (%)
Place of birth for the foreign-born population - Colombia (%)
Place of birth for the foreign-born population - Ecuador (%)
Place of birth for the foreign-born population - Guyana (%)
Place of birth for the foreign-born population - Peru (%)
Place of birth for the foreign-born population - Uruguay (%)
Place of birth for the foreign-born population - Venezuela (%)
Place of birth for the foreign-born population - Other South America (%)
Place of birth for the foreign-born population - Canada (%)
Place of birth for the foreign-born population - Other Northern America (%)
Place of birth for the foreign-born population - Other (%)
Latest news about races in Ardmore, OK collected exclusively by city-data.com from local newspapers, TV, and radio stations
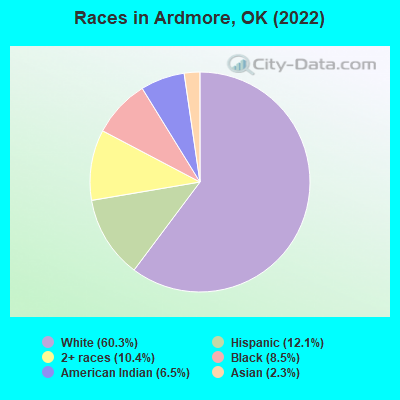
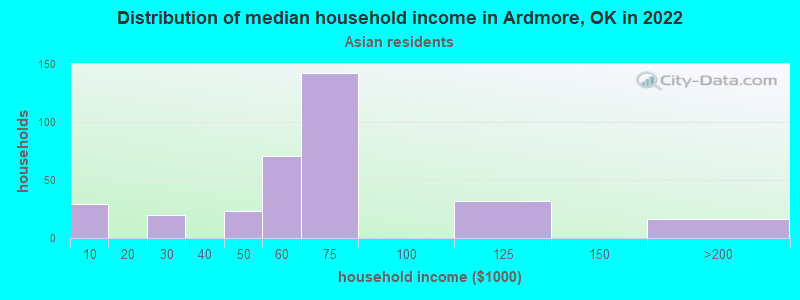
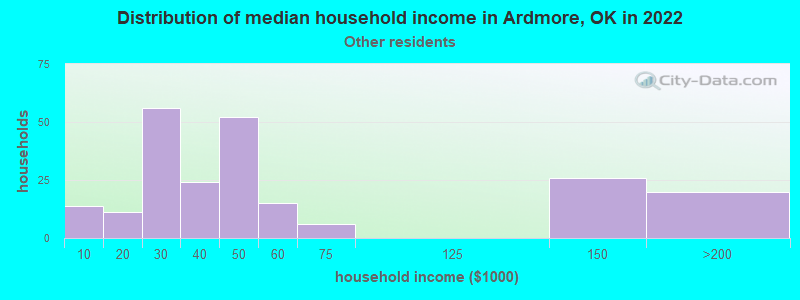
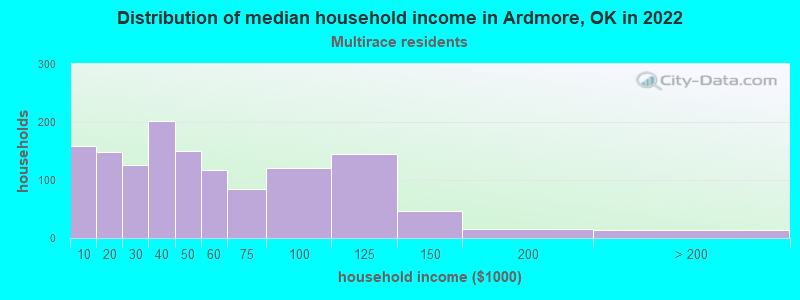
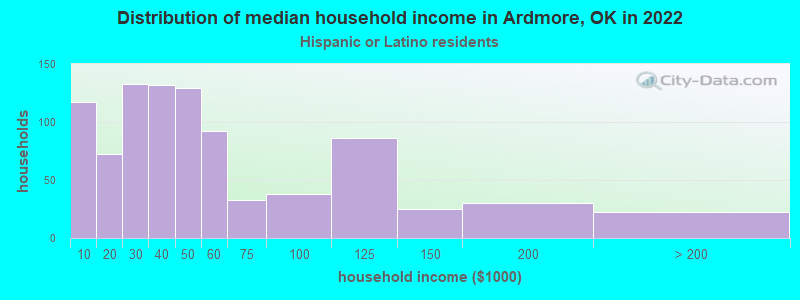
According to 2022 data, the most numerous races in Ardmore, OK are White alone (15,125 residents), Hispanic (3,025 residents), and Two or more races (2,610 residents). 88.3% of Ardmore residents speak English at home. 5.4% of Ardmore, OK residents are foreign-born (3.4% born in Latin America, 1.8% born in Asia), which is 11.1% less than the foreign-born rate of 6.0% across the entire state of Oklahoma.
Race distribution in Ardmore
2000 2022
2,556,368 74.1% White alone 266,158 7.7% American Indian alone 257,981 7.5% Black alone 179,304 5.2% Hispanic 140,249 4.1% Two or more races 46,172 1.3% Asian alone 2,322 0.07% Other race alone 2,100 0.06% Native Hawaiian and Other
2,517,403 62.6% White alone 486,692 12.1% Hispanic 364,453 9.1% Two or more races 273,650 6.8% American Indian alone 268,543 6.7% Black alone 92,672 2.3% Asian alone 10,786 0.3% Other race alone 5,601 0.1% Native Hawaiian and Other
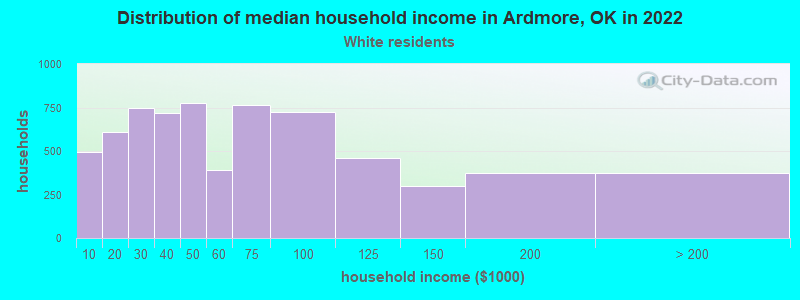
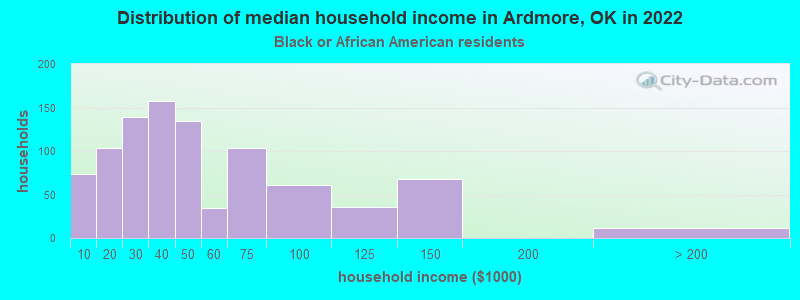
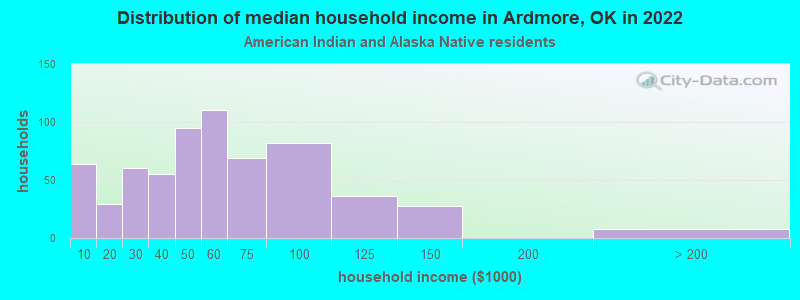
Income and house value in Ardmore Median household income in 2022 $52,341 White non-Hispanic householders$37,272 Black householders$51,268 American Indian and Alaska Native householders$58,478 Asian householders$32,542 Some other race householders$41,268 Two or more races householders$38,982 Hispanic or Latino race householdersMedian 2022 house value $189,568 White Non-Hispanic householders$126,761 Black or African American householders$122,746 American Indian or Alaska Native householders $243,772 Asian householders$220,829 Some other race householders$270,730 Two or more races householders$212,512 Hispanic or Latino householders
Median age by race in Ardmore
42.9 Median age for White residents40.8 44.9 43.5 Median age for Black or African American residents46.4 40.7 29.3 Median age for American Indian / Alaska Native residents27.5 32.2 34.2 Median age for Asian residents31.7 34.6 -725,225,224.5 Median age for Native Hawaiian / Pacific Islander residents-675,324,674.6 -767,251,461.2 25.2 Median age for Other race residents19.7 32.3 22.2 Median age for Two or more races residents16.8 25.0 43.4 Median age for White alone residents40.5 45.3 22.1 Median age for Hispanic or Latino residents19.7 23.4
Owner/renter occupied households by race in Ardmore
House owners and renters - White residents 4,004 59.6% Owner occupied2,717 40.4% Renter occupiedHouse owners and renters - Black or African American residents 374 41.4% Owner occupied528 58.6% Renter occupiedHouse owners and renters - American Indian / Alaska Native residents 328 52.1% Owner occupied301 47.9% Renter occupiedHouse owners and renters - Asian residents 110 36.0% Owner occupied195 64.0% Renter occupiedHouse owners and renters - Other race residents 169 72.5% Owner occupied64 27.5% Renter occupiedHouse owners and renters - Two or more races residents 631 48.4% Owner occupied673 51.6% Renter occupiedHouse owners and renters - White alone residents 3,925 60.3% Owner occupied2,583 39.7% Renter occupiedHouse owners and renters - Hispanic or Latino residents 439 48.5% Owner occupied467 51.5% Renter occupied
Language usage in Ardmore
English speakers - Total 88.3% of residents of Ardmore speak English at home.
6.9% of residents speak Spanish at home 921 57.0% Speak English very well695 43.0% Speak English less than very well4.7% of residents speak other language at home 851 77.4% Speak English very well248 22.6% Speak English less than very well
English speakers - Born in the United States 91.3% of residents of Ardmore speak English at home.
5.7% of residents speak Spanish at home 415 92.6% Speak English very well33 7.4% Speak English less than very well2.8% of residents speak other language at home 201 89.3% Speak English very well24 10.7% Speak English less than very well
English speakers - Native, born elsewhere 67.0% of residents of Ardmore speak English at home.
29.0% of residents speak Spanish at home 12 23.5% Speak English very well39 76.5% Speak English less than very well5.1% of residents speak other language at home 9 100.0% Speak English very well
English speakers - Foreign-born 6.5% of residents of Ardmore speak English at home.
52.3% of residents speak Spanish at home 114 16.5% Speak English very well575 83.5% Speak English less than very well41.5% of residents speak other language at home 356 65.2% Speak English very well190 34.8% Speak English less than very well
White (Caucasian) - Speak only English Native:
97.6% (14,246)Foreign-born:
14.3% (34)
White (Caucasian) - Speak another language Native:
2.4% (353)Foreign-born:
76.3% (184)
Asian - Speak only English Native:
6.0% (14)Foreign-born:
13.1% (42)
Asian - Speak another language Native:
94.3% (215)Foreign-born:
87.0% (280)
Other race - Speak only English Native:
32.9% (141)Foreign-born:
2.1% (7)
Other race - Speak another language Native:
67.8% (291)Foreign-born:
97.9% (340)
Two or more races - Speak another language Native:
14.5% (441)Foreign-born:
100.0% (476)
White alone - Speak only English Native:
97.8% (13,894)Foreign-born:
9.4% (25)
White alone - Speak another language Native:
2.2% (310)Foreign-born:
88.0% (229)
Hispanic or Latino - Speak only English Native:
62.2% (1,196)Foreign-born:
3.0% (22)
Hispanic or Latino - Speak another language Native:
38.1% (732)Foreign-born:
96.7% (700)
Foreign-born residents in Ardmore 1,355 residents are foreign born (3.4% Latin America , 1.8% Asia ).
This city:
5.4%Oklahoma:
6.1%
Marital status for residents in Ardmore Marital status - White (Caucasian) population 15 years and over
Males 31.6% Never married46.1% Now married2.3% Separated6.0% Widowed14.0% DivorcedFemales 19.0% Never married44.3% Now married2.9% Separated11.7% Widowed22.1% DivorcedWomen who gave birth in the past 12 months Now married:
44.6% (107)Unmarried:
55.4% (133)
Women who did not give birth in the past 12 months Now married:
50.4% (1,583)Unmarried:
49.6% (1,558)
Marital status - Black or African American population 15 years and over
Males 49.1% Never married36.3% Now married1.9% Separated5.8% Widowed6.9% DivorcedFemales 37.1% Never married32.8% Now married6.3% Separated5.2% Widowed18.6% DivorcedWomen who gave birth in the past 12 months Now married:
0.0% (0)Unmarried:
100.0% (12)
Women who did not give birth in the past 12 months Now married:
28.3% (133)Unmarried:
71.7% (337)
Marital status - American Indian / Alaska Native population 15 years and over
Males 47.1% Never married41.0% Now married0.0% Separated2.5% Widowed9.4% DivorcedFemales 27.3% Never married31.5% Now married9.7% Separated11.1% Widowed20.4% DivorcedWomen who did not give birth in the past 12 months Now married:
40.2% (195)Unmarried:
59.8% (290)
Marital status - Asian population 15 years and over
Males 21.7% Never married70.4% Now married7.9% Separated0.0% Widowed0.0% DivorcedFemales 0.0% Never married48.6% Now married0.0% Separated26.8% Widowed24.5% DivorcedWomen who did not give birth in the past 12 months Now married:
100.0% (107)Unmarried:
0.0% (0)
Marital status - Other race population 15 years and over
Males 41.8% Never married48.6% Now married8.9% Separated0.0% Widowed0.7% DivorcedFemales 20.1% Never married46.6% Now married20.1% Separated2.7% Widowed10.5% DivorcedWomen who gave birth in the past 12 months Now married:
100.0% (10)Unmarried:
0.0% (0)
Women who did not give birth in the past 12 months Now married:
71.4% (139)Unmarried:
28.6% (56)
Marital status - Two or more races population 15 years and over
Males 39.2% Never married40.2% Now married0.0% Separated5.1% Widowed15.5% DivorcedFemales 38.6% Never married38.0% Now married4.5% Separated4.1% Widowed14.8% DivorcedWomen who gave birth in the past 12 months Now married:
41.2% (100)Unmarried:
58.8% (143)
Women who did not give birth in the past 12 months Now married:
41.4% (379)Unmarried:
58.6% (537)
Marital status - White alone, not Hispanic / Latino population 15 years and over
Males 31.2% Never married46.0% Now married2.1% Separated6.3% Widowed14.4% DivorcedFemales 17.7% Never married44.8% Now married2.9% Separated11.9% Widowed22.7% DivorcedWomen who gave birth in the past 12 months Now married:
44.6% (111)Unmarried:
55.4% (138)
Women who did not give birth in the past 12 months Now married:
51.8% (1,555)Unmarried:
48.2% (1,445)
Marital status - Hispanic or Latino population 15 years and over
Males 38.5% Never married48.4% Now married5.1% Separated2.7% Widowed5.3% DivorcedFemales 37.4% Never married39.9% Now married10.8% Separated2.8% Widowed9.1% DivorcedWomen who gave birth in the past 12 months Now married:
73.6% (43)Unmarried:
26.4% (15)
Women who did not give birth in the past 12 months Now married:
49.2% (355)Unmarried:
50.8% (367)
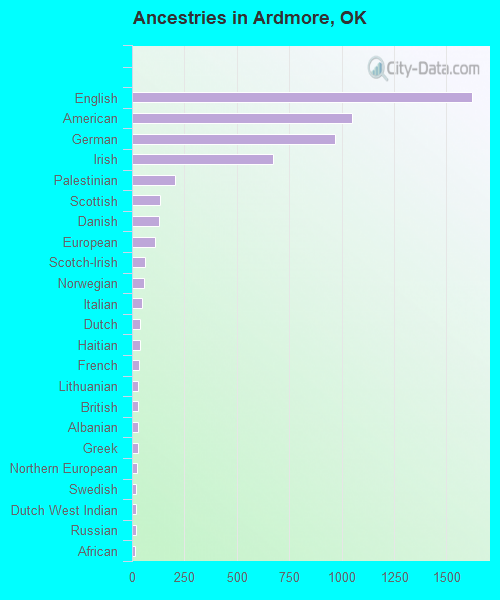
Ancestries in Ardmore
1,622 13.0% English1,050 8.4% American970 7.7% German673 5.4% Irish204 1.6% Palestinian135 1.1% Scottish130 1.0% Danish112 0.9% European60 0.5% Scotch-Irish57 0.5% Norwegian49 0.4% Italian38 0.3% Dutch38 0.3% Haitian34 0.3% French31 0.2% Lithuanian30 0.2% British29 0.2% Albanian27 0.2% Greek22 0.2% Northern European19 0.2% Swedish19 0.2% Dutch West Indian18 0.1% Russian16 0.1% African13 0.1% Iranian12 0.10% Scandinavian12 0.10% Slavic9 0.07% Polish7 0.06% Czech7 0.06% Welsh
Geographical mobility in Ardmore Same house 1 year ago 12,479 80.9% White (Caucasian)1,830 86.6% Black or African American1,499 81.1% American Indian / Alaska Native460 78.8% Asian7 100.0% Native Hawaiian / Pacific Islander688 81.6% Other race3,325 81.6% Two or more races12,269 81.4% White alone, not Hispanic / Latino2,368 81.1% Hispanic or LatinoMoved within same county 1,561 10.1% White / Caucasian183 8.7% Black or African American169 9.1% American Indian / Alaska Native49 8.4% Asian31 3.6% Other race504 12.4% Two or more races1,526 10.1% White alone, not Hispanic / Latino249 8.5% Hispanic or LatinoMoved within same state 459 3.0% White / Caucasian40 1.9% Black or African American75 4.0% American Indian / Alaska Native5 0.9% Asian43 5.1% Other race142 3.5% Two or more races453 3.0% White alone, not Hispanic / Latino105 3.6% Hispanic or LatinoMoved from different state 594 3.9% White / Caucasian64 3.0% Black or African American87 4.7% American Indian / Alaska Native76 13.0% Asian83 9.9% Other race70 1.7% Two or more races539 3.6% White alone, not Hispanic / Latino144 4.9% Hispanic or LatinoMoved from abroad 189 1.2% White13 0.7% American Indian / Alaska Native194 1.3% White alone, not Hispanic / Latino60 2.0% Hispanic or Latino
Children Nativity (place of birth) in Ardmore
Children under 6 years - Living with two parents Both parents native 709 100.0% NativeBoth parents foreign-born 57 57.0% Native43 43.0% Foreign-bornOne native, one foreign-born parent 16 100.0% NativeChildren under 6 years - Living with one parent Native parent 862 100.0% NativeForeign-born parent 29 100.0% NativeChildren 6 to 17 years - Living with two parents Both parents native 2,224 98.9% Native26 1.1% Foreign-bornBoth parents foreign-born 227 77.9% Native64 22.1% Foreign-bornOne native, one foreign-born parent 158 100.0% NativeChildren 6 to 17 years - Living with one parent Native parent 1,255 100.0% NativeForeign-born parent 92 52.5% Native83 47.5% Foreign-born
Grandparents responsible for own grandchildren in Ardmore
Grandparents (30 to 59 years) White / Caucasian 74 54.3% Responsible for grandchildren62 45.7% Not responsible for grandchildrenBlack or African American 11 100.0% Not responsible for grandchildrenOther race 34 100.0% Responsible for grandchildrenTwo or more races 45 77.4% Responsible for grandchildren13 22.6% Not responsible for grandchildrenWhite alone, not Hispanic / Latino 77 55.2% Responsible for grandchildren63 44.8% Not responsible for grandchildrenHispanic or Latino 62 89.8% Responsible for grandchildren7 10.2% Not responsible for grandchildrenGrandparents (60 years and over) White / Caucasian 6 12.5% Responsible for grandchildren41 87.5% Not responsible for grandchildrenBlack or African American 19 86.9% Responsible for grandchildren3 13.1% Not responsible for grandchildrenTwo or more races 12 52.9% Responsible for grandchildren11 47.1% Not responsible for grandchildrenWhite alone, not Hispanic / Latino 6 12.0% Responsible for grandchildren43 88.0% Not responsible for grandchildren