Races in Ashland, Kentucky (KY) Detailed Stats
Data:
Races - White alone (%)
Races - White alone (% change since 2000)
Races - Black alone (%)
Races - Black alone (% change since 2000)
Races - American Indian alone (%)
Races - American Indian alone (% change since 2000)
Races - Asian alone (%)
Races - Asian alone (% change since 2000)
Races - Hispanic (%)
Races - Hispanic (% change since 2000)
Races - Native Hawaiian and Other Pacific Islander alone (%)
Races - Native Hawaiian and Other Pacific Islander alone (% change since 2000)
Races - Two or more races(%)
Races - Two or more races(% change since 2000)
Races - Other race alone (%)
Races - Other race alone (% change since 2000)
Racial diversity
Place of birth - Born in state of residence (%)
Place of birth - Born in state of residence (%) - White
Place of birth - Born in state of residence (%) - Black or African American
Place of birth - Born in state of residence (%) - Asian
Place of birth - Born in state of residence (%) - Hispanic or Latino
Place of birth - Born in state of residence (%) - American Indian and Alaska Native
Place of birth - Born in state of residence (%) - Multirace
Place of birth - Born in state of residence (%) - Other Race
Place of birth - Born in other state (%)
Place of birth - Born in other state (%) - White
Place of birth - Born in other state (%) - Black or African American
Place of birth - Born in other state (%) - Asian
Place of birth - Born in other state (%) - Hispanic or Latino
Place of birth - Born in other state (%) - American Indian and Alaska Native
Place of birth - Born in other state (%) - Multirace
Place of birth - Born in other state (%) - Other Race
Place of birth - Native, outside of US (%)
Place of birth - Native, outside of US (%) - White
Place of birth - Native, outside of US (%) - Black or African American
Place of birth - Native, outside of US (%) - Asian
Place of birth - Native, outside of US (%) - Hispanic or Latino
Place of birth - Native, outside of US (%) - American Indian and Alaska Native
Place of birth - Native, outside of US (%) - Multirace
Place of birth - Native, outside of US (%) - Other Race
Place of birth - Foreign born (%)
Place of birth - Foreign born (%) - White
Place of birth - Foreign born (%) - Black or African American
Place of birth - Foreign born (%) - Asian
Place of birth - Foreign born (%) - Hispanic or Latino
Place of birth - Foreign born (%) - American Indian and Alaska Native
Place of birth - Foreign born (%) - Multirace
Place of birth - Foreign born (%) - Other Race
Residents speaking English at home (%)
Residents speaking English at home - Born in the United States (%)
Residents speaking English at home - Native, born elsewhere (%)
Residents speaking English at home - Foreign born (%)
Residents speaking Spanish at home (%)
Residents speaking Spanish at home - Born in the United States (%)
Residents speaking Spanish at home - Native, born elsewhere (%)
Residents speaking Spanish at home - Foreign born (%)
Residents speaking other language at home (%)
Residents speaking other language at home - Born in the United States (%)
Residents speaking other language at home - Native, born elsewhere (%)
Residents speaking other language at home - Foreign born (%)
Marital status - Never married (%)
Marital status - Now married (%)
Marital status - Separated (%)
Marital status - Widowed (%)
Marital status - Divorced (%)
Ancestries Reported - Arab (%)
Ancestries Reported - Czech (%)
Ancestries Reported - Danish (%)
Ancestries Reported - Dutch (%)
Ancestries Reported - English (%)
Ancestries Reported - French (%)
Ancestries Reported - French Canadian (%)
Ancestries Reported - German (%)
Ancestries Reported - Greek (%)
Ancestries Reported - Hungarian (%)
Ancestries Reported - Irish (%)
Ancestries Reported - Italian (%)
Ancestries Reported - Lithuanian (%)
Ancestries Reported - Norwegian (%)
Ancestries Reported - Polish (%)
Ancestries Reported - Portuguese (%)
Ancestries Reported - Russian (%)
Ancestries Reported - Scotch-Irish (%)
Ancestries Reported - Scottish (%)
Ancestries Reported - Slovak (%)
Ancestries Reported - Subsaharan African (%)
Ancestries Reported - Swedish (%)
Ancestries Reported - Swiss (%)
Ancestries Reported - Ukrainian (%)
Ancestries Reported - United States (%)
Ancestries Reported - Welsh (%)
Ancestries Reported - West Indian (%)
Ancestries Reported - Other (%)
Geographical mobility - Same house 1 year ago (%)
Geographical mobility - Same house 1 year ago (%) - White
Geographical mobility - Same house 1 year ago (%) - Black or African American
Geographical mobility - Same house 1 year ago (%) - Asian
Geographical mobility - Same house 1 year ago (%) - Hispanic or Latino
Geographical mobility - Same house 1 year ago (%) - American Indian and Alaska Native
Geographical mobility - Same house 1 year ago (%) - Multirace
Geographical mobility - Same house 1 year ago (%) - Other Race
Geographical mobility - Moved within same county (%)
Geographical mobility - Moved within same county (%) - White
Geographical mobility - Moved within same county (%) - Black or African American
Geographical mobility - Moved within same county (%) - Asian
Geographical mobility - Moved within same county (%) - Hispanic or Latino
Geographical mobility - Moved within same county (%) - American Indian and Alaska Native
Geographical mobility - Moved within same county (%) - Multirace
Geographical mobility - Moved within same county (%) - Other Race
Geographical mobility - Moved from different county within same state (%)
Geographical mobility - Moved from different county within same state (%) - White
Geographical mobility - Moved from different county within same state (%) - Black or African American
Geographical mobility - Moved from different county within same state (%) - Asian
Geographical mobility - Moved from different county within same state (%) - Hispanic or Latino
Geographical mobility - Moved from different county within same state (%) - American Indian and Alaska Native
Geographical mobility - Moved from different county within same state (%) - Multirace
Geographical mobility - Moved from different county within same state (%) - Other Race
Geographical mobility - Moved from different state (%)
Geographical mobility - Moved from different state (%) - White
Geographical mobility - Moved from different state (%) - Black or African American
Geographical mobility - Moved from different state (%) - Asian
Geographical mobility - Moved from different state (%) - Hispanic or Latino
Geographical mobility - Moved from different state (%) - American Indian and Alaska Native
Geographical mobility - Moved from different state (%) - Multirace
Geographical mobility - Moved from different state (%) - Other Race
Geographical mobility - Moved from abroad (%)
Geographical mobility - Moved from abroad (%) - White
Geographical mobility - Moved from abroad (%) - Black or African American
Geographical mobility - Moved from abroad (%) - Asian
Geographical mobility - Moved from abroad (%) - Hispanic or Latino
Geographical mobility - Moved from abroad (%) - American Indian and Alaska Native
Geographical mobility - Moved from abroad (%) - Multirace
Geographical mobility - Moved from abroad (%) - Other Race
Place of birth for the foreign-born population - Ireland (%)
Place of birth for the foreign-born population - Denmark (%)
Place of birth for the foreign-born population - Norway (%)
Place of birth for the foreign-born population - Sweden (%)
Place of birth for the foreign-born population - United Kingdom (%)
Place of birth for the foreign-born population - England (%)
Place of birth for the foreign-born population - Scotland (%)
Place of birth for the foreign-born population - Other Northern Europe (%)
Place of birth for the foreign-born population - Austria (%)
Place of birth for the foreign-born population - Belgium (%)
Place of birth for the foreign-born population - France (%)
Place of birth for the foreign-born population - Germany (%)
Place of birth for the foreign-born population - Netherlands (%)
Place of birth for the foreign-born population - Switzerland (%)
Place of birth for the foreign-born population - Other Western Europe (%)
Place of birth for the foreign-born population - Greece (%)
Place of birth for the foreign-born population - Italy (%)
Place of birth for the foreign-born population - Portugal (%)
Place of birth for the foreign-born population - Spain (%)
Place of birth for the foreign-born population - Other Southern Europe (%)
Place of birth for the foreign-born population - Albania (%)
Place of birth for the foreign-born population - Belarus (%)
Place of birth for the foreign-born population - Bosnia and Herzegovina (%)
Place of birth for the foreign-born population - Bulgaria (%)
Place of birth for the foreign-born population - Croatia (%)
Place of birth for the foreign-born population - Czechoslovakia (%)
Place of birth for the foreign-born population - Hungary (%)
Place of birth for the foreign-born population - Latvia (%)
Place of birth for the foreign-born population - Lithuania (%)
Place of birth for the foreign-born population - North Macedonia (Macedonia) (%)
Place of birth for the foreign-born population - Moldova (%)
Place of birth for the foreign-born population - Poland (%)
Place of birth for the foreign-born population - Romania (%)
Place of birth for the foreign-born population - Russia (%)
Place of birth for the foreign-born population - Serbia (%)
Place of birth for the foreign-born population - Ukraine (%)
Place of birth for the foreign-born population - Other Eastern Europe (%)
Place of birth for the foreign-born population - China (%)
Place of birth for the foreign-born population - Hong Kong (%)
Place of birth for the foreign-born population - Taiwan (%)
Place of birth for the foreign-born population - Japan (%)
Place of birth for the foreign-born population - Korea (%)
Place of birth for the foreign-born population - Other Eastern Asia (%)
Place of birth for the foreign-born population - Afghanistan (%)
Place of birth for the foreign-born population - Bangladesh (%)
Place of birth for the foreign-born population - India (%)
Place of birth for the foreign-born population - Iran (%)
Place of birth for the foreign-born population - Kazakhstan (%)
Place of birth for the foreign-born population - Nepal (%)
Place of birth for the foreign-born population - Pakistan (%)
Place of birth for the foreign-born population - Sri Lanka (%)
Place of birth for the foreign-born population - Uzbekistan (%)
Place of birth for the foreign-born population - Other South Central Asia (%)
Place of birth for the foreign-born population - Burma (%)
Place of birth for the foreign-born population - Cambodia (%)
Place of birth for the foreign-born population - Indonesia (%)
Place of birth for the foreign-born population - Laos (%)
Place of birth for the foreign-born population - Malaysia (%)
Place of birth for the foreign-born population - Philippines (%)
Place of birth for the foreign-born population - Singapore (%)
Place of birth for the foreign-born population - Thailand (%)
Place of birth for the foreign-born population - Vietnam (%)
Place of birth for the foreign-born population - Other South Eastern Asia (%)
Place of birth for the foreign-born population - Armenia (%)
Place of birth for the foreign-born population - Iraq (%)
Place of birth for the foreign-born population - Israel (%)
Place of birth for the foreign-born population - Jordan (%)
Place of birth for the foreign-born population - Kuwait (%)
Place of birth for the foreign-born population - Lebanon (%)
Place of birth for the foreign-born population - Saudi Arabia (%)
Place of birth for the foreign-born population - Syria (%)
Place of birth for the foreign-born population - Turkey (%)
Place of birth for the foreign-born population - Yemen (%)
Place of birth for the foreign-born population - Other Western Asia (%)
Place of birth for the foreign-born population - Eritrea (%)
Place of birth for the foreign-born population - Ethiopia (%)
Place of birth for the foreign-born population - Kenya (%)
Place of birth for the foreign-born population - Somalia (%)
Place of birth for the foreign-born population - Uganda (%)
Place of birth for the foreign-born population - Zimbabwe (%)
Place of birth for the foreign-born population - Other Eastern Africa (%)
Place of birth for the foreign-born population - Cameroon (%)
Place of birth for the foreign-born population - Congo (%)
Place of birth for the foreign-born population - Democratic Republic of Congo (Zaire) (%)
Place of birth for the foreign-born population - Other Middle Africa (%)
Place of birth for the foreign-born population - Egypt (%)
Place of birth for the foreign-born population - Morocco (%)
Place of birth for the foreign-born population - Sudan (%)
Place of birth for the foreign-born population - Other Northern Africa (%)
Place of birth for the foreign-born population - South Africa (%)
Place of birth for the foreign-born population - Other Southern Africa (%)
Place of birth for the foreign-born population - Cabo Verde (%)
Place of birth for the foreign-born population - Ghana (%)
Place of birth for the foreign-born population - Liberia (%)
Place of birth for the foreign-born population - Nigeria (%)
Place of birth for the foreign-born population - Senegal (%)
Place of birth for the foreign-born population - Sierra Leone (%)
Place of birth for the foreign-born population - Other Western Africa (%)
Place of birth for the foreign-born population - Australia (%)
Place of birth for the foreign-born population - New Zealand (%)
Place of birth for the foreign-born population - Fiji (%)
Place of birth for the foreign-born population - Micronesia (%)
Place of birth for the foreign-born population - Bahamas (%)
Place of birth for the foreign-born population - Barbados (%)
Place of birth for the foreign-born population - Cuba (%)
Place of birth for the foreign-born population - Dominica (%)
Place of birth for the foreign-born population - Dominican Republic (%)
Place of birth for the foreign-born population - Grenada (%)
Place of birth for the foreign-born population - Haiti (%)
Place of birth for the foreign-born population - Jamaica (%)
Place of birth for the foreign-born population - St. Vincent and the Grenadines (%)
Place of birth for the foreign-born population - Trinidad and Tobago (%)
Place of birth for the foreign-born population - West Indies (%)
Place of birth for the foreign-born population - Other Caribbean (%)
Place of birth for the foreign-born population - Belize (%)
Place of birth for the foreign-born population - Costa Rica (%)
Place of birth for the foreign-born population - El Salvador (%)
Place of birth for the foreign-born population - Guatemala (%)
Place of birth for the foreign-born population - Honduras (%)
Place of birth for the foreign-born population - Mexico (%)
Place of birth for the foreign-born population - Nicaragua (%)
Place of birth for the foreign-born population - Panama (%)
Place of birth for the foreign-born population - Other Central America (%)
Place of birth for the foreign-born population - Argentina (%)
Place of birth for the foreign-born population - Bolivia (%)
Place of birth for the foreign-born population - Brazil (%)
Place of birth for the foreign-born population - Chile (%)
Place of birth for the foreign-born population - Colombia (%)
Place of birth for the foreign-born population - Ecuador (%)
Place of birth for the foreign-born population - Guyana (%)
Place of birth for the foreign-born population - Peru (%)
Place of birth for the foreign-born population - Uruguay (%)
Place of birth for the foreign-born population - Venezuela (%)
Place of birth for the foreign-born population - Other South America (%)
Place of birth for the foreign-born population - Canada (%)
Place of birth for the foreign-born population - Other Northern America (%)
Place of birth for the foreign-born population - Other (%)
Latest news about races in Ashland, KY collected exclusively by city-data.com from local newspapers, TV, and radio stations
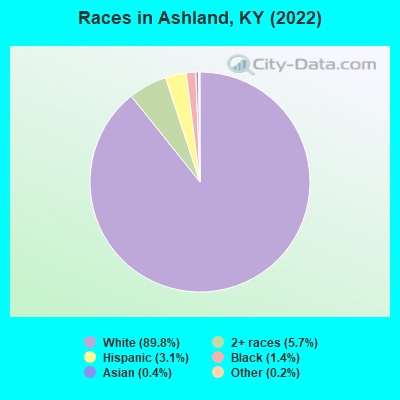
According to 2022 data, the most numerous races in Ashland, KY are White alone (19,384 residents), Black alone (298 residents), and Hispanic (674 residents). 96.3% of Ashland residents speak English at home. 1.4% of Ashland, KY residents are foreign-born , which is 176.8% less than the foreign-born rate of 4.0% across the entire state of Kentucky.
Race distribution in Ashland
2000 2022
3,608,013 89.3% White alone 293,639 7.3% Black alone 59,939 1.5% Hispanic 37,750 0.9% Two or more races 29,368 0.7% Asian alone 7,939 0.2% American Indian alone 3,846 0.10% Other race alone 1,275 0.03% Native Hawaiian and Other
3,710,998 82.2% White alone 343,194 7.6% Black alone 187,483 4.2% Hispanic 187,394 4.2% Two or more races 62,240 1.4% Asian alone 13,529 0.3% Other race alone 4,302 0.10% American Indian alone 3,170 0.07% Native Hawaiian and Other
Income and house value in Ashland Median household income in 2022 $50,874 White non-Hispanic householders$50,230 Black householders$49,716 Some other race householders$50,222 Hispanic or Latino race householdersMedian 2022 house value $135,260 White Non-Hispanic householders$144,492 Black or African American householders$190,649 American Indian or Alaska Native householders $75,256 Asian householders$110,375 Some other race householders$93,117 Two or more races householders$55,187 Hispanic or Latino householders
Median age by race in Ashland
42.2 Median age for White residents39.0 44.2 47.4 Median age for Black or African American residents50.8 23.2 -521,556,256.1 Median age for American Indian / Alaska Native residents-607,449,856.1 -630,065,358.8 38.9 Median age for Asian residents40.7 8.6 -755,186,721.2 Median age for Native Hawaiian / Pacific Islander residents-724,043,715.1 -853,801,168.7 18.5 Median age for Other race residents36.5 15.0 27.1 Median age for Two or more races residents27.8 33.7 42.3 Median age for White alone residents39.1 44.4 17.9 Median age for Hispanic or Latino residents18.1 13.8
Owner/renter occupied households by race in Ashland
House owners and renters - White residents 5,182 60.6% Owner occupied3,371 39.4% Renter occupiedHouse owners and renters - Black or African American residents 14 11.5% Owner occupied110 88.5% Renter occupiedHouse owners and renters - Asian residents 13 76.2% Owner occupied4 23.8% Renter occupiedHouse owners and renters - Native Hawaiian / Pacific Islander residents 2 100.0% Renter occupiedHouse owners and renters - Other race residents 144 100.0% Owner occupiedHouse owners and renters - Two or more races residents 184 50.5% Owner occupied180 49.5% Renter occupiedHouse owners and renters - White alone residents 5,195 60.9% Owner occupied3,335 39.1% Renter occupiedHouse owners and renters - Hispanic or Latino residents 106 58.2% Owner occupied76 41.8% Renter occupied
Language usage in Ashland
English speakers - Total 96.3% of residents of Ashland speak English at home.
2.2% of residents speak Spanish at home 289 63.4% Speak English very well167 36.6% Speak English less than very well1.4% of residents speak other language at home 204 72.3% Speak English very well78 27.7% Speak English less than very well
English speakers - Born in the United States 97.4% of residents of Ashland speak English at home.
1.7% of residents speak Spanish at home 15 12.6% Speak English very well104 87.4% Speak English less than very well0.8% of residents speak other language at home 61 100.0% Speak English very well
English speakers - Native, born elsewhere 81.6% of residents of Ashland speak English at home.
13.9% of residents speak Spanish at home 37 100.0% Speak English very well2.6% of residents speak other language at home 7 100.0% Speak English very well
English speakers - Foreign-born 25.4% of residents of Ashland speak English at home.
36.6% of residents speak Spanish at home 39 38.2% Speak English very well63 61.8% Speak English less than very well38.0% of residents speak other language at home 39 36.8% Speak English very well67 63.2% Speak English less than very well
White (Caucasian) - Speak only English Native:
99.2% (18,164)Foreign-born:
100.0% (51)
White (Caucasian) - Speak another language Native:
0.9% (157)Foreign-born:
18.7% (10)
Asian - Speak another language Native:
100.0% (24)Foreign-born:
100.0% (46)
Other race - Speak only English Native:
18.5% (82)Foreign-born:
14.6% (19)
Other race - Speak another language Native:
73.8% (326)Foreign-born:
85.9% (110)
Two or more races - Speak another language Native:
3.5% (39)Foreign-born:
98.8% (87)
White alone - Speak only English Native:
99.2% (18,110)Foreign-born:
100.0% (50)
Hispanic or Latino - Speak only English Native:
31.0% (158)Foreign-born:
10.8% (12)
Hispanic or Latino - Speak another language Native:
67.5% (343)Foreign-born:
89.1% (102)
Foreign-born residents in Ashland 312 residents are foreign born
This city:
1.4%Kentucky:
4.1%
Marital status for residents in Ashland Marital status - White (Caucasian) population 15 years and over
Males 33.9% Never married47.4% Now married2.8% Separated3.1% Widowed12.8% DivorcedFemales 21.2% Never married39.7% Now married3.3% Separated11.4% Widowed24.4% DivorcedWomen who gave birth in the past 12 months Now married:
34.2% (53)Unmarried:
65.8% (101)
Women who did not give birth in the past 12 months Now married:
42.4% (1,832)Unmarried:
57.6% (2,486)
Marital status - Black or African American population 15 years and over
Males 30.5% Never married20.9% Now married30.5% Separated14.1% Widowed4.0% DivorcedFemales 59.7% Never married18.2% Now married0.0% Separated3.9% Widowed18.2% DivorcedWomen who gave birth in the past 12 months Now married:
0.0% (0)Unmarried:
100.0% (4)
Women who did not give birth in the past 12 months Now married:
7.1% (4)Unmarried:
92.9% (53)
Marital status - Asian population 15 years and over
Males 29.2% Never married70.8% Now married0.0% Separated0.0% Widowed0.0% DivorcedFemales 0.0% Never married100.0% Now married0.0% Separated0.0% Widowed0.0% DivorcedWomen who gave birth in the past 12 months Now married:
100.0% (13)Unmarried:
0.0% (0)
Women who did not give birth in the past 12 months Now married:
100.0% (4)Unmarried:
0.0% (0)
Marital status - Other race population 15 years and over
Males 47.9% Never married52.1% Now married0.0% Separated0.0% Widowed0.0% DivorcedFemales 0.0% Never married100.0% Now married0.0% Separated0.0% Widowed0.0% DivorcedWomen who did not give birth in the past 12 months Now married:
100.0% (120)Unmarried:
0.0% (0)
Marital status - Two or more races population 15 years and over
Males 57.6% Never married33.6% Now married0.0% Separated0.0% Widowed8.8% DivorcedFemales 46.0% Never married28.0% Now married3.3% Separated6.4% Widowed16.3% DivorcedWomen who did not give birth in the past 12 months Now married:
28.7% (100)Unmarried:
71.3% (250)
Marital status - White alone, not Hispanic / Latino population 15 years and over
Males 34.0% Never married47.3% Now married2.8% Separated3.1% Widowed12.9% DivorcedFemales 21.3% Never married39.7% Now married3.3% Separated11.5% Widowed24.2% DivorcedWomen who gave birth in the past 12 months Now married:
34.2% (53)Unmarried:
65.8% (102)
Women who did not give birth in the past 12 months Now married:
42.4% (1,817)Unmarried:
57.6% (2,466)
Marital status - Hispanic or Latino population 15 years and over
Males 42.3% Never married57.7% Now married0.0% Separated0.0% Widowed0.0% DivorcedFemales 3.6% Never married73.7% Now married0.0% Separated0.0% Widowed22.8% DivorcedWomen who did not give birth in the past 12 months Now married:
73.7% (133)Unmarried:
26.3% (48)
Ancestries in Ashland
3,365 32.3% American2,190 21.0% English770 7.4% German763 7.3% Irish599 5.7% Scotch-Irish183 1.8% Italian183 1.8% Scottish164 1.6% European49 0.5% Dutch43 0.4% French42 0.4% British42 0.4% Welsh41 0.4% Romanian19 0.2% Jordanian13 0.1% Polish11 0.1% Danish11 0.1% Swiss9 0.09% Belgian9 0.09% Russian9 0.09% Swedish8 0.08% Ukrainian6 0.06% Eastern European6 0.06% Northern European5 0.05% Greek4 0.04% African1 0.01% Canadian
Geographical mobility in Ashland Same house 1 year ago 16,509 86.0% White (Caucasian)197 66.2% Black or African American6 91.6% American Indian / Alaska Native68 97.9% Asian3 100.0% Native Hawaiian / Pacific Islander612 100.0% Other race1,099 88.9% Two or more races16,498 86.2% White alone, not Hispanic / Latino591 88.0% Hispanic or LatinoMoved within same county 1,312 6.8% White / Caucasian62 20.7% Black or African American1 0.2% Other race95 7.7% Two or more races1,331 7.0% White alone, not Hispanic / Latino1 0.1% Hispanic or LatinoMoved within same state 660 3.4% White / Caucasian23 7.7% Black or African American31 2.5% Two or more races593 3.1% White alone, not Hispanic / Latino78 11.6% Hispanic or LatinoMoved from different state 669 3.5% White / Caucasian11 3.6% Black or African American678 3.5% White alone, not Hispanic / Latino5 0.7% Hispanic or LatinoMoved from abroad 34 0.2% White36 0.2% White alone, not Hispanic / Latino
Children Nativity (place of birth) in Ashland
Children under 6 years - Living with two parents Both parents native 752 100.0% NativeBoth parents foreign-born 15 100.0% NativeOne native, one foreign-born parent 9 28.9% Native21 71.1% Foreign-bornChildren under 6 years - Living with one parent Native parent 597 100.0% Native
Children 6 to 17 years - Living with two parents Both parents native 1,392 100.0% NativeBoth parents foreign-born 122 100.0% NativeOne native, one foreign-born parent 23 100.0% NativeChildren 6 to 17 years - Living with one parent Native parent 1,748 100.0% Native
Grandparents responsible for own grandchildren in Ashland
Grandparents (30 to 59 years) White / Caucasian 165 63.1% Responsible for grandchildren96 36.9% Not responsible for grandchildrenWhite alone, not Hispanic / Latino 165 62.8% Responsible for grandchildren98 37.2% Not responsible for grandchildrenGrandparents (60 years and over) White / Caucasian 113 42.4% Responsible for grandchildren154 57.6% Not responsible for grandchildrenWhite alone, not Hispanic / Latino 114 42.2% Responsible for grandchildren156 57.8% Not responsible for grandchildren