Races in Astoria, Oregon (OR) Detailed Stats
Ancestries, Foreign-born residents, place of birth
Settings
X


Recent posts about races in Astoria, Oregon on our local forum with over 2,400,000 registered users:
 | What ethnic heritage do you associate most with Oregon? (39 replies) |
| How Has The Winter Climate Been Lately? (39 replies) |
| Summer Trip (30 replies) |
| Looking for rental house in Astoria (4 replies) |
| For those who have lived in CA and OR (72 replies) |
| help please, medford or astoria, which is better? (59 replies) |
Latest news about races in Astoria, OR collected exclusively by city-data.com from local newspapers, TV, and radio stations
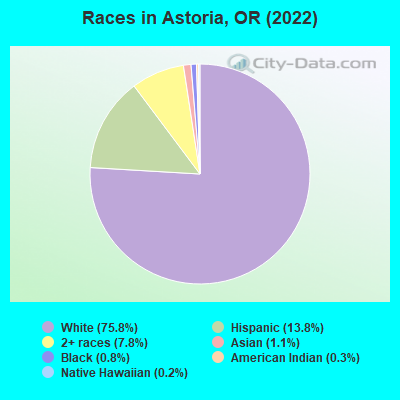
According to 2022 data, the most numerous races in Astoria, OR are White alone (7,743 residents), Hispanic (1,412 residents), and Two or more races (798 residents). 93.3% of Astoria residents speak English at home. 5.9% of Astoria, OR residents are foreign-born (2.9% born in Latin America, 1.6% born in Europe, 0.9% born in Asia), which is 53.4% less than the foreign-born rate of 9.0% across the entire state of Oregon.
Race distribution in Astoria
2000
2022

- 8,68388.5%White alone
- 5876.0%Hispanic
- 1992.0%Two or more races
- 1851.9%Asian alone
- 1051.1%American Indian alone
- 320.3%Black alone
- 170.2%Native Hawaiian and Other
Pacific Islander alone - 50.05%Other race alone

-
- 7,74375.8%White alone
- 1,41213.8%Hispanic
- 7987.8%Two or more races
- 1121.1%Asian alone
- 800.8%Black alone
- 260.3%American Indian alone
- 170.2%Native Hawaiian and Other
Pacific Islander alone
2000
2022
-
- 2,857,61683.5%White alone
- 275,3148.0%Hispanic
- 100,3332.9%Asian alone
- 82,7332.4%Two or more races
- 53,3251.6%Black alone
- 40,1301.2%American Indian alone
- 7,3980.2%Native Hawaiian and Other
Pacific Islander alone - 4,5500.1%Other race alone

-
- 3,037,57171.6%White alone
- 609,53814.4%Hispanic
- 252,7446.0%Two or more races
- 191,2834.5%Asian alone
- 78,2281.8%Black alone
- 29,3990.7%American Indian alone
- 25,7310.6%Other race alone
- 15,6430.4%Native Hawaiian and Other
Pacific Islander alone

Income and house value in Astoria
- Median household income in 2022
- $67,368White non-Hispanic householders
- $48,800Asian householders
- $163,802Some other race householders
- $85,856Two or more races householders
- $108,603Hispanic or Latino race householders
- Median 2022 house value
- $430,203White Non-Hispanic householders
- $456,075American Indian or Alaska Native householders
- $912,151Asian householders
- $371,162Some other race householders
- $538,998Two or more races householders
- $372,157Hispanic or Latino householders
Household income for White non-Hispanic householders

Household income for American Indian and Alaska Native householders

Household income for Asian householders

Household income for Some other race householders

Household income for Two or more races householders

Household income for Hispanic or Latino race householders

Median age by race in Astoria
- 44.3Median age for White residents
- 42.7Males
- 47.6Females
- 27.4Median age for Black or African American residents
- 61.0Males
- 25.6Females
- 34.5Median age for American Indian / Alaska Native residents
- 32.6Males
- -752,688,171.3Females
- 29.0Median age for Asian residents
- 28.9Males
- 28.6Females
- -764,705,881.6Median age for Native Hawaiian / Pacific Islander residents
- -764,119,600.6Males
- -774,891,774.1Females
- 46.2Median age for Other race residents
- 14.2Males
- 46.8Females
- 31.5Median age for Two or more races residents
- 31.6Males
- 23.8Females
- 46.8Median age for White alone residents
- 44.5Males
- 50.5Females
- 15.5Median age for Hispanic or Latino residents
- 12.0Males
- 30.9Females
Owner/renter occupied households by race in Astoria
- House owners and renters - White residents
- 1,98952.0%Owner occupied
- 1,83248.0%Renter occupied
- House owners and renters - Black or African American residents
- 417.0%Owner occupied
- 2083.0%Renter occupied
- House owners and renters - American Indian / Alaska Native residents
- 246.8%Owner occupied
- 253.2%Renter occupied
- House owners and renters - Asian residents
- 1723.3%Owner occupied
- 5676.7%Renter occupied
- House owners and renters - Other race residents
- 20372.0%Owner occupied
- 7928.0%Renter occupied
- House owners and renters - Two or more races residents
- 16250.3%Owner occupied
- 16049.7%Renter occupied
- House owners and renters - White alone residents
- 2,00253.2%Owner occupied
- 1,76346.8%Renter occupied
- House owners and renters - Hispanic or Latino residents
- 17945.9%Owner occupied
- 21154.1%Renter occupied
Language usage in Astoria
- English speakers - Total
- 93.3% of residents of Astoria speak English at home.
- 4.2% of residents speak Spanish at home
- 35087.7%Speak English very well
- 4912.3%Speak English less than very well
- 2.4% of residents speak other language at home
- 16170.3%Speak English very well
- 6829.7%Speak English less than very well
- English speakers - Born in the United States
- 95.8% of residents of Astoria speak English at home.
- 2.6% of residents speak Spanish at home
- 12591.2%Speak English very well
- 128.8%Speak English less than very well
- 1.5% of residents speak other language at home
- 6987.3%Speak English very well
- 1012.7%Speak English less than very well
All residents speak only English at home
- English speakers - Foreign-born
- 50.8% of residents of Astoria speak English at home.
- 26.0% of residents speak Spanish at home
- 12076.9%Speak English very well
- 3623.1%Speak English less than very well
- 23.3% of residents speak other language at home
- 8762.1%Speak English very well
- 5337.9%Speak English less than very well
White (Caucasian) - Speak only English
| Native: | 98.4% (7,472) |
| Foreign-born: | 60.8% (133) |
White (Caucasian) - Speak another language
| Native: | 2.0% (152) |
| Foreign-born: | 46.1% (101) |
Other race - Speak only English
| Native: | 88.7% (153) |
| Foreign-born: | 62.5% (178) |
Other race - Speak another language
| Native: | 17.5% (30) |
| Foreign-born: | 36.9% (105) |
Two or more races - Speak only English
| Native: | 85.5% (821) |
| Foreign-born: | 74.9% (25) |
Two or more races - Speak another language
| Native: | 14.0% (135) |
| Foreign-born: | 22.8% (8) |
White alone - Speak only English
| Native: | 97.3% (6,931) |
| Foreign-born: | 59.0% (129) |
White alone - Speak another language
| Native: | 2.7% (193) |
| Foreign-born: | 41.5% (90) |
Hispanic or Latino - Speak only English
| Native: | 90.6% (813) |
| Foreign-born: | 53.8% (171) |
Hispanic or Latino - Speak another language
| Native: | 12.1% (109) |
| Foreign-born: | 50.0% (159) |
Foreign-born residents in Astoria
599 residents are foreign born (2.9% Latin America, 1.6% Europe, 0.9% Asia).
| This city: | 5.9% |
| Oregon: | 9.8% |


Marital status for residents in Astoria
Marital status - White (Caucasian) population 15 years and over
- Males
- 29.3%Never married
- 52.0%Now married
- 1.5%Separated
- 4.4%Widowed
- 12.7%Divorced
- Females
- 19.0%Never married
- 46.0%Now married
- 3.2%Separated
- 8.0%Widowed
- 23.7%Divorced
Women who gave birth in the past 12 months
| Now married: | 100.0% (92) |
| Unmarried: | 0.0% (0) |
Women who did not give birth in the past 12 months
| Now married: | 49.2% (737) |
| Unmarried: | 50.8% (762) |
Marital status - Black or African American population 15 years and over
- Males
- 23.1%Never married
- 0.0%Now married
- 0.0%Separated
- 38.5%Widowed
- 38.5%Divorced
- Females
- 69.2%Never married
- 0.0%Now married
- 0.0%Separated
- 0.0%Widowed
- 30.8%Divorced
Women who did not give birth in the past 12 months
| Now married: | 0.0% (0) |
| Unmarried: | 100.0% (48) |
Marital status - American Indian / Alaska Native population 15 years and over
- Males
- 97.3%Never married
- 2.7%Now married
- 0.0%Separated
- 0.0%Widowed
- 0.0%Divorced
- Females
- 66.7%Never married
- 33.3%Now married
- 0.0%Separated
- 0.0%Widowed
- 0.0%Divorced
Women who did not give birth in the past 12 months
| Now married: | 0.0% (0) |
| Unmarried: | 100.0% (2) |
Marital status - Asian population 15 years and over
- Males
- 79.5%Never married
- 20.5%Now married
- 0.0%Separated
- 0.0%Widowed
- 0.0%Divorced
- Females
- 70.8%Never married
- 29.2%Now married
- 0.0%Separated
- 0.0%Widowed
- 0.0%Divorced
Women who did not give birth in the past 12 months
| Now married: | 0.0% (0) |
| Unmarried: | 100.0% (34) |
Marital status - Native Hawaiian / Pacific Islander population 15 years and over
- Males
- 100.0%Never married
- 0.0%Now married
- 0.0%Separated
- 0.0%Widowed
- 0.0%Divorced
- Females
- 100.0%Never married
- 0.0%Now married
- 0.0%Separated
- 0.0%Widowed
- 0.0%Divorced
Women who did not give birth in the past 12 months
| Now married: | 0.0% (0) |
| Unmarried: | 100.0% (11) |
Marital status - Other race population 15 years and over
- Males
- 50.0%Never married
- 4.0%Now married
- 0.0%Separated
- 0.0%Widowed
- 46.0%Divorced
- Females
- 2.5%Never married
- 97.5%Now married
- 0.0%Separated
- 0.0%Widowed
- 0.0%Divorced
Women who did not give birth in the past 12 months
| Now married: | 97.0% (219) |
| Unmarried: | 3.0% (7) |
Marital status - Two or more races population 15 years and over
- Males
- 47.2%Never married
- 52.8%Now married
- 0.0%Separated
- 0.0%Widowed
- 0.0%Divorced
- Females
- 43.6%Never married
- 28.6%Now married
- 2.0%Separated
- 16.1%Widowed
- 9.6%Divorced
Women who did not give birth in the past 12 months
| Now married: | 28.8% (87) |
| Unmarried: | 71.2% (214) |
Marital status - White alone, not Hispanic / Latino population 15 years and over
- Males
- 30.5%Never married
- 50.6%Now married
- 1.6%Separated
- 4.6%Widowed
- 12.7%Divorced
- Females
- 19.4%Never married
- 46.6%Now married
- 3.2%Separated
- 8.4%Widowed
- 22.4%Divorced
Women who gave birth in the past 12 months
| Now married: | 100.0% (96) |
| Unmarried: | 0.0% (0) |
Women who did not give birth in the past 12 months
| Now married: | 50.8% (747) |
| Unmarried: | 49.2% (724) |
Marital status - Hispanic or Latino population 15 years and over
- Males
- 30.5%Never married
- 52.6%Now married
- 0.0%Separated
- 0.0%Widowed
- 16.9%Divorced
- Females
- 11.3%Never married
- 61.9%Now married
- 2.7%Separated
- 0.0%Widowed
- 24.1%Divorced
Women who did not give birth in the past 12 months
| Now married: | 65.7% (196) |
| Unmarried: | 34.3% (102) |
Ancestries in Astoria

- 51312.0%English
- 49011.4%American
- 43410.1%Irish
- 3808.9%German
- 2165.0%European
- 2114.9%Norwegian
- 1393.2%Scandinavian
- 852.0%Cajun
- 831.9%Dutch
- 761.8%Swedish
- 701.6%Danish
- 691.6%Italian
- 691.6%Scottish
- 611.4%Greek
- 571.3%Finnish
- 541.3%Polish
- 441.0%Slavic
- 431.0%Scotch-Irish
- 380.9%French Canadian
- 290.7%Iranian
- 280.7%Canadian
- 280.7%Portuguese
- 270.6%British
- 270.6%Northern European
- 220.5%Australian
- 160.4%French
- 90.2%Eastern European
- 80.2%Yugoslavian
- 60.1%Basque
- 10.02%African
- 10.02%Welsh

Geographical mobility in Astoria

- Same house 1 year ago
- 6,51878.8%White (Caucasian)
- 5365.5%Black or African American
- 3272.0%American Indian / Alaska Native
- 5650.1%Asian
- 846.6%Native Hawaiian / Pacific Islander
- 462100.0%Other race
- 72569.9%Two or more races
- 6,32582.5%White alone, not Hispanic / Latino
- 88362.5%Hispanic or Latino

-
- Moved within same county
- 6638.0%White / Caucasian
- 2320.5%Asian
- 16315.7%Two or more races
- 6808.9%White alone, not Hispanic / Latino
- 110.8%Hispanic or Latino

-
- Moved within same state
- 7779.4%White / Caucasian
- 2825.3%Asian
- 212.0%Two or more races
- 3594.7%White alone, not Hispanic / Latino
- 40428.6%Hispanic or Latino

-
- Moved from different state
- 3434.1%White / Caucasian
- 2935.5%Black or African American
- 1330.2%American Indian / Alaska Native
- 422.5%Native Hawaiian / Pacific Islander
- 11310.9%Two or more races
- 2923.8%White alone, not Hispanic / Latino
- 1087.6%Hispanic or Latino

Children Nativity (place of birth) in Astoria
Place of birth for residents in Astoria
![Place of birth for the foreign-born population - Regions]()
- 310Americas
- 301Latin America
- 194Central America
- 163Europe
- 89Asia
- 83Northern Europe
- 80South Central Asia
- 57South America
- 49Caribbean
- 34Southern Europe
- 25Eastern Europe
- 19Western Europe
- 18Oceania
- 18Australia and New Zealand Subregion
- 17Africa
- 17Western Africa
- 9Eastern Asia
- 9Northern America
- 2China

![Place of birth for the foreign-born population - Countries]()
- 191Mexico
- 43India
- 43Chile
- 37Dominican Republic
- 36Iran
- 34Greece
- 28Sweden
- 20United Kingdom
- 19Germany
- 18Australia
- 17England
- 17Scotland
- 17Cabo Verde
- 15Ukraine
- 13Colombia
- 12Cuba
- 10Poland
- 9Canada
- 7Korea
- 3Nicaragua
- 2China

Grandparents responsible for own grandchildren in Astoria
Zip codes: 97103.