Races in Audubon, New Jersey (NJ) Detailed Stats
Data:
Races - White alone (%)
Races - White alone (% change since 2000)
Races - Black alone (%)
Races - Black alone (% change since 2000)
Races - American Indian alone (%)
Races - American Indian alone (% change since 2000)
Races - Asian alone (%)
Races - Asian alone (% change since 2000)
Races - Hispanic (%)
Races - Hispanic (% change since 2000)
Races - Native Hawaiian and Other Pacific Islander alone (%)
Races - Native Hawaiian and Other Pacific Islander alone (% change since 2000)
Races - Two or more races(%)
Races - Two or more races(% change since 2000)
Races - Other race alone (%)
Races - Other race alone (% change since 2000)
Racial diversity
Place of birth - Born in state of residence (%)
Place of birth - Born in state of residence (%) - White
Place of birth - Born in state of residence (%) - Black or African American
Place of birth - Born in state of residence (%) - Asian
Place of birth - Born in state of residence (%) - Hispanic or Latino
Place of birth - Born in state of residence (%) - American Indian and Alaska Native
Place of birth - Born in state of residence (%) - Multirace
Place of birth - Born in state of residence (%) - Other Race
Place of birth - Born in other state (%)
Place of birth - Born in other state (%) - White
Place of birth - Born in other state (%) - Black or African American
Place of birth - Born in other state (%) - Asian
Place of birth - Born in other state (%) - Hispanic or Latino
Place of birth - Born in other state (%) - American Indian and Alaska Native
Place of birth - Born in other state (%) - Multirace
Place of birth - Born in other state (%) - Other Race
Place of birth - Native, outside of US (%)
Place of birth - Native, outside of US (%) - White
Place of birth - Native, outside of US (%) - Black or African American
Place of birth - Native, outside of US (%) - Asian
Place of birth - Native, outside of US (%) - Hispanic or Latino
Place of birth - Native, outside of US (%) - American Indian and Alaska Native
Place of birth - Native, outside of US (%) - Multirace
Place of birth - Native, outside of US (%) - Other Race
Place of birth - Foreign born (%)
Place of birth - Foreign born (%) - White
Place of birth - Foreign born (%) - Black or African American
Place of birth - Foreign born (%) - Asian
Place of birth - Foreign born (%) - Hispanic or Latino
Place of birth - Foreign born (%) - American Indian and Alaska Native
Place of birth - Foreign born (%) - Multirace
Place of birth - Foreign born (%) - Other Race
Residents speaking English at home (%)
Residents speaking English at home - Born in the United States (%)
Residents speaking English at home - Native, born elsewhere (%)
Residents speaking English at home - Foreign born (%)
Residents speaking Spanish at home (%)
Residents speaking Spanish at home - Born in the United States (%)
Residents speaking Spanish at home - Native, born elsewhere (%)
Residents speaking Spanish at home - Foreign born (%)
Residents speaking other language at home (%)
Residents speaking other language at home - Born in the United States (%)
Residents speaking other language at home - Native, born elsewhere (%)
Residents speaking other language at home - Foreign born (%)
Marital status - Never married (%)
Marital status - Now married (%)
Marital status - Separated (%)
Marital status - Widowed (%)
Marital status - Divorced (%)
Ancestries Reported - Arab (%)
Ancestries Reported - Czech (%)
Ancestries Reported - Danish (%)
Ancestries Reported - Dutch (%)
Ancestries Reported - English (%)
Ancestries Reported - French (%)
Ancestries Reported - French Canadian (%)
Ancestries Reported - German (%)
Ancestries Reported - Greek (%)
Ancestries Reported - Hungarian (%)
Ancestries Reported - Irish (%)
Ancestries Reported - Italian (%)
Ancestries Reported - Lithuanian (%)
Ancestries Reported - Norwegian (%)
Ancestries Reported - Polish (%)
Ancestries Reported - Portuguese (%)
Ancestries Reported - Russian (%)
Ancestries Reported - Scotch-Irish (%)
Ancestries Reported - Scottish (%)
Ancestries Reported - Slovak (%)
Ancestries Reported - Subsaharan African (%)
Ancestries Reported - Swedish (%)
Ancestries Reported - Swiss (%)
Ancestries Reported - Ukrainian (%)
Ancestries Reported - United States (%)
Ancestries Reported - Welsh (%)
Ancestries Reported - West Indian (%)
Ancestries Reported - Other (%)
Geographical mobility - Same house 1 year ago (%)
Geographical mobility - Same house 1 year ago (%) - White
Geographical mobility - Same house 1 year ago (%) - Black or African American
Geographical mobility - Same house 1 year ago (%) - Asian
Geographical mobility - Same house 1 year ago (%) - Hispanic or Latino
Geographical mobility - Same house 1 year ago (%) - American Indian and Alaska Native
Geographical mobility - Same house 1 year ago (%) - Multirace
Geographical mobility - Same house 1 year ago (%) - Other Race
Geographical mobility - Moved within same county (%)
Geographical mobility - Moved within same county (%) - White
Geographical mobility - Moved within same county (%) - Black or African American
Geographical mobility - Moved within same county (%) - Asian
Geographical mobility - Moved within same county (%) - Hispanic or Latino
Geographical mobility - Moved within same county (%) - American Indian and Alaska Native
Geographical mobility - Moved within same county (%) - Multirace
Geographical mobility - Moved within same county (%) - Other Race
Geographical mobility - Moved from different county within same state (%)
Geographical mobility - Moved from different county within same state (%) - White
Geographical mobility - Moved from different county within same state (%) - Black or African American
Geographical mobility - Moved from different county within same state (%) - Asian
Geographical mobility - Moved from different county within same state (%) - Hispanic or Latino
Geographical mobility - Moved from different county within same state (%) - American Indian and Alaska Native
Geographical mobility - Moved from different county within same state (%) - Multirace
Geographical mobility - Moved from different county within same state (%) - Other Race
Geographical mobility - Moved from different state (%)
Geographical mobility - Moved from different state (%) - White
Geographical mobility - Moved from different state (%) - Black or African American
Geographical mobility - Moved from different state (%) - Asian
Geographical mobility - Moved from different state (%) - Hispanic or Latino
Geographical mobility - Moved from different state (%) - American Indian and Alaska Native
Geographical mobility - Moved from different state (%) - Multirace
Geographical mobility - Moved from different state (%) - Other Race
Geographical mobility - Moved from abroad (%)
Geographical mobility - Moved from abroad (%) - White
Geographical mobility - Moved from abroad (%) - Black or African American
Geographical mobility - Moved from abroad (%) - Asian
Geographical mobility - Moved from abroad (%) - Hispanic or Latino
Geographical mobility - Moved from abroad (%) - American Indian and Alaska Native
Geographical mobility - Moved from abroad (%) - Multirace
Geographical mobility - Moved from abroad (%) - Other Race
Place of birth for the foreign-born population - Ireland (%)
Place of birth for the foreign-born population - Denmark (%)
Place of birth for the foreign-born population - Norway (%)
Place of birth for the foreign-born population - Sweden (%)
Place of birth for the foreign-born population - United Kingdom (%)
Place of birth for the foreign-born population - England (%)
Place of birth for the foreign-born population - Scotland (%)
Place of birth for the foreign-born population - Other Northern Europe (%)
Place of birth for the foreign-born population - Austria (%)
Place of birth for the foreign-born population - Belgium (%)
Place of birth for the foreign-born population - France (%)
Place of birth for the foreign-born population - Germany (%)
Place of birth for the foreign-born population - Netherlands (%)
Place of birth for the foreign-born population - Switzerland (%)
Place of birth for the foreign-born population - Other Western Europe (%)
Place of birth for the foreign-born population - Greece (%)
Place of birth for the foreign-born population - Italy (%)
Place of birth for the foreign-born population - Portugal (%)
Place of birth for the foreign-born population - Spain (%)
Place of birth for the foreign-born population - Other Southern Europe (%)
Place of birth for the foreign-born population - Albania (%)
Place of birth for the foreign-born population - Belarus (%)
Place of birth for the foreign-born population - Bosnia and Herzegovina (%)
Place of birth for the foreign-born population - Bulgaria (%)
Place of birth for the foreign-born population - Croatia (%)
Place of birth for the foreign-born population - Czechoslovakia (%)
Place of birth for the foreign-born population - Hungary (%)
Place of birth for the foreign-born population - Latvia (%)
Place of birth for the foreign-born population - Lithuania (%)
Place of birth for the foreign-born population - North Macedonia (Macedonia) (%)
Place of birth for the foreign-born population - Moldova (%)
Place of birth for the foreign-born population - Poland (%)
Place of birth for the foreign-born population - Romania (%)
Place of birth for the foreign-born population - Russia (%)
Place of birth for the foreign-born population - Serbia (%)
Place of birth for the foreign-born population - Ukraine (%)
Place of birth for the foreign-born population - Other Eastern Europe (%)
Place of birth for the foreign-born population - China (%)
Place of birth for the foreign-born population - Hong Kong (%)
Place of birth for the foreign-born population - Taiwan (%)
Place of birth for the foreign-born population - Japan (%)
Place of birth for the foreign-born population - Korea (%)
Place of birth for the foreign-born population - Other Eastern Asia (%)
Place of birth for the foreign-born population - Afghanistan (%)
Place of birth for the foreign-born population - Bangladesh (%)
Place of birth for the foreign-born population - India (%)
Place of birth for the foreign-born population - Iran (%)
Place of birth for the foreign-born population - Kazakhstan (%)
Place of birth for the foreign-born population - Nepal (%)
Place of birth for the foreign-born population - Pakistan (%)
Place of birth for the foreign-born population - Sri Lanka (%)
Place of birth for the foreign-born population - Uzbekistan (%)
Place of birth for the foreign-born population - Other South Central Asia (%)
Place of birth for the foreign-born population - Burma (%)
Place of birth for the foreign-born population - Cambodia (%)
Place of birth for the foreign-born population - Indonesia (%)
Place of birth for the foreign-born population - Laos (%)
Place of birth for the foreign-born population - Malaysia (%)
Place of birth for the foreign-born population - Philippines (%)
Place of birth for the foreign-born population - Singapore (%)
Place of birth for the foreign-born population - Thailand (%)
Place of birth for the foreign-born population - Vietnam (%)
Place of birth for the foreign-born population - Other South Eastern Asia (%)
Place of birth for the foreign-born population - Armenia (%)
Place of birth for the foreign-born population - Iraq (%)
Place of birth for the foreign-born population - Israel (%)
Place of birth for the foreign-born population - Jordan (%)
Place of birth for the foreign-born population - Kuwait (%)
Place of birth for the foreign-born population - Lebanon (%)
Place of birth for the foreign-born population - Saudi Arabia (%)
Place of birth for the foreign-born population - Syria (%)
Place of birth for the foreign-born population - Turkey (%)
Place of birth for the foreign-born population - Yemen (%)
Place of birth for the foreign-born population - Other Western Asia (%)
Place of birth for the foreign-born population - Eritrea (%)
Place of birth for the foreign-born population - Ethiopia (%)
Place of birth for the foreign-born population - Kenya (%)
Place of birth for the foreign-born population - Somalia (%)
Place of birth for the foreign-born population - Uganda (%)
Place of birth for the foreign-born population - Zimbabwe (%)
Place of birth for the foreign-born population - Other Eastern Africa (%)
Place of birth for the foreign-born population - Cameroon (%)
Place of birth for the foreign-born population - Congo (%)
Place of birth for the foreign-born population - Democratic Republic of Congo (Zaire) (%)
Place of birth for the foreign-born population - Other Middle Africa (%)
Place of birth for the foreign-born population - Egypt (%)
Place of birth for the foreign-born population - Morocco (%)
Place of birth for the foreign-born population - Sudan (%)
Place of birth for the foreign-born population - Other Northern Africa (%)
Place of birth for the foreign-born population - South Africa (%)
Place of birth for the foreign-born population - Other Southern Africa (%)
Place of birth for the foreign-born population - Cabo Verde (%)
Place of birth for the foreign-born population - Ghana (%)
Place of birth for the foreign-born population - Liberia (%)
Place of birth for the foreign-born population - Nigeria (%)
Place of birth for the foreign-born population - Senegal (%)
Place of birth for the foreign-born population - Sierra Leone (%)
Place of birth for the foreign-born population - Other Western Africa (%)
Place of birth for the foreign-born population - Australia (%)
Place of birth for the foreign-born population - New Zealand (%)
Place of birth for the foreign-born population - Fiji (%)
Place of birth for the foreign-born population - Micronesia (%)
Place of birth for the foreign-born population - Bahamas (%)
Place of birth for the foreign-born population - Barbados (%)
Place of birth for the foreign-born population - Cuba (%)
Place of birth for the foreign-born population - Dominica (%)
Place of birth for the foreign-born population - Dominican Republic (%)
Place of birth for the foreign-born population - Grenada (%)
Place of birth for the foreign-born population - Haiti (%)
Place of birth for the foreign-born population - Jamaica (%)
Place of birth for the foreign-born population - St. Vincent and the Grenadines (%)
Place of birth for the foreign-born population - Trinidad and Tobago (%)
Place of birth for the foreign-born population - West Indies (%)
Place of birth for the foreign-born population - Other Caribbean (%)
Place of birth for the foreign-born population - Belize (%)
Place of birth for the foreign-born population - Costa Rica (%)
Place of birth for the foreign-born population - El Salvador (%)
Place of birth for the foreign-born population - Guatemala (%)
Place of birth for the foreign-born population - Honduras (%)
Place of birth for the foreign-born population - Mexico (%)
Place of birth for the foreign-born population - Nicaragua (%)
Place of birth for the foreign-born population - Panama (%)
Place of birth for the foreign-born population - Other Central America (%)
Place of birth for the foreign-born population - Argentina (%)
Place of birth for the foreign-born population - Bolivia (%)
Place of birth for the foreign-born population - Brazil (%)
Place of birth for the foreign-born population - Chile (%)
Place of birth for the foreign-born population - Colombia (%)
Place of birth for the foreign-born population - Ecuador (%)
Place of birth for the foreign-born population - Guyana (%)
Place of birth for the foreign-born population - Peru (%)
Place of birth for the foreign-born population - Uruguay (%)
Place of birth for the foreign-born population - Venezuela (%)
Place of birth for the foreign-born population - Other South America (%)
Place of birth for the foreign-born population - Canada (%)
Place of birth for the foreign-born population - Other Northern America (%)
Place of birth for the foreign-born population - Other (%)
Latest news about races in Audubon, NJ collected exclusively by city-data.com from local newspapers, TV, and radio stations
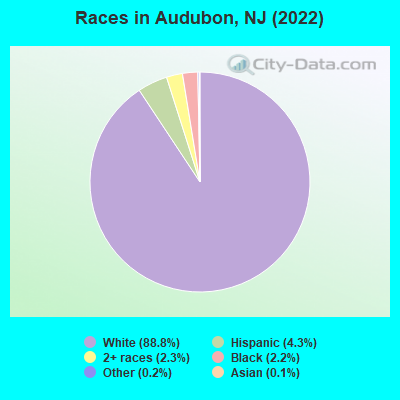
According to 2022 data, the most numerous races in Audubon, NJ are White alone (7,756 residents), Hispanic (372 residents), and Black alone (193 residents). 93.7% of Audubon residents speak English at home. 2.6% of Audubon, NJ residents are foreign-born (1.6% born in Europe, 0.8% born in Latin America), which is 788.9% less than the foreign-born rate of 23.0% across the entire state of New Jersey.
Race distribution in Audubon
2000 2022
5,557,209 66.0% White alone 1,117,191 13.3% Hispanic 1,096,171 13.0% Black alone 477,012 5.7% Asian alone 133,689 1.6% Two or more races 19,565 0.2% Other race alone 11,338 0.1% American Indian alone 2,175 0.03% Native Hawaiian and Other
4,766,476 51.5% White alone 2,028,470 21.9% Hispanic 1,111,632 12.0% Black alone 923,546 10.0% Asian alone 332,237 3.6% Two or more races 89,847 1.0% Other race alone 8,557 0.09% American Indian alone 934 0.01% Native Hawaiian and Other
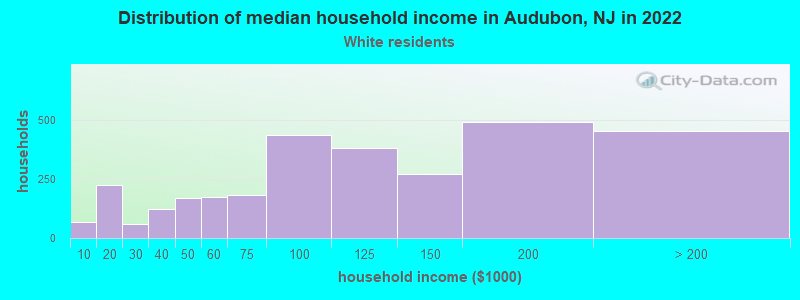
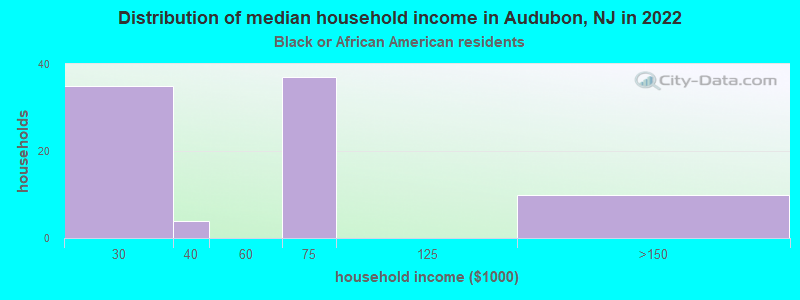
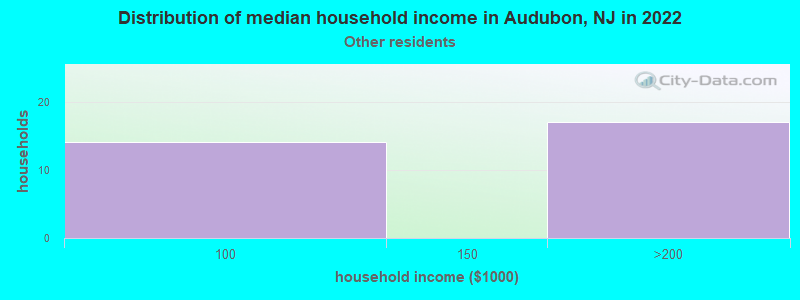
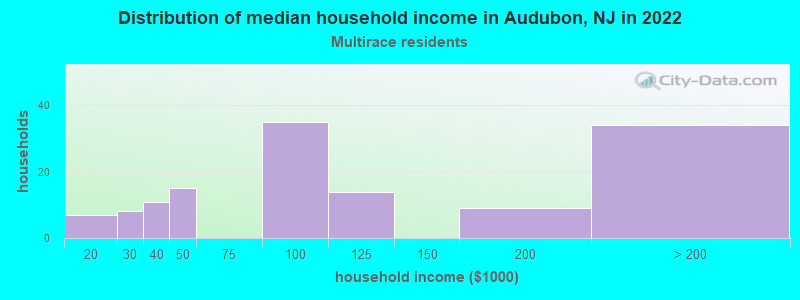
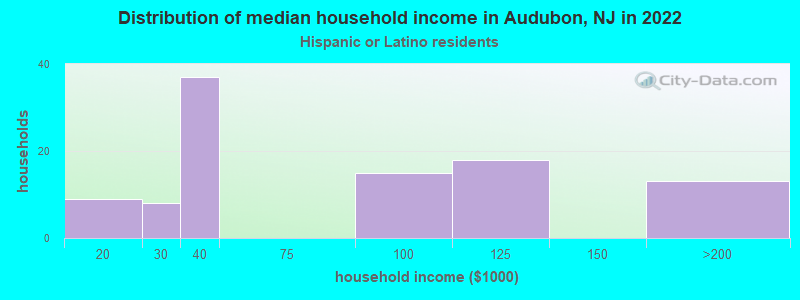
Income and house value in Audubon Median household income in 2022 $102,108 White non-Hispanic householders$62,196 Black householders$86,268 Two or more races householdersMedian 2022 house value $316,316 White Non-Hispanic householders$36,746 Black or African American householders $100,833 Asian householders$330,721 Some other race householders$279,275 Two or more races householders$249,878 Hispanic or Latino householders
Median age by race in Audubon
38.6 Median age for White residents37.4 42.6 23.7 Median age for Black or African American residents21.3 44.4 -676,272,813.9 Median age for American Indian / Alaska Native residents-670,465,336.5 -688,298,917.7 46.6 Median age for Asian residents-689,473,683.5 -728,799,327.6 -701,509,871.5 Median age for Native Hawaiian / Pacific Islander residents-860,335,194.7 -668,881,505.4 19.3 Median age for Other race residents19.5 37.2 36.4 Median age for Two or more races residents42.9 36.6 38.9 Median age for White alone residents37.1 43.2 22.9 Median age for Hispanic or Latino residents4.6 37.7
Owner/renter occupied households by race in Audubon
House owners and renters - White residents 2,372 77.6% Owner occupied685 22.4% Renter occupiedHouse owners and renters - Black or African American residents 85 100.0% Renter occupiedHouse owners and renters - American Indian / Alaska Native residents 13 100.0% Renter occupiedHouse owners and renters - Asian residents 10 100.0% Owner occupiedHouse owners and renters - Other race residents 9 29.2% Owner occupied23 70.8% Renter occupiedHouse owners and renters - Two or more races residents 70 48.9% Owner occupied73 51.1% Renter occupiedHouse owners and renters - White alone residents 2,392 77.3% Owner occupied702 22.7% Renter occupiedHouse owners and renters - Hispanic or Latino residents 19 19.6% Owner occupied78 80.4% Renter occupied
Language usage in Audubon
English speakers - Total 93.7% of residents of Audubon speak English at home.
3.4% of residents speak Spanish at home 176 64.2% Speak English very well98 35.8% Speak English less than very well2.2% of residents speak other language at home 168 95.5% Speak English very well8 4.5% Speak English less than very well
English speakers - Born in the United States 96.9% of residents of Audubon speak English at home.
2.2% of residents speak Spanish at home 48 81.4% Speak English very well11 18.6% Speak English less than very well1.3% of residents speak other language at home 36 100.0% Speak English very well
English speakers - Native, born elsewhere 78.9% of residents of Audubon speak English at home.
18.4% of residents speak Spanish at home 6 42.9% Speak English very well8 57.1% Speak English less than very well
English speakers - Foreign-born 40.5% of residents of Audubon speak English at home.
33.2% of residents speak Spanish at home 23 29.9% Speak English very well54 70.1% Speak English less than very well22.8% of residents speak other language at home 45 84.9% Speak English very well8 15.1% Speak English less than very well
White (Caucasian) - Speak only English Native:
97.6% (6,917)Foreign-born:
49.4% (55)
White (Caucasian) - Speak another language Native:
2.6% (187)Foreign-born:
49.6% (55)
Other race - Speak another language Native:
96.6% (79)Foreign-born:
99.7% (36)
Two or more races - Speak only English Native:
88.7% (183)Foreign-born:
21.3% (6)
Two or more races - Speak another language Native:
13.2% (27)Foreign-born:
63.5% (18)
White alone - Speak only English Native:
97.0% (6,930)Foreign-born:
58.3% (63)
White alone - Speak another language Native:
2.9% (205)Foreign-born:
38.5% (42)
Hispanic or Latino - Speak only English Native:
28.7% (58)Foreign-born:
7.4% (6)
Hispanic or Latino - Speak another language Native:
71.8% (145)Foreign-born:
92.0% (78)
Foreign-born residents in Audubon 226 residents are foreign born (1.6% Europe , 0.8% Latin America ).
This city:
2.6%New Jersey:
23.2%
Marital status for residents in Audubon Marital status - White (Caucasian) population 15 years and over
Males 36.3% Never married52.0% Now married1.7% Separated2.9% Widowed7.0% DivorcedFemales 28.0% Never married45.4% Now married1.3% Separated7.1% Widowed18.2% DivorcedWomen who gave birth in the past 12 months Now married:
92.1% (120)Unmarried:
7.9% (10)
Women who did not give birth in the past 12 months Now married:
41.0% (620)Unmarried:
59.0% (894)
Marital status - Black or African American population 15 years and over
Males 44.3% Never married11.3% Now married0.0% Separated0.0% Widowed44.3% DivorcedFemales 42.1% Never married21.1% Now married22.8% Separated0.0% Widowed14.0% DivorcedWomen who did not give birth in the past 12 months Now married:
36.4% (12)Unmarried:
63.6% (20)
Marital status - Asian population 15 years and over
Males 0.0% Never married100.0% Now married0.0% Separated0.0% Widowed0.0% DivorcedFemales 20.0% Never married80.0% Now married0.0% Separated0.0% Widowed0.0% DivorcedWomen who did not give birth in the past 12 months Now married:
100.0% (4)Unmarried:
0.0% (0)
Marital status - Other race population 15 years and over
Males 70.0% Never married30.0% Now married0.0% Separated0.0% Widowed0.0% DivorcedFemales 81.6% Never married18.4% Now married0.0% Separated0.0% Widowed0.0% DivorcedWomen who did not give birth in the past 12 months Now married:
0.0% (0)Unmarried:
100.0% (22)
Marital status - Two or more races population 15 years and over
Males 28.8% Never married52.5% Now married0.0% Separated0.0% Widowed18.6% DivorcedFemales 39.1% Never married25.0% Now married16.3% Separated0.0% Widowed19.6% DivorcedWomen who did not give birth in the past 12 months Now married:
41.9% (36)Unmarried:
58.1% (49)
Marital status - White alone, not Hispanic / Latino population 15 years and over
Males 36.5% Never married51.9% Now married1.7% Separated2.9% Widowed7.1% DivorcedFemales 27.3% Never married45.7% Now married1.1% Separated7.3% Widowed18.7% DivorcedWomen who gave birth in the past 12 months Now married:
92.1% (125)Unmarried:
7.9% (11)
Women who did not give birth in the past 12 months Now married:
40.9% (610)Unmarried:
59.1% (883)
Marital status - Hispanic or Latino population 15 years and over
Males 34.4% Never married34.4% Now married0.0% Separated0.0% Widowed31.1% DivorcedFemales 61.6% Never married28.7% Now married6.1% Separated0.0% Widowed3.7% DivorcedWomen who did not give birth in the past 12 months Now married:
36.0% (42)Unmarried:
64.0% (75)
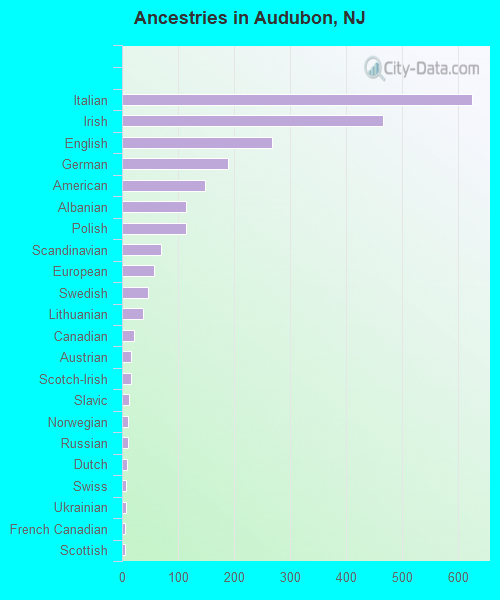
Ancestries in Audubon
625 23.1% Italian466 17.2% Irish269 10.0% English189 7.0% German149 5.5% American115 4.3% Albanian115 4.3% Polish69 2.6% Scandinavian57 2.1% European47 1.7% Swedish38 1.4% Lithuanian21 0.8% Canadian16 0.6% Austrian16 0.6% Scotch-Irish12 0.4% Slavic11 0.4% Norwegian11 0.4% Russian9 0.3% Dutch8 0.3% Swiss8 0.3% Ukrainian6 0.2% French Canadian6 0.2% Scottish3 0.1% Northern European
Children Nativity (place of birth) in Audubon
Children under 6 years - Living with two parents Both parents native 512 100.0% NativeChildren under 6 years - Living with one parent Native parent 184 100.0% NativeChildren 6 to 17 years - Living with two parents Both parents native 669 100.0% NativeChildren 6 to 17 years - Living with one parent Native parent 520 100.0% NativeForeign-born parent 31 51.5% Native29 48.5% Foreign-born
Grandparents responsible for own grandchildren in Audubon
Grandparents (30 to 59 years) White / Caucasian 11 13.9% Responsible for grandchildren69 86.1% Not responsible for grandchildrenWhite alone, not Hispanic / Latino 12 15.1% Responsible for grandchildren66 84.9% Not responsible for grandchildrenGrandparents (60 years and over) White / Caucasian 73 86.0% Responsible for grandchildren12 14.0% Not responsible for grandchildrenWhite alone, not Hispanic / Latino 77 84.8% Responsible for grandchildren14 15.2% Not responsible for grandchildren