Races in Barrington, Illinois (IL) Detailed Stats
Data:
Races - White alone (%)
Races - White alone (% change since 2000)
Races - Black alone (%)
Races - Black alone (% change since 2000)
Races - American Indian alone (%)
Races - American Indian alone (% change since 2000)
Races - Asian alone (%)
Races - Asian alone (% change since 2000)
Races - Hispanic (%)
Races - Hispanic (% change since 2000)
Races - Native Hawaiian and Other Pacific Islander alone (%)
Races - Native Hawaiian and Other Pacific Islander alone (% change since 2000)
Races - Two or more races(%)
Races - Two or more races(% change since 2000)
Races - Other race alone (%)
Races - Other race alone (% change since 2000)
Racial diversity
Place of birth - Born in state of residence (%)
Place of birth - Born in state of residence (%) - White
Place of birth - Born in state of residence (%) - Black or African American
Place of birth - Born in state of residence (%) - Asian
Place of birth - Born in state of residence (%) - Hispanic or Latino
Place of birth - Born in state of residence (%) - American Indian and Alaska Native
Place of birth - Born in state of residence (%) - Multirace
Place of birth - Born in state of residence (%) - Other Race
Place of birth - Born in other state (%)
Place of birth - Born in other state (%) - White
Place of birth - Born in other state (%) - Black or African American
Place of birth - Born in other state (%) - Asian
Place of birth - Born in other state (%) - Hispanic or Latino
Place of birth - Born in other state (%) - American Indian and Alaska Native
Place of birth - Born in other state (%) - Multirace
Place of birth - Born in other state (%) - Other Race
Place of birth - Native, outside of US (%)
Place of birth - Native, outside of US (%) - White
Place of birth - Native, outside of US (%) - Black or African American
Place of birth - Native, outside of US (%) - Asian
Place of birth - Native, outside of US (%) - Hispanic or Latino
Place of birth - Native, outside of US (%) - American Indian and Alaska Native
Place of birth - Native, outside of US (%) - Multirace
Place of birth - Native, outside of US (%) - Other Race
Place of birth - Foreign born (%)
Place of birth - Foreign born (%) - White
Place of birth - Foreign born (%) - Black or African American
Place of birth - Foreign born (%) - Asian
Place of birth - Foreign born (%) - Hispanic or Latino
Place of birth - Foreign born (%) - American Indian and Alaska Native
Place of birth - Foreign born (%) - Multirace
Place of birth - Foreign born (%) - Other Race
Residents speaking English at home (%)
Residents speaking English at home - Born in the United States (%)
Residents speaking English at home - Native, born elsewhere (%)
Residents speaking English at home - Foreign born (%)
Residents speaking Spanish at home (%)
Residents speaking Spanish at home - Born in the United States (%)
Residents speaking Spanish at home - Native, born elsewhere (%)
Residents speaking Spanish at home - Foreign born (%)
Residents speaking other language at home (%)
Residents speaking other language at home - Born in the United States (%)
Residents speaking other language at home - Native, born elsewhere (%)
Residents speaking other language at home - Foreign born (%)
Marital status - Never married (%)
Marital status - Now married (%)
Marital status - Separated (%)
Marital status - Widowed (%)
Marital status - Divorced (%)
Ancestries Reported - Arab (%)
Ancestries Reported - Czech (%)
Ancestries Reported - Danish (%)
Ancestries Reported - Dutch (%)
Ancestries Reported - English (%)
Ancestries Reported - French (%)
Ancestries Reported - French Canadian (%)
Ancestries Reported - German (%)
Ancestries Reported - Greek (%)
Ancestries Reported - Hungarian (%)
Ancestries Reported - Irish (%)
Ancestries Reported - Italian (%)
Ancestries Reported - Lithuanian (%)
Ancestries Reported - Norwegian (%)
Ancestries Reported - Polish (%)
Ancestries Reported - Portuguese (%)
Ancestries Reported - Russian (%)
Ancestries Reported - Scotch-Irish (%)
Ancestries Reported - Scottish (%)
Ancestries Reported - Slovak (%)
Ancestries Reported - Subsaharan African (%)
Ancestries Reported - Swedish (%)
Ancestries Reported - Swiss (%)
Ancestries Reported - Ukrainian (%)
Ancestries Reported - United States (%)
Ancestries Reported - Welsh (%)
Ancestries Reported - West Indian (%)
Ancestries Reported - Other (%)
Geographical mobility - Same house 1 year ago (%)
Geographical mobility - Same house 1 year ago (%) - White
Geographical mobility - Same house 1 year ago (%) - Black or African American
Geographical mobility - Same house 1 year ago (%) - Asian
Geographical mobility - Same house 1 year ago (%) - Hispanic or Latino
Geographical mobility - Same house 1 year ago (%) - American Indian and Alaska Native
Geographical mobility - Same house 1 year ago (%) - Multirace
Geographical mobility - Same house 1 year ago (%) - Other Race
Geographical mobility - Moved within same county (%)
Geographical mobility - Moved within same county (%) - White
Geographical mobility - Moved within same county (%) - Black or African American
Geographical mobility - Moved within same county (%) - Asian
Geographical mobility - Moved within same county (%) - Hispanic or Latino
Geographical mobility - Moved within same county (%) - American Indian and Alaska Native
Geographical mobility - Moved within same county (%) - Multirace
Geographical mobility - Moved within same county (%) - Other Race
Geographical mobility - Moved from different county within same state (%)
Geographical mobility - Moved from different county within same state (%) - White
Geographical mobility - Moved from different county within same state (%) - Black or African American
Geographical mobility - Moved from different county within same state (%) - Asian
Geographical mobility - Moved from different county within same state (%) - Hispanic or Latino
Geographical mobility - Moved from different county within same state (%) - American Indian and Alaska Native
Geographical mobility - Moved from different county within same state (%) - Multirace
Geographical mobility - Moved from different county within same state (%) - Other Race
Geographical mobility - Moved from different state (%)
Geographical mobility - Moved from different state (%) - White
Geographical mobility - Moved from different state (%) - Black or African American
Geographical mobility - Moved from different state (%) - Asian
Geographical mobility - Moved from different state (%) - Hispanic or Latino
Geographical mobility - Moved from different state (%) - American Indian and Alaska Native
Geographical mobility - Moved from different state (%) - Multirace
Geographical mobility - Moved from different state (%) - Other Race
Geographical mobility - Moved from abroad (%)
Geographical mobility - Moved from abroad (%) - White
Geographical mobility - Moved from abroad (%) - Black or African American
Geographical mobility - Moved from abroad (%) - Asian
Geographical mobility - Moved from abroad (%) - Hispanic or Latino
Geographical mobility - Moved from abroad (%) - American Indian and Alaska Native
Geographical mobility - Moved from abroad (%) - Multirace
Geographical mobility - Moved from abroad (%) - Other Race
Place of birth for the foreign-born population - Ireland (%)
Place of birth for the foreign-born population - Denmark (%)
Place of birth for the foreign-born population - Norway (%)
Place of birth for the foreign-born population - Sweden (%)
Place of birth for the foreign-born population - United Kingdom (%)
Place of birth for the foreign-born population - England (%)
Place of birth for the foreign-born population - Scotland (%)
Place of birth for the foreign-born population - Other Northern Europe (%)
Place of birth for the foreign-born population - Austria (%)
Place of birth for the foreign-born population - Belgium (%)
Place of birth for the foreign-born population - France (%)
Place of birth for the foreign-born population - Germany (%)
Place of birth for the foreign-born population - Netherlands (%)
Place of birth for the foreign-born population - Switzerland (%)
Place of birth for the foreign-born population - Other Western Europe (%)
Place of birth for the foreign-born population - Greece (%)
Place of birth for the foreign-born population - Italy (%)
Place of birth for the foreign-born population - Portugal (%)
Place of birth for the foreign-born population - Spain (%)
Place of birth for the foreign-born population - Other Southern Europe (%)
Place of birth for the foreign-born population - Albania (%)
Place of birth for the foreign-born population - Belarus (%)
Place of birth for the foreign-born population - Bosnia and Herzegovina (%)
Place of birth for the foreign-born population - Bulgaria (%)
Place of birth for the foreign-born population - Croatia (%)
Place of birth for the foreign-born population - Czechoslovakia (%)
Place of birth for the foreign-born population - Hungary (%)
Place of birth for the foreign-born population - Latvia (%)
Place of birth for the foreign-born population - Lithuania (%)
Place of birth for the foreign-born population - North Macedonia (Macedonia) (%)
Place of birth for the foreign-born population - Moldova (%)
Place of birth for the foreign-born population - Poland (%)
Place of birth for the foreign-born population - Romania (%)
Place of birth for the foreign-born population - Russia (%)
Place of birth for the foreign-born population - Serbia (%)
Place of birth for the foreign-born population - Ukraine (%)
Place of birth for the foreign-born population - Other Eastern Europe (%)
Place of birth for the foreign-born population - China (%)
Place of birth for the foreign-born population - Hong Kong (%)
Place of birth for the foreign-born population - Taiwan (%)
Place of birth for the foreign-born population - Japan (%)
Place of birth for the foreign-born population - Korea (%)
Place of birth for the foreign-born population - Other Eastern Asia (%)
Place of birth for the foreign-born population - Afghanistan (%)
Place of birth for the foreign-born population - Bangladesh (%)
Place of birth for the foreign-born population - India (%)
Place of birth for the foreign-born population - Iran (%)
Place of birth for the foreign-born population - Kazakhstan (%)
Place of birth for the foreign-born population - Nepal (%)
Place of birth for the foreign-born population - Pakistan (%)
Place of birth for the foreign-born population - Sri Lanka (%)
Place of birth for the foreign-born population - Uzbekistan (%)
Place of birth for the foreign-born population - Other South Central Asia (%)
Place of birth for the foreign-born population - Burma (%)
Place of birth for the foreign-born population - Cambodia (%)
Place of birth for the foreign-born population - Indonesia (%)
Place of birth for the foreign-born population - Laos (%)
Place of birth for the foreign-born population - Malaysia (%)
Place of birth for the foreign-born population - Philippines (%)
Place of birth for the foreign-born population - Singapore (%)
Place of birth for the foreign-born population - Thailand (%)
Place of birth for the foreign-born population - Vietnam (%)
Place of birth for the foreign-born population - Other South Eastern Asia (%)
Place of birth for the foreign-born population - Armenia (%)
Place of birth for the foreign-born population - Iraq (%)
Place of birth for the foreign-born population - Israel (%)
Place of birth for the foreign-born population - Jordan (%)
Place of birth for the foreign-born population - Kuwait (%)
Place of birth for the foreign-born population - Lebanon (%)
Place of birth for the foreign-born population - Saudi Arabia (%)
Place of birth for the foreign-born population - Syria (%)
Place of birth for the foreign-born population - Turkey (%)
Place of birth for the foreign-born population - Yemen (%)
Place of birth for the foreign-born population - Other Western Asia (%)
Place of birth for the foreign-born population - Eritrea (%)
Place of birth for the foreign-born population - Ethiopia (%)
Place of birth for the foreign-born population - Kenya (%)
Place of birth for the foreign-born population - Somalia (%)
Place of birth for the foreign-born population - Uganda (%)
Place of birth for the foreign-born population - Zimbabwe (%)
Place of birth for the foreign-born population - Other Eastern Africa (%)
Place of birth for the foreign-born population - Cameroon (%)
Place of birth for the foreign-born population - Congo (%)
Place of birth for the foreign-born population - Democratic Republic of Congo (Zaire) (%)
Place of birth for the foreign-born population - Other Middle Africa (%)
Place of birth for the foreign-born population - Egypt (%)
Place of birth for the foreign-born population - Morocco (%)
Place of birth for the foreign-born population - Sudan (%)
Place of birth for the foreign-born population - Other Northern Africa (%)
Place of birth for the foreign-born population - South Africa (%)
Place of birth for the foreign-born population - Other Southern Africa (%)
Place of birth for the foreign-born population - Cabo Verde (%)
Place of birth for the foreign-born population - Ghana (%)
Place of birth for the foreign-born population - Liberia (%)
Place of birth for the foreign-born population - Nigeria (%)
Place of birth for the foreign-born population - Senegal (%)
Place of birth for the foreign-born population - Sierra Leone (%)
Place of birth for the foreign-born population - Other Western Africa (%)
Place of birth for the foreign-born population - Australia (%)
Place of birth for the foreign-born population - New Zealand (%)
Place of birth for the foreign-born population - Fiji (%)
Place of birth for the foreign-born population - Micronesia (%)
Place of birth for the foreign-born population - Bahamas (%)
Place of birth for the foreign-born population - Barbados (%)
Place of birth for the foreign-born population - Cuba (%)
Place of birth for the foreign-born population - Dominica (%)
Place of birth for the foreign-born population - Dominican Republic (%)
Place of birth for the foreign-born population - Grenada (%)
Place of birth for the foreign-born population - Haiti (%)
Place of birth for the foreign-born population - Jamaica (%)
Place of birth for the foreign-born population - St. Vincent and the Grenadines (%)
Place of birth for the foreign-born population - Trinidad and Tobago (%)
Place of birth for the foreign-born population - West Indies (%)
Place of birth for the foreign-born population - Other Caribbean (%)
Place of birth for the foreign-born population - Belize (%)
Place of birth for the foreign-born population - Costa Rica (%)
Place of birth for the foreign-born population - El Salvador (%)
Place of birth for the foreign-born population - Guatemala (%)
Place of birth for the foreign-born population - Honduras (%)
Place of birth for the foreign-born population - Mexico (%)
Place of birth for the foreign-born population - Nicaragua (%)
Place of birth for the foreign-born population - Panama (%)
Place of birth for the foreign-born population - Other Central America (%)
Place of birth for the foreign-born population - Argentina (%)
Place of birth for the foreign-born population - Bolivia (%)
Place of birth for the foreign-born population - Brazil (%)
Place of birth for the foreign-born population - Chile (%)
Place of birth for the foreign-born population - Colombia (%)
Place of birth for the foreign-born population - Ecuador (%)
Place of birth for the foreign-born population - Guyana (%)
Place of birth for the foreign-born population - Peru (%)
Place of birth for the foreign-born population - Uruguay (%)
Place of birth for the foreign-born population - Venezuela (%)
Place of birth for the foreign-born population - Other South America (%)
Place of birth for the foreign-born population - Canada (%)
Place of birth for the foreign-born population - Other Northern America (%)
Place of birth for the foreign-born population - Other (%)
Latest news about races in Barrington, IL collected exclusively by city-data.com from local newspapers, TV, and radio stations
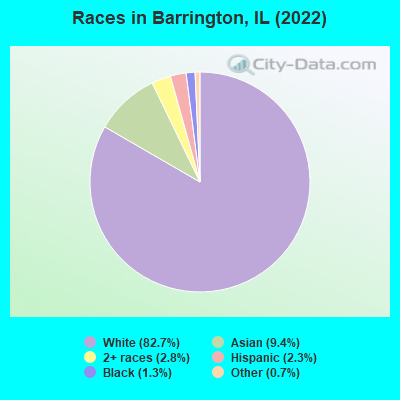
According to 2022 data, the most numerous races in Barrington, IL are White alone (9,096 residents), Hispanic (257 residents), and Black alone (141 residents). 85.1% of Barrington residents speak English at home. 12.1% of Barrington, IL residents are foreign-born (7.2% born in Asia, 3.0% born in Europe), which is 15.3% less than the foreign-born rate of 14.0% across the entire state of Illinois.
Race distribution in Barrington
2000 2022
8,424,140 67.8% White alone 1,856,152 14.9% Black alone 1,530,262 12.3% Hispanic 419,916 3.4% Asian alone 153,996 1.2% Two or more races 13,479 0.1% Other race alone 18,232 0.1% American Indian alone 3,116 0.03% Native Hawaiian and Other
7,356,301 58.5% White alone 2,299,726 18.3% Hispanic 1,660,423 13.2% Black alone 747,296 5.9% Asian alone 458,599 3.6% Two or more races 45,386 0.4% Other race alone 10,405 0.08% American Indian alone 3,896 0.03% Native Hawaiian and Other
Income and house value in Barrington Median household income in 2022 $156,699 White non-Hispanic householdersover $200,000 Some other race householdersover $200,000 Two or more races householders$143,667 Hispanic or Latino race householdersMedian 2022 house value $565,968 White Non-Hispanic householders$980,512 Black or African American householders $474,568 Asian householders$596,833 Two or more races householders$280,682 Hispanic or Latino householders
Median age by race in Barrington
43.8 Median age for White residents42.7 45.2 62.6 Median age for Black or African American residents-674,418,604.0 77.6 -680,473,372.1 Median age for American Indian / Alaska Native residents-736,736,736.0 -641,399,416.3 54.2 Median age for Asian residents48.4 58.3 -687,999,999.3 Median age for Native Hawaiian / Pacific Islander residents-918,721,460.3 -610,229,276.3 11.2 Median age for Other race residents33.4 11.0 30.4 Median age for Two or more races residents35.4 10.1 42.8 Median age for White alone residents42.0 43.8 32.5 Median age for Hispanic or Latino residents32.6 32.4
Owner/renter occupied households by race in Barrington
House owners and renters - White residents 2,895 83.0% Owner occupied591 17.0% Renter occupiedHouse owners and renters - Black or African American residents 42 100.0% Renter occupiedHouse owners and renters - Asian residents 174 47.3% Owner occupied194 52.7% Renter occupiedHouse owners and renters - Other race residents 25 59.5% Owner occupied17 40.5% Renter occupiedHouse owners and renters - Two or more races residents 53 45.1% Owner occupied64 54.9% Renter occupiedHouse owners and renters - White alone residents 3,061 82.9% Owner occupied633 17.1% Renter occupiedHouse owners and renters - Hispanic or Latino residents 22 33.9% Owner occupied43 66.1% Renter occupied
Language usage in Barrington
English speakers - Total 85.1% of residents of Barrington speak English at home.
1.7% of residents speak Spanish at home 156 88.1% Speak English very well21 11.9% Speak English less than very well12.7% of residents speak other language at home 842 63.1% Speak English very well492 36.9% Speak English less than very well
English speakers - Born in the United States 96.2% of residents of Barrington speak English at home.
2.8% of residents speak Spanish at home 84 100.0% Speak English very well0.6% of residents speak other language at home 18 100.0% Speak English very well
English speakers - Native, born elsewhere 82.7% of residents of Barrington speak English at home.
17.3% of residents speak other language at home 13 100.0% Speak English very well
English speakers - Foreign-born 24.9% of residents of Barrington speak English at home.
3.2% of residents speak Spanish at home 43 100.0% Speak English very well70.3% of residents speak other language at home 499 53.1% Speak English very well440 46.9% Speak English less than very well
White (Caucasian) - Speak only English Native:
100.0% (7,806)Foreign-born:
55.6% (179)
White (Caucasian) - Speak another language Native:
2.7% (208)Foreign-born:
47.5% (153)
Black or African American - Speak only English Native:
100.0% (108)Foreign-born:
79.5% (26)
Asian - Speak only English Native:
28.0% (58)Foreign-born:
12.1% (99)
Asian - Speak another language Native:
71.8% (148)Foreign-born:
87.7% (714)
Other race - Speak another language Native:
50.9% (43)Foreign-born:
100.0% (48)
Two or more races - Speak another language Native:
10.3% (36)Foreign-born:
100.0% (50)
White alone - Speak only English Native:
96.4% (7,991)Foreign-born:
49.1% (198)
White alone - Speak another language Native:
3.1% (255)Foreign-born:
47.1% (190)
Hispanic or Latino - Speak another language Native:
41.2% (89)Foreign-born:
100.0% (43)
Foreign-born residents in Barrington 1,335 residents are foreign born (7.2% Asia , 3.0% Europe ).
This city:
12.1%Illinois:
14.1%
Marital status for residents in Barrington Marital status - White (Caucasian) population 15 years and over
Males 22.1% Never married66.9% Now married1.8% Separated1.5% Widowed7.8% DivorcedFemales 17.8% Never married58.8% Now married0.6% Separated9.0% Widowed13.9% DivorcedWomen who gave birth in the past 12 months Now married:
100.0% (145)Unmarried:
0.0% (0)
Women who did not give birth in the past 12 months Now married:
52.8% (780)Unmarried:
47.2% (697)
Marital status - Black or African American population 15 years and over
Males 100.0% Never married0.0% Now married0.0% Separated0.0% Widowed0.0% DivorcedFemales 81.2% Never married9.4% Now married0.0% Separated8.2% Widowed1.2% DivorcedWomen who did not give birth in the past 12 months Now married:
0.0% (0)Unmarried:
100.0% (11)
Marital status - Asian population 15 years and over
Males 3.0% Never married97.0% Now married0.0% Separated0.0% Widowed0.0% DivorcedFemales 2.6% Never married85.4% Now married0.0% Separated7.6% Widowed4.3% DivorcedWomen who did not give birth in the past 12 months Now married:
86.7% (172)Unmarried:
13.3% (26)
Marital status - Other race population 15 years and over
Males 0.0% Never married100.0% Now married0.0% Separated0.0% Widowed0.0% DivorcedFemales 23.5% Never married76.5% Now married0.0% Separated0.0% Widowed0.0% DivorcedWomen who did not give birth in the past 12 months Now married:
76.5% (29)Unmarried:
23.5% (9)
Marital status - Two or more races population 15 years and over
Males 16.4% Never married57.5% Now married26.1% Separated0.0% Widowed0.0% DivorcedFemales 31.0% Never married69.0% Now married0.0% Separated0.0% Widowed0.0% DivorcedWomen who did not give birth in the past 12 months Now married:
61.8% (29)Unmarried:
38.2% (18)
Marital status - White alone, not Hispanic / Latino population 15 years and over
Males 22.3% Never married67.1% Now married1.8% Separated1.5% Widowed7.3% DivorcedFemales 17.8% Never married58.8% Now married0.4% Separated9.0% Widowed14.0% DivorcedWomen who gave birth in the past 12 months Now married:
100.0% (163)Unmarried:
0.0% (0)
Women who did not give birth in the past 12 months Now married:
52.3% (856)Unmarried:
47.7% (782)
Marital status - Hispanic or Latino population 15 years and over
Males 12.7% Never married69.6% Now married0.0% Separated0.0% Widowed17.6% DivorcedFemales 16.3% Never married65.3% Now married18.4% Separated0.0% Widowed0.0% DivorcedWomen who did not give birth in the past 12 months Now married:
83.7% (41)Unmarried:
16.3% (8)
Ancestries in Barrington
686 15.7% German486 11.1% Polish463 10.6% Irish287 6.6% American213 4.9% Italian182 4.2% English92 2.1% Greek86 2.0% Russian85 1.9% Icelander72 1.6% European71 1.6% Dutch49 1.1% Lithuanian47 1.1% Danish43 1.0% Czech39 0.9% Scottish37 0.8% Eastern European34 0.8% Swedish32 0.7% Scotch-Irish31 0.7% Ukrainian29 0.7% Scandinavian28 0.6% Norwegian26 0.6% Canadian22 0.5% British19 0.4% South African15 0.3% Belgian13 0.3% Carpatho Rusyn11 0.3% Jamaican9 0.2% Slovak9 0.2% French9 0.2% Finnish8 0.2% Northern European8 0.2% Hungarian7 0.2% Armenian
Children Nativity (place of birth) in Barrington
Children under 6 years - Living with two parents Both parents native 510 100.0% NativeBoth parents foreign-born 13 100.0% NativeOne native, one foreign-born parent 31 100.0% NativeChildren under 6 years - Living with one parent Native parent 11 100.0% NativeChildren 6 to 17 years - Living with two parents Both parents native 1,410 100.0% NativeBoth parents foreign-born 184 75.0% Native61 25.0% Foreign-bornOne native, one foreign-born parent 229 100.0% NativeChildren 6 to 17 years - Living with one parent Native parent 497 100.0% NativeForeign-born parent 92 54.0% Native79 46.0% Foreign-born
Grandparents responsible for own grandchildren in Barrington
Grandparents (30 to 59 years) Asian 20 100.0% Not responsible for grandchildren
Grandparents (60 years and over)