Races in Battle Creek, Michigan (MI) Detailed Stats
Data:
Races - White alone (%)
Races - White alone (% change since 2000)
Races - Black alone (%)
Races - Black alone (% change since 2000)
Races - American Indian alone (%)
Races - American Indian alone (% change since 2000)
Races - Asian alone (%)
Races - Asian alone (% change since 2000)
Races - Hispanic (%)
Races - Hispanic (% change since 2000)
Races - Native Hawaiian and Other Pacific Islander alone (%)
Races - Native Hawaiian and Other Pacific Islander alone (% change since 2000)
Races - Two or more races(%)
Races - Two or more races(% change since 2000)
Races - Other race alone (%)
Races - Other race alone (% change since 2000)
Racial diversity
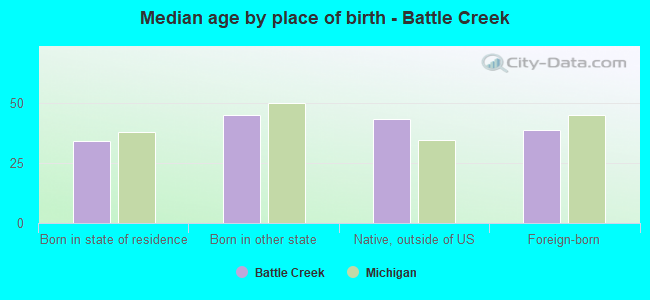
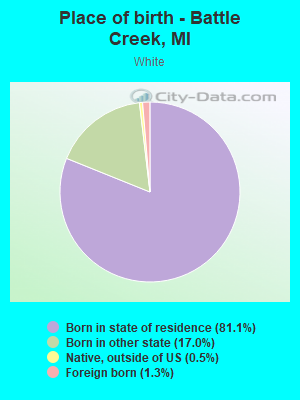
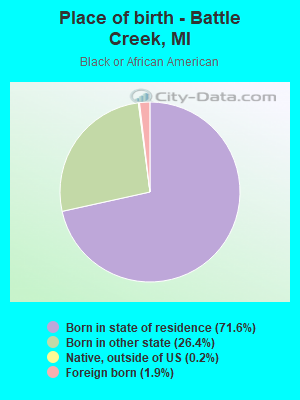
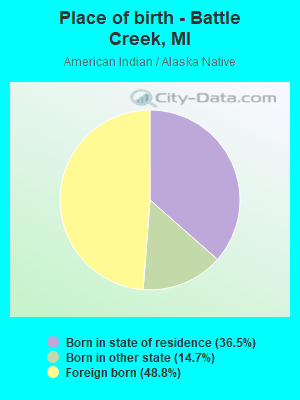
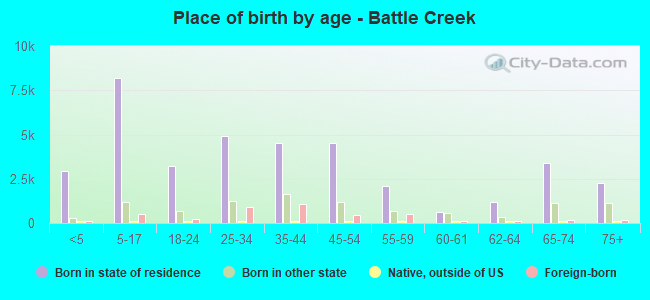
Place of birth - Born in state of residence (%)
Place of birth - Born in state of residence (%) - White
Place of birth - Born in state of residence (%) - Black or African American
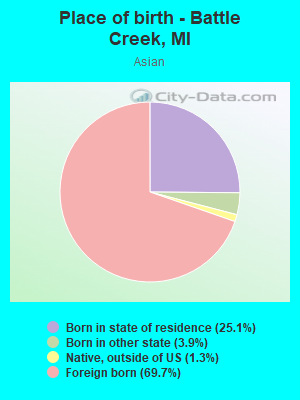
Place of birth - Born in state of residence (%) - Asian
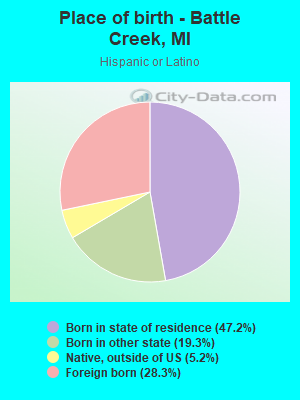
Place of birth - Born in state of residence (%) - Hispanic or Latino
Place of birth - Born in state of residence (%) - American Indian and Alaska Native
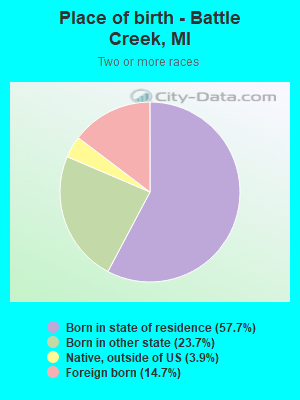
Place of birth - Born in state of residence (%) - Multirace
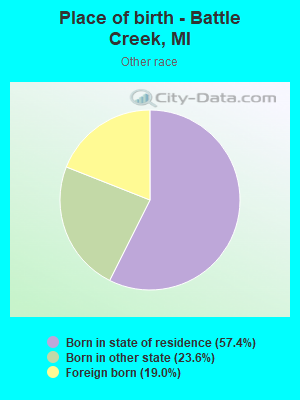
Place of birth - Born in state of residence (%) - Other Race
Place of birth - Born in other state (%)
Place of birth - Born in other state (%) - White
Place of birth - Born in other state (%) - Black or African American
Place of birth - Born in other state (%) - Asian
Place of birth - Born in other state (%) - Hispanic or Latino
Place of birth - Born in other state (%) - American Indian and Alaska Native
Place of birth - Born in other state (%) - Multirace
Place of birth - Born in other state (%) - Other Race
Place of birth - Native, outside of US (%)
Place of birth - Native, outside of US (%) - White
Place of birth - Native, outside of US (%) - Black or African American
Place of birth - Native, outside of US (%) - Asian
Place of birth - Native, outside of US (%) - Hispanic or Latino
Place of birth - Native, outside of US (%) - American Indian and Alaska Native
Place of birth - Native, outside of US (%) - Multirace
Place of birth - Native, outside of US (%) - Other Race
Place of birth - Foreign born (%)
Place of birth - Foreign born (%) - White
Place of birth - Foreign born (%) - Black or African American
Place of birth - Foreign born (%) - Asian
Place of birth - Foreign born (%) - Hispanic or Latino
Place of birth - Foreign born (%) - American Indian and Alaska Native
Place of birth - Foreign born (%) - Multirace
Place of birth - Foreign born (%) - Other Race
Residents speaking English at home (%)
Residents speaking English at home - Born in the United States (%)
Residents speaking English at home - Native, born elsewhere (%)
Residents speaking English at home - Foreign born (%)
Residents speaking Spanish at home (%)
Residents speaking Spanish at home - Born in the United States (%)
Residents speaking Spanish at home - Native, born elsewhere (%)
Residents speaking Spanish at home - Foreign born (%)
Residents speaking other language at home (%)
Residents speaking other language at home - Born in the United States (%)
Residents speaking other language at home - Native, born elsewhere (%)
Residents speaking other language at home - Foreign born (%)
Marital status - Never married (%)
Marital status - Now married (%)
Marital status - Separated (%)
Marital status - Widowed (%)
Marital status - Divorced (%)
Ancestries Reported - Arab (%)
Ancestries Reported - Czech (%)
Ancestries Reported - Danish (%)
Ancestries Reported - Dutch (%)
Ancestries Reported - English (%)
Ancestries Reported - French (%)
Ancestries Reported - French Canadian (%)
Ancestries Reported - German (%)
Ancestries Reported - Greek (%)
Ancestries Reported - Hungarian (%)
Ancestries Reported - Irish (%)
Ancestries Reported - Italian (%)
Ancestries Reported - Lithuanian (%)
Ancestries Reported - Norwegian (%)
Ancestries Reported - Polish (%)
Ancestries Reported - Portuguese (%)
Ancestries Reported - Russian (%)
Ancestries Reported - Scotch-Irish (%)
Ancestries Reported - Scottish (%)
Ancestries Reported - Slovak (%)
Ancestries Reported - Subsaharan African (%)
Ancestries Reported - Swedish (%)
Ancestries Reported - Swiss (%)
Ancestries Reported - Ukrainian (%)
Ancestries Reported - United States (%)
Ancestries Reported - Welsh (%)
Ancestries Reported - West Indian (%)
Ancestries Reported - Other (%)
Geographical mobility - Same house 1 year ago (%)
Geographical mobility - Same house 1 year ago (%) - White
Geographical mobility - Same house 1 year ago (%) - Black or African American
Geographical mobility - Same house 1 year ago (%) - Asian
Geographical mobility - Same house 1 year ago (%) - Hispanic or Latino
Geographical mobility - Same house 1 year ago (%) - American Indian and Alaska Native
Geographical mobility - Same house 1 year ago (%) - Multirace
Geographical mobility - Same house 1 year ago (%) - Other Race
Geographical mobility - Moved within same county (%)
Geographical mobility - Moved within same county (%) - White
Geographical mobility - Moved within same county (%) - Black or African American
Geographical mobility - Moved within same county (%) - Asian
Geographical mobility - Moved within same county (%) - Hispanic or Latino
Geographical mobility - Moved within same county (%) - American Indian and Alaska Native
Geographical mobility - Moved within same county (%) - Multirace
Geographical mobility - Moved within same county (%) - Other Race
Geographical mobility - Moved from different county within same state (%)
Geographical mobility - Moved from different county within same state (%) - White
Geographical mobility - Moved from different county within same state (%) - Black or African American
Geographical mobility - Moved from different county within same state (%) - Asian
Geographical mobility - Moved from different county within same state (%) - Hispanic or Latino
Geographical mobility - Moved from different county within same state (%) - American Indian and Alaska Native
Geographical mobility - Moved from different county within same state (%) - Multirace
Geographical mobility - Moved from different county within same state (%) - Other Race
Geographical mobility - Moved from different state (%)
Geographical mobility - Moved from different state (%) - White
Geographical mobility - Moved from different state (%) - Black or African American
Geographical mobility - Moved from different state (%) - Asian
Geographical mobility - Moved from different state (%) - Hispanic or Latino
Geographical mobility - Moved from different state (%) - American Indian and Alaska Native
Geographical mobility - Moved from different state (%) - Multirace
Geographical mobility - Moved from different state (%) - Other Race
Geographical mobility - Moved from abroad (%)
Geographical mobility - Moved from abroad (%) - White
Geographical mobility - Moved from abroad (%) - Black or African American
Geographical mobility - Moved from abroad (%) - Asian
Geographical mobility - Moved from abroad (%) - Hispanic or Latino
Geographical mobility - Moved from abroad (%) - American Indian and Alaska Native
Geographical mobility - Moved from abroad (%) - Multirace
Geographical mobility - Moved from abroad (%) - Other Race
Place of birth for the foreign-born population - Ireland (%)
Place of birth for the foreign-born population - Denmark (%)
Place of birth for the foreign-born population - Norway (%)
Place of birth for the foreign-born population - Sweden (%)
Place of birth for the foreign-born population - United Kingdom (%)
Place of birth for the foreign-born population - England (%)
Place of birth for the foreign-born population - Scotland (%)
Place of birth for the foreign-born population - Other Northern Europe (%)
Place of birth for the foreign-born population - Austria (%)
Place of birth for the foreign-born population - Belgium (%)
Place of birth for the foreign-born population - France (%)
Place of birth for the foreign-born population - Germany (%)
Place of birth for the foreign-born population - Netherlands (%)
Place of birth for the foreign-born population - Switzerland (%)
Place of birth for the foreign-born population - Other Western Europe (%)
Place of birth for the foreign-born population - Greece (%)
Place of birth for the foreign-born population - Italy (%)
Place of birth for the foreign-born population - Portugal (%)
Place of birth for the foreign-born population - Spain (%)
Place of birth for the foreign-born population - Other Southern Europe (%)
Place of birth for the foreign-born population - Albania (%)
Place of birth for the foreign-born population - Belarus (%)
Place of birth for the foreign-born population - Bosnia and Herzegovina (%)
Place of birth for the foreign-born population - Bulgaria (%)
Place of birth for the foreign-born population - Croatia (%)
Place of birth for the foreign-born population - Czechoslovakia (%)
Place of birth for the foreign-born population - Hungary (%)
Place of birth for the foreign-born population - Latvia (%)
Place of birth for the foreign-born population - Lithuania (%)
Place of birth for the foreign-born population - North Macedonia (Macedonia) (%)
Place of birth for the foreign-born population - Moldova (%)
Place of birth for the foreign-born population - Poland (%)
Place of birth for the foreign-born population - Romania (%)
Place of birth for the foreign-born population - Russia (%)
Place of birth for the foreign-born population - Serbia (%)
Place of birth for the foreign-born population - Ukraine (%)
Place of birth for the foreign-born population - Other Eastern Europe (%)
Place of birth for the foreign-born population - China (%)
Place of birth for the foreign-born population - Hong Kong (%)
Place of birth for the foreign-born population - Taiwan (%)
Place of birth for the foreign-born population - Japan (%)
Place of birth for the foreign-born population - Korea (%)
Place of birth for the foreign-born population - Other Eastern Asia (%)
Place of birth for the foreign-born population - Afghanistan (%)
Place of birth for the foreign-born population - Bangladesh (%)
Place of birth for the foreign-born population - India (%)
Place of birth for the foreign-born population - Iran (%)
Place of birth for the foreign-born population - Kazakhstan (%)
Place of birth for the foreign-born population - Nepal (%)
Place of birth for the foreign-born population - Pakistan (%)
Place of birth for the foreign-born population - Sri Lanka (%)
Place of birth for the foreign-born population - Uzbekistan (%)
Place of birth for the foreign-born population - Other South Central Asia (%)
Place of birth for the foreign-born population - Burma (%)
Place of birth for the foreign-born population - Cambodia (%)
Place of birth for the foreign-born population - Indonesia (%)
Place of birth for the foreign-born population - Laos (%)
Place of birth for the foreign-born population - Malaysia (%)
Place of birth for the foreign-born population - Philippines (%)
Place of birth for the foreign-born population - Singapore (%)
Place of birth for the foreign-born population - Thailand (%)
Place of birth for the foreign-born population - Vietnam (%)
Place of birth for the foreign-born population - Other South Eastern Asia (%)
Place of birth for the foreign-born population - Armenia (%)
Place of birth for the foreign-born population - Iraq (%)
Place of birth for the foreign-born population - Israel (%)
Place of birth for the foreign-born population - Jordan (%)
Place of birth for the foreign-born population - Kuwait (%)
Place of birth for the foreign-born population - Lebanon (%)
Place of birth for the foreign-born population - Saudi Arabia (%)
Place of birth for the foreign-born population - Syria (%)
Place of birth for the foreign-born population - Turkey (%)
Place of birth for the foreign-born population - Yemen (%)
Place of birth for the foreign-born population - Other Western Asia (%)
Place of birth for the foreign-born population - Eritrea (%)
Place of birth for the foreign-born population - Ethiopia (%)
Place of birth for the foreign-born population - Kenya (%)
Place of birth for the foreign-born population - Somalia (%)
Place of birth for the foreign-born population - Uganda (%)
Place of birth for the foreign-born population - Zimbabwe (%)
Place of birth for the foreign-born population - Other Eastern Africa (%)
Place of birth for the foreign-born population - Cameroon (%)
Place of birth for the foreign-born population - Congo (%)
Place of birth for the foreign-born population - Democratic Republic of Congo (Zaire) (%)
Place of birth for the foreign-born population - Other Middle Africa (%)
Place of birth for the foreign-born population - Egypt (%)
Place of birth for the foreign-born population - Morocco (%)
Place of birth for the foreign-born population - Sudan (%)
Place of birth for the foreign-born population - Other Northern Africa (%)
Place of birth for the foreign-born population - South Africa (%)
Place of birth for the foreign-born population - Other Southern Africa (%)
Place of birth for the foreign-born population - Cabo Verde (%)
Place of birth for the foreign-born population - Ghana (%)
Place of birth for the foreign-born population - Liberia (%)
Place of birth for the foreign-born population - Nigeria (%)
Place of birth for the foreign-born population - Senegal (%)
Place of birth for the foreign-born population - Sierra Leone (%)
Place of birth for the foreign-born population - Other Western Africa (%)
Place of birth for the foreign-born population - Australia (%)
Place of birth for the foreign-born population - New Zealand (%)
Place of birth for the foreign-born population - Fiji (%)
Place of birth for the foreign-born population - Micronesia (%)
Place of birth for the foreign-born population - Bahamas (%)
Place of birth for the foreign-born population - Barbados (%)
Place of birth for the foreign-born population - Cuba (%)
Place of birth for the foreign-born population - Dominica (%)
Place of birth for the foreign-born population - Dominican Republic (%)
Place of birth for the foreign-born population - Grenada (%)
Place of birth for the foreign-born population - Haiti (%)
Place of birth for the foreign-born population - Jamaica (%)
Place of birth for the foreign-born population - St. Vincent and the Grenadines (%)
Place of birth for the foreign-born population - Trinidad and Tobago (%)
Place of birth for the foreign-born population - West Indies (%)
Place of birth for the foreign-born population - Other Caribbean (%)
Place of birth for the foreign-born population - Belize (%)
Place of birth for the foreign-born population - Costa Rica (%)
Place of birth for the foreign-born population - El Salvador (%)
Place of birth for the foreign-born population - Guatemala (%)
Place of birth for the foreign-born population - Honduras (%)
Place of birth for the foreign-born population - Mexico (%)
Place of birth for the foreign-born population - Nicaragua (%)
Place of birth for the foreign-born population - Panama (%)
Place of birth for the foreign-born population - Other Central America (%)
Place of birth for the foreign-born population - Argentina (%)
Place of birth for the foreign-born population - Bolivia (%)
Place of birth for the foreign-born population - Brazil (%)
Place of birth for the foreign-born population - Chile (%)
Place of birth for the foreign-born population - Colombia (%)
Place of birth for the foreign-born population - Ecuador (%)
Place of birth for the foreign-born population - Guyana (%)
Place of birth for the foreign-born population - Peru (%)
Place of birth for the foreign-born population - Uruguay (%)
Place of birth for the foreign-born population - Venezuela (%)
Place of birth for the foreign-born population - Other South America (%)
Place of birth for the foreign-born population - Canada (%)
Place of birth for the foreign-born population - Other Northern America (%)
Place of birth for the foreign-born population - Other (%)
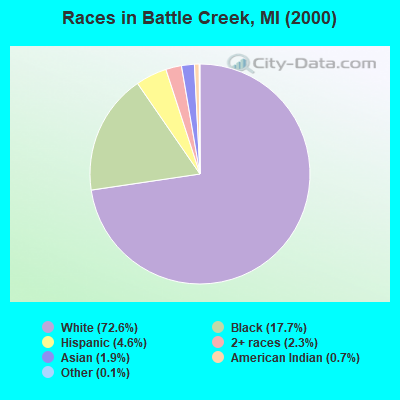
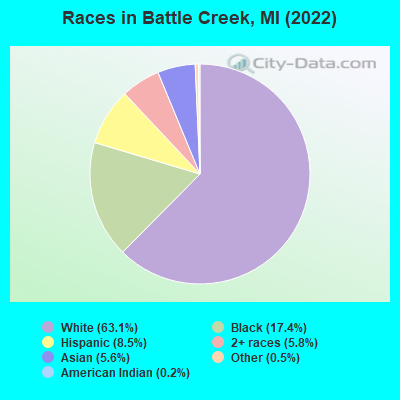
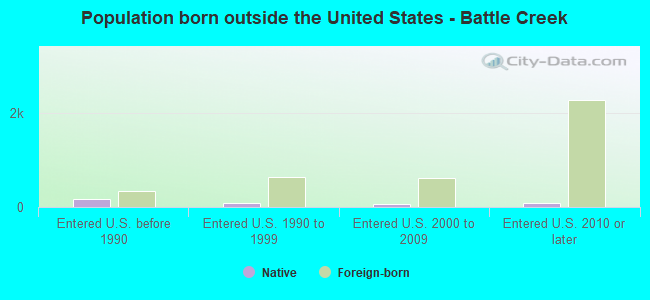
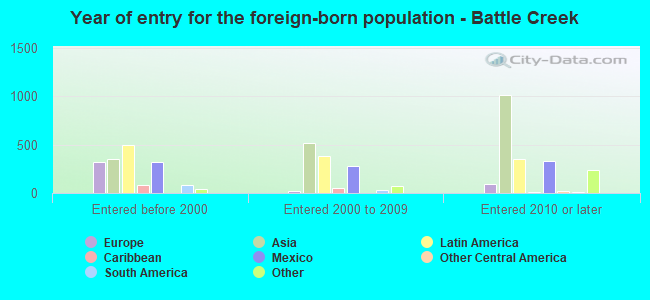
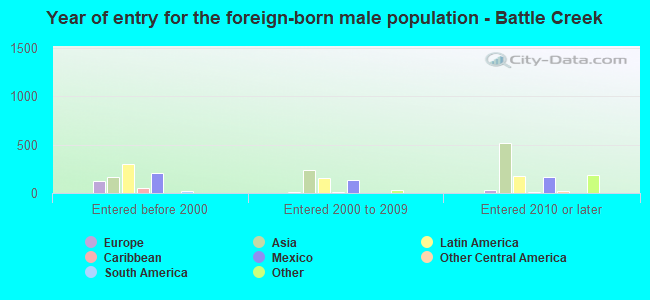
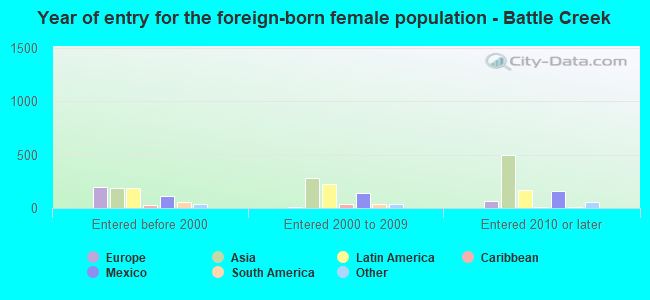
According to 2022 data, the most numerous races in Battle Creek, MI are White alone (32,931 residents), Black alone (9,067 residents), and Hispanic (4,420 residents). 88.7% of Battle Creek residents speak English at home. 7.4% of Battle Creek, MI residents are foreign-born (3.4% born in Asia, 2.4% born in Latin America, 0.9% born in Europe), which is 18.5% greater than the foreign-born rate of 6.0% across the entire state of Michigan.
Race distribution in Battle Creek
2000 2022
38,761 72.6% White alone 9,440 17.7% Black alone 2,475 4.6% Hispanic 1,228 2.3% Two or more races 1,024 1.9% Asian alone 360 0.7% American Indian alone 70 0.1% Other race alone 6 0.01% Native Hawaiian and Other
32,931 63.1% White alone 9,067 17.4% Black alone 4,420 8.5% Hispanic 3,022 5.8% Two or more races 2,905 5.6% Asian alone 270 0.5% Other race alone 92 0.2% American Indian alone
2000 2022
7,806,691 78.6% White alone 1,402,047 14.1% Black alone 323,877 3.3% Hispanic 175,311 1.8% Asian alone 163,487 1.6% Two or more races 53,421 0.5% American Indian alone 11,465 0.1% Other race alone 2,145 0.02% Native Hawaiian and Other
7,289,051 72.6% White alone 1,310,464 13.1% Black alone 572,405 5.7% Hispanic 450,031 4.5% Two or more races 335,732 3.3% Asian alone 45,217 0.5% Other race alone 29,011 0.3% American Indian alone 2,207 0.02% Native Hawaiian and Other
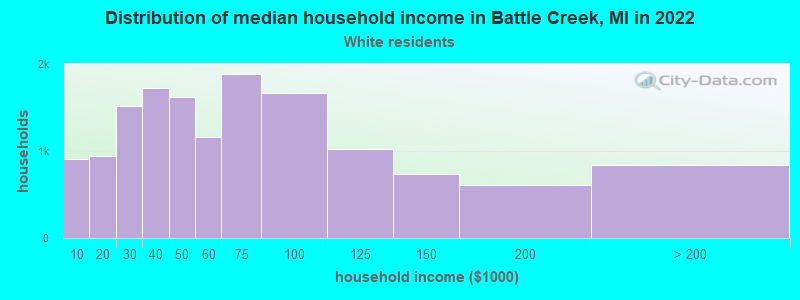
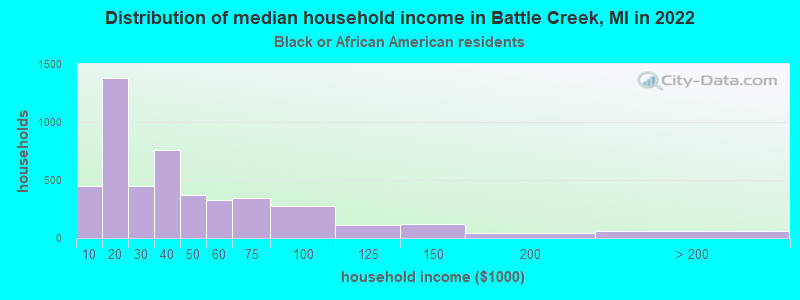
Income and house value in Battle Creek Median household income in 2022 $55,717 White non-Hispanic householders$30,985 Black householders$85,630 Asian householders$77,230 Some other race householders$77,564 Two or more races householders$81,178 Hispanic or Latino race householdersMedian 2022 house value $139,468 White Non-Hispanic householders$102,301 Black or African American householders$120,885 American Indian or Alaska Native householders $281,513 Asian householders$87,213 Some other race householders$90,341 Two or more races householders$91,997 Hispanic or Latino householders
Median age by race in Battle Creek
41.4 Median age for White residents40.4 41.9 34.3 Median age for Black or African American residents34.2 35.2 52.6 Median age for American Indian / Alaska Native residents79.2 47.5 28.1 Median age for Asian residents38.7 26.6 -670,531,400.3 Median age for Native Hawaiian / Pacific Islander residents-674,772,035.8 -666,666,666.0 19.7 Median age for Other race residents21.1 18.4 23.8 Median age for Two or more races residents23.7 23.8 41.8 Median age for White alone residents41.5 42.2 27.4 Median age for Hispanic or Latino residents27.2 26.9
Owner/renter occupied households by race in Battle Creek
House owners and renters - White residents 11,134 77.0% Owner occupied3,319 23.0% Renter occupiedHouse owners and renters - Black or African American residents 1,630 37.0% Owner occupied2,777 63.0% Renter occupiedHouse owners and renters - American Indian / Alaska Native residents 87 89.5% Owner occupied10 10.5% Renter occupiedHouse owners and renters - Asian residents 636 68.4% Owner occupied294 31.6% Renter occupiedHouse owners and renters - Other race residents 225 68.6% Owner occupied103 31.4% Renter occupiedHouse owners and renters - Two or more races residents 970 70.0% Owner occupied415 30.0% Renter occupiedHouse owners and renters - White alone residents 10,933 77.0% Owner occupied3,265 23.0% Renter occupiedHouse owners and renters - Hispanic or Latino residents 852 75.0% Owner occupied285 25.0% Renter occupied
Language usage in Battle Creek
English speakers - Total 88.7% of residents of Battle Creek speak English at home.
5.4% of residents speak Spanish at home 1,921 72.4% Speak English very well733 27.6% Speak English less than very well6.0% of residents speak other language at home 1,951 66.9% Speak English very well966 33.1% Speak English less than very well
English speakers - Born in the United States 93.9% of residents of Battle Creek speak English at home.
4.4% of residents speak Spanish at home 371 86.7% Speak English very well57 13.3% Speak English less than very well1.2% of residents speak other language at home 115 97.5% Speak English very well3 2.5% Speak English less than very well
English speakers - Native, born elsewhere 32.4% of residents of Battle Creek speak English at home.
66.8% of residents speak Spanish at home 225 87.9% Speak English very well31 12.1% Speak English less than very well34.2% of residents speak other language at home 115 87.8% Speak English very well16 12.2% Speak English less than very well
English speakers - Foreign-born 6.7% of residents of Battle Creek speak English at home.
25.9% of residents speak Spanish at home 540 56.2% Speak English very well420 43.8% Speak English less than very well68.3% of residents speak other language at home 1,645 64.9% Speak English very well890 35.1% Speak English less than very well
White (Caucasian) - Speak only English Native:
98.2% (30,753)Foreign-born:
31.9% (140)
White (Caucasian) - Speak another language Native:
1.7% (526)Foreign-born:
64.2% (283)
Black or African American - Speak only English Native:
99.4% (7,515)Foreign-born:
17.5% (59)
Black or African American - Speak another language Native:
0.7% (54)Foreign-born:
84.0% (283)
American Indian / Alaska Native - Speak only English Native:
57.9% (118)Foreign-born:
37.4% (73)
American Indian / Alaska Native - Speak another language Native:
57.0% (116)Foreign-born:
60.9% (119)
Asian - Speak only English Native:
27.9% (130)Foreign-born:
7.2% (129)
Asian - Speak another language Native:
73.5% (344)Foreign-born:
93.2% (1,678)
Other race - Speak another language Native:
47.4% (295)Foreign-born:
100.0% (134)
Two or more races - Speak another language Native:
18.3% (829)Foreign-born:
99.8% (740)
White alone - Speak only English Native:
98.9% (30,432)Foreign-born:
38.1% (142)
White alone - Speak another language Native:
1.1% (338)Foreign-born:
61.8% (231)
Hispanic or Latino - Speak only English Native:
53.2% (1,573)Foreign-born:
5.0% (56)
Hispanic or Latino - Speak another language Native:
47.4% (1,401)Foreign-born:
94.8% (1,063)
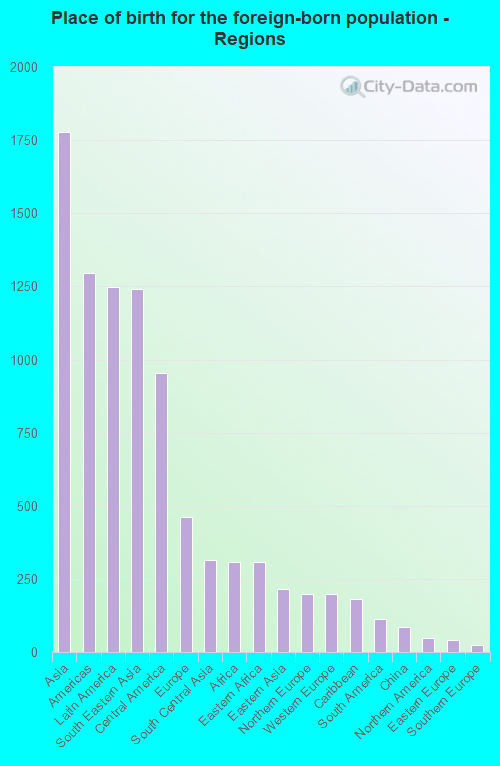
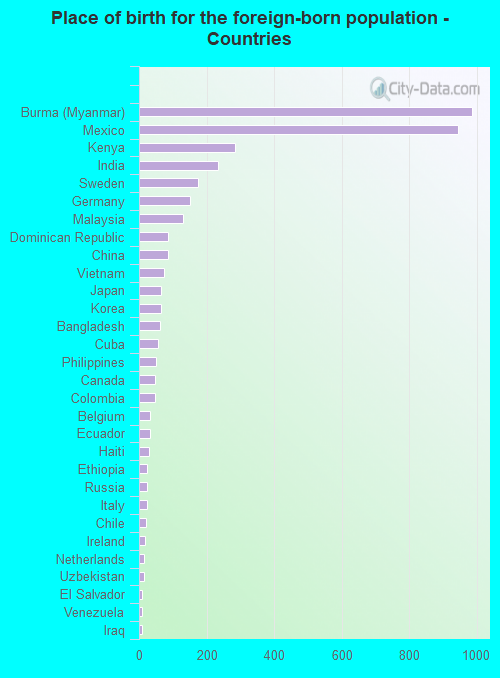
Foreign-born residents in Battle Creek 3,844 residents are foreign born (3.4% Asia , 2.4% Latin America , 0.9% Europe ).
This city:
7.4%Michigan:
6.9%
Marital status for residents in Battle Creek Marital status - White (Caucasian) population 15 years and over
Males 36.5% Never married41.7% Now married1.2% Separated3.3% Widowed17.2% DivorcedFemales 28.7% Never married39.1% Now married1.6% Separated9.5% Widowed21.2% DivorcedWomen who gave birth in the past 12 months Now married:
69.9% (270)Unmarried:
30.1% (116)
Women who did not give birth in the past 12 months Now married:
33.7% (2,482)Unmarried:
66.3% (4,876)
Marital status - Black or African American population 15 years and over
Males 60.0% Never married19.3% Now married2.2% Separated3.9% Widowed14.6% DivorcedFemales 54.1% Never married18.7% Now married3.4% Separated7.8% Widowed16.0% DivorcedWomen who gave birth in the past 12 months Now married:
54.1% (31)Unmarried:
45.9% (27)
Women who did not give birth in the past 12 months Now married:
14.4% (255)Unmarried:
85.6% (1,515)
Marital status - American Indian / Alaska Native population 15 years and over
Males 25.9% Never married47.6% Now married0.0% Separated10.2% Widowed16.3% DivorcedFemales 48.8% Never married43.9% Now married0.0% Separated0.0% Widowed7.3% DivorcedWomen who did not give birth in the past 12 months Now married:
29.6% (38)Unmarried:
70.4% (91)
Marital status - Asian population 15 years and over
Males 31.9% Never married61.1% Now married0.0% Separated1.3% Widowed5.6% DivorcedFemales 39.6% Never married51.8% Now married0.5% Separated6.0% Widowed2.1% DivorcedWomen who gave birth in the past 12 months Now married:
100.0% (65)Unmarried:
0.0% (0)
Women who did not give birth in the past 12 months Now married:
47.8% (309)Unmarried:
52.2% (337)
Marital status - Other race population 15 years and over
Males 55.4% Never married37.8% Now married0.0% Separated0.0% Widowed6.8% DivorcedFemales 59.6% Never married28.1% Now married0.0% Separated9.8% Widowed2.5% DivorcedWomen who did not give birth in the past 12 months Now married:
27.3% (117)Unmarried:
72.7% (312)
Marital status - Two or more races population 15 years and over
Males 53.9% Never married33.5% Now married0.3% Separated0.9% Widowed11.4% DivorcedFemales 43.8% Never married42.1% Now married0.0% Separated1.1% Widowed13.0% DivorcedWomen who gave birth in the past 12 months Now married:
66.0% (41)Unmarried:
34.0% (21)
Women who did not give birth in the past 12 months Now married:
32.6% (544)Unmarried:
67.4% (1,123)
Marital status - White alone, not Hispanic / Latino population 15 years and over
Males 35.6% Never married42.1% Now married1.2% Separated3.3% Widowed17.8% DivorcedFemales 28.3% Never married39.1% Now married1.7% Separated9.7% Widowed21.2% DivorcedWomen who gave birth in the past 12 months Now married:
66.1% (229)Unmarried:
33.9% (118)
Women who did not give birth in the past 12 months Now married:
33.9% (2,434)Unmarried:
66.1% (4,741)
Marital status - Hispanic or Latino population 15 years and over
Males 44.7% Never married43.5% Now married0.3% Separated1.0% Widowed10.4% DivorcedFemales 36.0% Never married44.9% Now married0.0% Separated2.5% Widowed16.6% DivorcedWomen who gave birth in the past 12 months Now married:
100.0% (75)Unmarried:
0.0% (0)
Women who did not give birth in the past 12 months Now married:
36.7% (419)Unmarried:
63.3% (722)
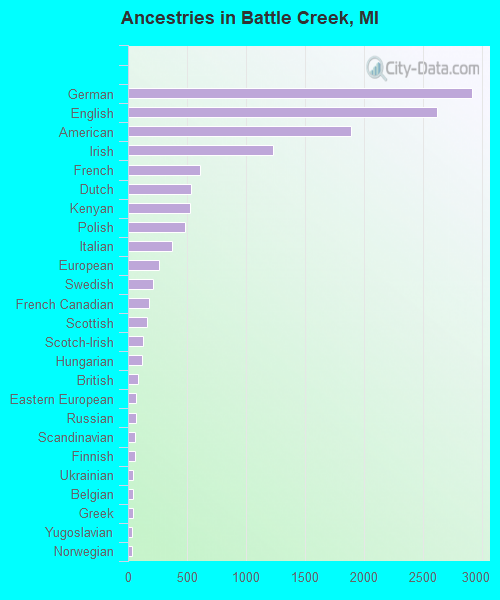
Ancestries in Battle Creek
2,914 11.2% German2,621 10.0% English1,888 7.2% American1,233 4.7% Irish610 2.3% French534 2.0% Dutch522 2.0% Kenyan485 1.9% Polish373 1.4% Italian264 1.0% European211 0.8% Swedish182 0.7% French Canadian162 0.6% Scottish123 0.5% Scotch-Irish120 0.5% Hungarian82 0.3% British70 0.3% Eastern European64 0.2% Russian61 0.2% Scandinavian58 0.2% Finnish45 0.2% Ukrainian42 0.2% Belgian42 0.2% Greek37 0.1% Yugoslavian31 0.1% Norwegian28 0.1% Romanian27 0.1% Portuguese24 0.09% Welsh21 0.08% Croatian15 0.06% Slovene13 0.05% Pennsylvania German12 0.05% Canadian9 0.03% Ethiopian9 0.03% Maltese8 0.03% Iraqi8 0.03% Jamaican7 0.03% Northern European6 0.02% Swiss5 0.02% Celtic
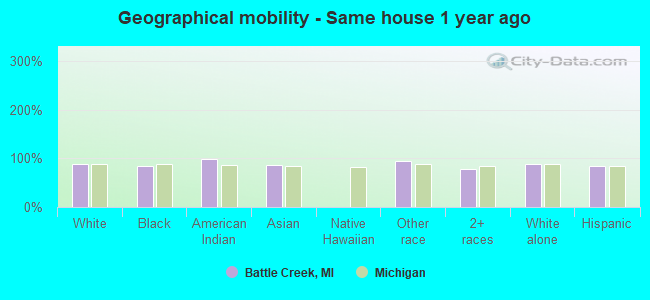
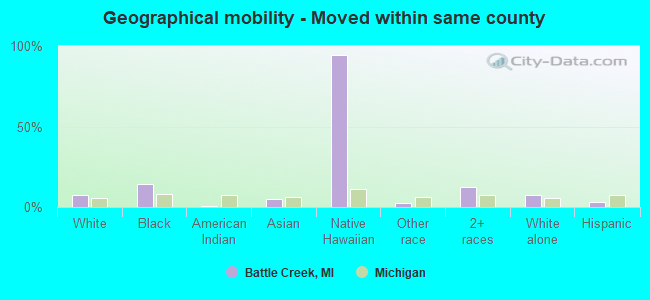
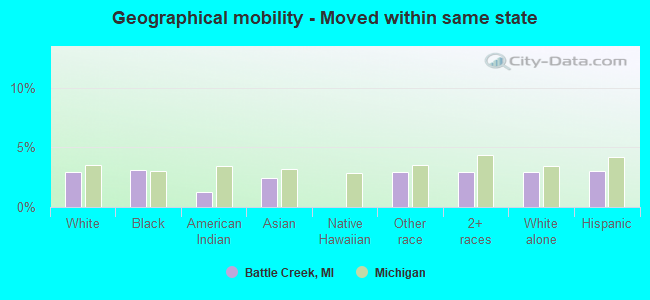
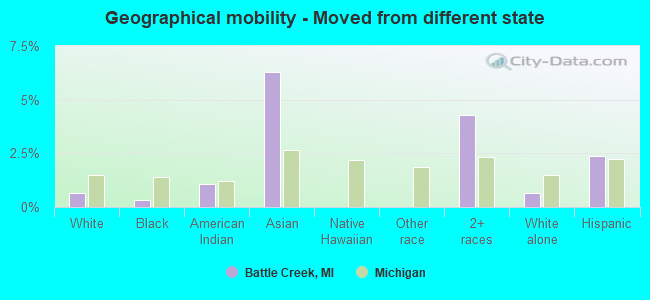
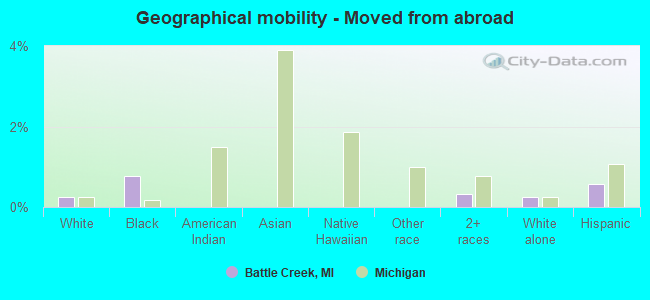
Geographical mobility in Battle Creek Same house 1 year ago 29,508 88.8% White (Caucasian)7,668 83.9% Black or African American333 98.8% American Indian / Alaska Native2,095 86.0% Asian1,326 94.6% Other race4,464 78.8% Two or more races28,808 88.7% White alone, not Hispanic / Latino3,622 84.1% Hispanic or LatinoMoved within same county 2,421 7.3% White / Caucasian1,314 14.4% Black or African American2 0.5% American Indian / Alaska Native123 5.1% Asian1 94.6% Native Hawaiian / Pacific Islander38 2.7% Other race696 12.3% Two or more races2,402 7.4% White alone, not Hispanic / Latino135 3.1% Hispanic or LatinoMoved within same state 985 3.0% White / Caucasian285 3.1% Black or African American4 1.3% American Indian / Alaska Native60 2.5% Asian41 2.9% Other race167 3.0% Two or more races953 2.9% White alone, not Hispanic / Latino129 3.0% Hispanic or LatinoMoved from different state 214 0.6% White / Caucasian29 0.3% Black or African American4 1.1% American Indian / Alaska Native153 6.3% Asian242 4.3% Two or more races218 0.7% White alone, not Hispanic / Latino101 2.4% Hispanic or LatinoMoved from abroad 80 0.2% White71 0.8% Black or African American18 0.3% Two or more races80 0.2% White alone, not Hispanic / Latino25 0.6% Hispanic or Latino
Children Nativity (place of birth) in Battle Creek
Children under 6 years - Living with two parents Both parents native 1,563 100.0% Native0 0.0% Foreign-bornBoth parents foreign-born 187 80.0% Native47 20.0% Foreign-bornOne native, one foreign-born parent 125 100.0% NativeChildren under 6 years - Living with one parent Native parent 1,760 100.0% NativeForeign-born parent 212 100.0% NativeChildren 6 to 17 years - Living with two parents Both parents native 2,883 99.8% Native7 0.2% Foreign-bornBoth parents foreign-born 341 47.4% Native379 52.6% Foreign-bornOne native, one foreign-born parent 222 100.0% NativeChildren 6 to 17 years - Living with one parent Native parent 4,563 100.0% NativeForeign-born parent 256 49.3% Native264 50.7% Foreign-born
Grandparents responsible for own grandchildren in Battle Creek
Grandparents (30 to 59 years) White / Caucasian 157 23.1% Responsible for grandchildren522 76.9% Not responsible for grandchildrenBlack or African American 53 84.6% Responsible for grandchildren10 15.4% Not responsible for grandchildrenTwo or more races 83 100.0% Not responsible for grandchildrenWhite alone, not Hispanic / Latino 157 23.1% Responsible for grandchildren522 76.9% Not responsible for grandchildrenHispanic or Latino 19 100.0% Not responsible for grandchildrenGrandparents (60 years and over) White / Caucasian 187 66.0% Responsible for grandchildren96 34.0% Not responsible for grandchildrenTwo or more races 53 100.0% Not responsible for grandchildrenWhite alone, not Hispanic / Latino 191 65.0% Responsible for grandchildren103 35.0% Not responsible for grandchildrenHispanic or Latino 41 100.0% Not responsible for grandchildren