Races in Bellaire, Texas (TX) Detailed Stats
Data:
Races - White alone (%)
Races - White alone (% change since 2000)
Races - Black alone (%)
Races - Black alone (% change since 2000)
Races - American Indian alone (%)
Races - American Indian alone (% change since 2000)
Races - Asian alone (%)
Races - Asian alone (% change since 2000)
Races - Hispanic (%)
Races - Hispanic (% change since 2000)
Races - Native Hawaiian and Other Pacific Islander alone (%)
Races - Native Hawaiian and Other Pacific Islander alone (% change since 2000)
Races - Two or more races(%)
Races - Two or more races(% change since 2000)
Races - Other race alone (%)
Races - Other race alone (% change since 2000)
Racial diversity
Place of birth - Born in state of residence (%)
Place of birth - Born in state of residence (%) - White
Place of birth - Born in state of residence (%) - Black or African American
Place of birth - Born in state of residence (%) - Asian
Place of birth - Born in state of residence (%) - Hispanic or Latino
Place of birth - Born in state of residence (%) - American Indian and Alaska Native
Place of birth - Born in state of residence (%) - Multirace
Place of birth - Born in state of residence (%) - Other Race
Place of birth - Born in other state (%)
Place of birth - Born in other state (%) - White
Place of birth - Born in other state (%) - Black or African American
Place of birth - Born in other state (%) - Asian
Place of birth - Born in other state (%) - Hispanic or Latino
Place of birth - Born in other state (%) - American Indian and Alaska Native
Place of birth - Born in other state (%) - Multirace
Place of birth - Born in other state (%) - Other Race
Place of birth - Native, outside of US (%)
Place of birth - Native, outside of US (%) - White
Place of birth - Native, outside of US (%) - Black or African American
Place of birth - Native, outside of US (%) - Asian
Place of birth - Native, outside of US (%) - Hispanic or Latino
Place of birth - Native, outside of US (%) - American Indian and Alaska Native
Place of birth - Native, outside of US (%) - Multirace
Place of birth - Native, outside of US (%) - Other Race
Place of birth - Foreign born (%)
Place of birth - Foreign born (%) - White
Place of birth - Foreign born (%) - Black or African American
Place of birth - Foreign born (%) - Asian
Place of birth - Foreign born (%) - Hispanic or Latino
Place of birth - Foreign born (%) - American Indian and Alaska Native
Place of birth - Foreign born (%) - Multirace
Place of birth - Foreign born (%) - Other Race
Residents speaking English at home (%)
Residents speaking English at home - Born in the United States (%)
Residents speaking English at home - Native, born elsewhere (%)
Residents speaking English at home - Foreign born (%)
Residents speaking Spanish at home (%)
Residents speaking Spanish at home - Born in the United States (%)
Residents speaking Spanish at home - Native, born elsewhere (%)
Residents speaking Spanish at home - Foreign born (%)
Residents speaking other language at home (%)
Residents speaking other language at home - Born in the United States (%)
Residents speaking other language at home - Native, born elsewhere (%)
Residents speaking other language at home - Foreign born (%)
Marital status - Never married (%)
Marital status - Now married (%)
Marital status - Separated (%)
Marital status - Widowed (%)
Marital status - Divorced (%)
Ancestries Reported - Arab (%)
Ancestries Reported - Czech (%)
Ancestries Reported - Danish (%)
Ancestries Reported - Dutch (%)
Ancestries Reported - English (%)
Ancestries Reported - French (%)
Ancestries Reported - French Canadian (%)
Ancestries Reported - German (%)
Ancestries Reported - Greek (%)
Ancestries Reported - Hungarian (%)
Ancestries Reported - Irish (%)
Ancestries Reported - Italian (%)
Ancestries Reported - Lithuanian (%)
Ancestries Reported - Norwegian (%)
Ancestries Reported - Polish (%)
Ancestries Reported - Portuguese (%)
Ancestries Reported - Russian (%)
Ancestries Reported - Scotch-Irish (%)
Ancestries Reported - Scottish (%)
Ancestries Reported - Slovak (%)
Ancestries Reported - Subsaharan African (%)
Ancestries Reported - Swedish (%)
Ancestries Reported - Swiss (%)
Ancestries Reported - Ukrainian (%)
Ancestries Reported - United States (%)
Ancestries Reported - Welsh (%)
Ancestries Reported - West Indian (%)
Ancestries Reported - Other (%)
Geographical mobility - Same house 1 year ago (%)
Geographical mobility - Same house 1 year ago (%) - White
Geographical mobility - Same house 1 year ago (%) - Black or African American
Geographical mobility - Same house 1 year ago (%) - Asian
Geographical mobility - Same house 1 year ago (%) - Hispanic or Latino
Geographical mobility - Same house 1 year ago (%) - American Indian and Alaska Native
Geographical mobility - Same house 1 year ago (%) - Multirace
Geographical mobility - Same house 1 year ago (%) - Other Race
Geographical mobility - Moved within same county (%)
Geographical mobility - Moved within same county (%) - White
Geographical mobility - Moved within same county (%) - Black or African American
Geographical mobility - Moved within same county (%) - Asian
Geographical mobility - Moved within same county (%) - Hispanic or Latino
Geographical mobility - Moved within same county (%) - American Indian and Alaska Native
Geographical mobility - Moved within same county (%) - Multirace
Geographical mobility - Moved within same county (%) - Other Race
Geographical mobility - Moved from different county within same state (%)
Geographical mobility - Moved from different county within same state (%) - White
Geographical mobility - Moved from different county within same state (%) - Black or African American
Geographical mobility - Moved from different county within same state (%) - Asian
Geographical mobility - Moved from different county within same state (%) - Hispanic or Latino
Geographical mobility - Moved from different county within same state (%) - American Indian and Alaska Native
Geographical mobility - Moved from different county within same state (%) - Multirace
Geographical mobility - Moved from different county within same state (%) - Other Race
Geographical mobility - Moved from different state (%)
Geographical mobility - Moved from different state (%) - White
Geographical mobility - Moved from different state (%) - Black or African American
Geographical mobility - Moved from different state (%) - Asian
Geographical mobility - Moved from different state (%) - Hispanic or Latino
Geographical mobility - Moved from different state (%) - American Indian and Alaska Native
Geographical mobility - Moved from different state (%) - Multirace
Geographical mobility - Moved from different state (%) - Other Race
Geographical mobility - Moved from abroad (%)
Geographical mobility - Moved from abroad (%) - White
Geographical mobility - Moved from abroad (%) - Black or African American
Geographical mobility - Moved from abroad (%) - Asian
Geographical mobility - Moved from abroad (%) - Hispanic or Latino
Geographical mobility - Moved from abroad (%) - American Indian and Alaska Native
Geographical mobility - Moved from abroad (%) - Multirace
Geographical mobility - Moved from abroad (%) - Other Race
Place of birth for the foreign-born population - Ireland (%)
Place of birth for the foreign-born population - Denmark (%)
Place of birth for the foreign-born population - Norway (%)
Place of birth for the foreign-born population - Sweden (%)
Place of birth for the foreign-born population - United Kingdom (%)
Place of birth for the foreign-born population - England (%)
Place of birth for the foreign-born population - Scotland (%)
Place of birth for the foreign-born population - Other Northern Europe (%)
Place of birth for the foreign-born population - Austria (%)
Place of birth for the foreign-born population - Belgium (%)
Place of birth for the foreign-born population - France (%)
Place of birth for the foreign-born population - Germany (%)
Place of birth for the foreign-born population - Netherlands (%)
Place of birth for the foreign-born population - Switzerland (%)
Place of birth for the foreign-born population - Other Western Europe (%)
Place of birth for the foreign-born population - Greece (%)
Place of birth for the foreign-born population - Italy (%)
Place of birth for the foreign-born population - Portugal (%)
Place of birth for the foreign-born population - Spain (%)
Place of birth for the foreign-born population - Other Southern Europe (%)
Place of birth for the foreign-born population - Albania (%)
Place of birth for the foreign-born population - Belarus (%)
Place of birth for the foreign-born population - Bosnia and Herzegovina (%)
Place of birth for the foreign-born population - Bulgaria (%)
Place of birth for the foreign-born population - Croatia (%)
Place of birth for the foreign-born population - Czechoslovakia (%)
Place of birth for the foreign-born population - Hungary (%)
Place of birth for the foreign-born population - Latvia (%)
Place of birth for the foreign-born population - Lithuania (%)
Place of birth for the foreign-born population - North Macedonia (Macedonia) (%)
Place of birth for the foreign-born population - Moldova (%)
Place of birth for the foreign-born population - Poland (%)
Place of birth for the foreign-born population - Romania (%)
Place of birth for the foreign-born population - Russia (%)
Place of birth for the foreign-born population - Serbia (%)
Place of birth for the foreign-born population - Ukraine (%)
Place of birth for the foreign-born population - Other Eastern Europe (%)
Place of birth for the foreign-born population - China (%)
Place of birth for the foreign-born population - Hong Kong (%)
Place of birth for the foreign-born population - Taiwan (%)
Place of birth for the foreign-born population - Japan (%)
Place of birth for the foreign-born population - Korea (%)
Place of birth for the foreign-born population - Other Eastern Asia (%)
Place of birth for the foreign-born population - Afghanistan (%)
Place of birth for the foreign-born population - Bangladesh (%)
Place of birth for the foreign-born population - India (%)
Place of birth for the foreign-born population - Iran (%)
Place of birth for the foreign-born population - Kazakhstan (%)
Place of birth for the foreign-born population - Nepal (%)
Place of birth for the foreign-born population - Pakistan (%)
Place of birth for the foreign-born population - Sri Lanka (%)
Place of birth for the foreign-born population - Uzbekistan (%)
Place of birth for the foreign-born population - Other South Central Asia (%)
Place of birth for the foreign-born population - Burma (%)
Place of birth for the foreign-born population - Cambodia (%)
Place of birth for the foreign-born population - Indonesia (%)
Place of birth for the foreign-born population - Laos (%)
Place of birth for the foreign-born population - Malaysia (%)
Place of birth for the foreign-born population - Philippines (%)
Place of birth for the foreign-born population - Singapore (%)
Place of birth for the foreign-born population - Thailand (%)
Place of birth for the foreign-born population - Vietnam (%)
Place of birth for the foreign-born population - Other South Eastern Asia (%)
Place of birth for the foreign-born population - Armenia (%)
Place of birth for the foreign-born population - Iraq (%)
Place of birth for the foreign-born population - Israel (%)
Place of birth for the foreign-born population - Jordan (%)
Place of birth for the foreign-born population - Kuwait (%)
Place of birth for the foreign-born population - Lebanon (%)
Place of birth for the foreign-born population - Saudi Arabia (%)
Place of birth for the foreign-born population - Syria (%)
Place of birth for the foreign-born population - Turkey (%)
Place of birth for the foreign-born population - Yemen (%)
Place of birth for the foreign-born population - Other Western Asia (%)
Place of birth for the foreign-born population - Eritrea (%)
Place of birth for the foreign-born population - Ethiopia (%)
Place of birth for the foreign-born population - Kenya (%)
Place of birth for the foreign-born population - Somalia (%)
Place of birth for the foreign-born population - Uganda (%)
Place of birth for the foreign-born population - Zimbabwe (%)
Place of birth for the foreign-born population - Other Eastern Africa (%)
Place of birth for the foreign-born population - Cameroon (%)
Place of birth for the foreign-born population - Congo (%)
Place of birth for the foreign-born population - Democratic Republic of Congo (Zaire) (%)
Place of birth for the foreign-born population - Other Middle Africa (%)
Place of birth for the foreign-born population - Egypt (%)
Place of birth for the foreign-born population - Morocco (%)
Place of birth for the foreign-born population - Sudan (%)
Place of birth for the foreign-born population - Other Northern Africa (%)
Place of birth for the foreign-born population - South Africa (%)
Place of birth for the foreign-born population - Other Southern Africa (%)
Place of birth for the foreign-born population - Cabo Verde (%)
Place of birth for the foreign-born population - Ghana (%)
Place of birth for the foreign-born population - Liberia (%)
Place of birth for the foreign-born population - Nigeria (%)
Place of birth for the foreign-born population - Senegal (%)
Place of birth for the foreign-born population - Sierra Leone (%)
Place of birth for the foreign-born population - Other Western Africa (%)
Place of birth for the foreign-born population - Australia (%)
Place of birth for the foreign-born population - New Zealand (%)
Place of birth for the foreign-born population - Fiji (%)
Place of birth for the foreign-born population - Micronesia (%)
Place of birth for the foreign-born population - Bahamas (%)
Place of birth for the foreign-born population - Barbados (%)
Place of birth for the foreign-born population - Cuba (%)
Place of birth for the foreign-born population - Dominica (%)
Place of birth for the foreign-born population - Dominican Republic (%)
Place of birth for the foreign-born population - Grenada (%)
Place of birth for the foreign-born population - Haiti (%)
Place of birth for the foreign-born population - Jamaica (%)
Place of birth for the foreign-born population - St. Vincent and the Grenadines (%)
Place of birth for the foreign-born population - Trinidad and Tobago (%)
Place of birth for the foreign-born population - West Indies (%)
Place of birth for the foreign-born population - Other Caribbean (%)
Place of birth for the foreign-born population - Belize (%)
Place of birth for the foreign-born population - Costa Rica (%)
Place of birth for the foreign-born population - El Salvador (%)
Place of birth for the foreign-born population - Guatemala (%)
Place of birth for the foreign-born population - Honduras (%)
Place of birth for the foreign-born population - Mexico (%)
Place of birth for the foreign-born population - Nicaragua (%)
Place of birth for the foreign-born population - Panama (%)
Place of birth for the foreign-born population - Other Central America (%)
Place of birth for the foreign-born population - Argentina (%)
Place of birth for the foreign-born population - Bolivia (%)
Place of birth for the foreign-born population - Brazil (%)
Place of birth for the foreign-born population - Chile (%)
Place of birth for the foreign-born population - Colombia (%)
Place of birth for the foreign-born population - Ecuador (%)
Place of birth for the foreign-born population - Guyana (%)
Place of birth for the foreign-born population - Peru (%)
Place of birth for the foreign-born population - Uruguay (%)
Place of birth for the foreign-born population - Venezuela (%)
Place of birth for the foreign-born population - Other South America (%)
Place of birth for the foreign-born population - Canada (%)
Place of birth for the foreign-born population - Other Northern America (%)
Place of birth for the foreign-born population - Other (%)
Latest news about races in Bellaire, TX collected exclusively by city-data.com from local newspapers, TV, and radio stations
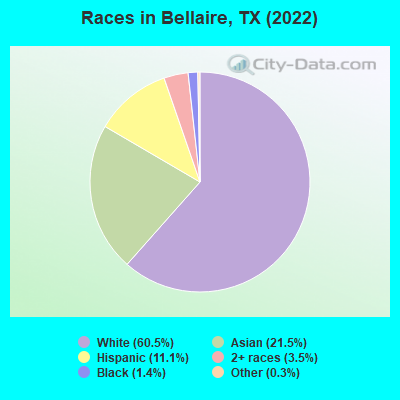
According to 2022 data, the most numerous races in Bellaire, TX are Hispanic (1,919 residents), White alone (10,511 residents), and Black alone (248 residents). 70.4% of Bellaire residents speak English at home. 23.1% of Bellaire, TX residents are foreign-born (12.1% born in Asia, 3.7% born in Europe, 3.4% born in Latin America, 3.4% born in Africa), which is 26.4% greater than the foreign-born rate of 17.0% across the entire state of Texas.
Race distribution in Bellaire
2000 2022
10,933,313 52.4% White alone 6,669,666 32.0% Hispanic 2,364,255 11.3% Black alone 554,445 2.7% Asian alone 230,567 1.1% Two or more races 68,859 0.3% American Indian alone 19,958 0.10% Other race alone 10,757 0.05% Native Hawaiian and Other
12,070,642 40.2% Hispanic 11,683,430 38.9% White alone 3,508,706 11.7% Black alone 1,608,173 5.4% Asian alone 956,560 3.2% Two or more races 125,763 0.4% Other race alone 47,023 0.2% American Indian alone 29,275 0.10% Native Hawaiian and Other
Income and house value in Bellaire Median household income in 2022 $197,031 White non-Hispanic householdersover $200,000 Black householdersover $200,000 Asian householders$139,415 Some other race householdersover $200,000 Two or more races householders$140,116 Hispanic or Latino race householdersMedian 2022 house value over $1,000,000 White Non-Hispanic householders$403,767 Black or African American householders$206,237 American Indian or Alaska Native householders over $1,000,000 Asian householders$716,332 Some other race householdersover $1,000,000 Two or more races householders$806,618 Hispanic or Latino householders
Median age by race in Bellaire
52.5 Median age for White residents51.6 53.2 18.8 Median age for Black or African American residents48.7 15.8 -618,034,447.2 Median age for American Indian / Alaska Native residents-598,187,310.6 -652,037,616.9 40.7 Median age for Asian residents40.4 40.9 -782,795,698.1 Median age for Native Hawaiian / Pacific Islander residents-633,771,929.2 -816,367,264.7 46.4 Median age for Other race residents53.5 37.9 17.9 Median age for Two or more races residents18.6 16.9 49.3 Median age for White alone residents49.5 48.7 41.0 Median age for Hispanic or Latino residents39.2 49.9
Owner/renter occupied households by race in Bellaire
House owners and renters - White residents 3,378 89.6% Owner occupied392 10.4% Renter occupiedHouse owners and renters - Black or African American residents 50 73.4% Owner occupied18 26.6% Renter occupiedHouse owners and renters - Asian residents 1,149 96.1% Owner occupied46 3.9% Renter occupiedHouse owners and renters - Other race residents 28 11.4% Owner occupied217 88.6% Renter occupiedHouse owners and renters - Two or more races residents 312 78.7% Owner occupied85 21.3% Renter occupiedHouse owners and renters - White alone residents 3,587 87.7% Owner occupied503 12.3% Renter occupiedHouse owners and renters - Hispanic or Latino residents 581 75.8% Owner occupied186 24.2% Renter occupied
Language usage in Bellaire
English speakers - Total 70.4% of residents of Bellaire speak English at home.
5.9% of residents speak Spanish at home 799 81.3% Speak English very well184 18.7% Speak English less than very well23.3% of residents speak other language at home 2,774 72.0% Speak English very well1,081 28.0% Speak English less than very well
English speakers - Born in the United States 90.0% of residents of Bellaire speak English at home.
3.6% of residents speak Spanish at home 127 80.9% Speak English very well30 19.1% Speak English less than very well7.1% of residents speak other language at home 297 94.3% Speak English very well18 5.7% Speak English less than very well
English speakers - Native, born elsewhere 63.0% of residents of Bellaire speak English at home.
24.5% of residents speak Spanish at home 82 89.1% Speak English very well10 10.9% Speak English less than very well12.8% of residents speak other language at home 22 45.8% Speak English very well26 54.2% Speak English less than very well
English speakers - Foreign-born 18.0% of residents of Bellaire speak English at home.
13.4% of residents speak Spanish at home 424 79.5% Speak English very well109 20.5% Speak English less than very well65.7% of residents speak other language at home 1,948 74.3% Speak English very well675 25.7% Speak English less than very well
White (Caucasian) - Speak only English Native:
100.0% (8,020)Foreign-born:
32.5% (216)
White (Caucasian) - Speak another language Native:
2.8% (221)Foreign-born:
71.0% (473)
Black or African American - Speak only English Native:
77.5% (135)Foreign-born:
62.7% (61)
Black or African American - Speak another language Native:
24.7% (43)Foreign-born:
30.7% (30)
Asian - Speak only English Native:
54.3% (836)Foreign-born:
18.8% (378)
Asian - Speak another language Native:
45.8% (705)Foreign-born:
81.2% (1,629)
Other race - Speak another language Native:
77.6% (348)Foreign-born:
100.0% (29)
Two or more races - Speak another language Native:
21.8% (263)Foreign-born:
100.0% (485)
White alone - Speak only English Native:
96.9% (8,750)Foreign-born:
19.2% (206)
White alone - Speak another language Native:
3.0% (270)Foreign-born:
79.9% (855)
Hispanic or Latino - Speak only English Native:
51.1% (629)Foreign-born:
11.2% (62)
Hispanic or Latino - Speak another language Native:
48.3% (594)Foreign-born:
89.0% (489)
Foreign-born residents in Bellaire 4,010 residents are foreign born (12.1% Asia , 3.7% Europe , 3.4% Latin America , 3.4% Africa ).
This city:
23.1%Texas:
17.1%
Marital status for residents in Bellaire Marital status - White (Caucasian) population 15 years and over
Males 23.5% Never married70.3% Now married0.6% Separated1.1% Widowed4.5% DivorcedFemales 21.6% Never married66.9% Now married0.0% Separated4.2% Widowed7.4% DivorcedWomen who gave birth in the past 12 months Now married:
100.0% (23)Unmarried:
0.0% (0)
Women who did not give birth in the past 12 months Now married:
56.9% (880)Unmarried:
43.1% (666)
Marital status - Black or African American population 15 years and over
Males 23.0% Never married64.9% Now married12.2% Separated0.0% Widowed0.0% DivorcedFemales 46.8% Never married45.9% Now married0.0% Separated0.0% Widowed7.2% DivorcedWomen who did not give birth in the past 12 months Now married:
41.8% (38)Unmarried:
58.2% (53)
Marital status - Asian population 15 years and over
Males 17.3% Never married81.8% Now married0.0% Separated0.0% Widowed0.9% DivorcedFemales 8.2% Never married82.2% Now married3.2% Separated4.1% Widowed2.4% DivorcedWomen who gave birth in the past 12 months Now married:
100.0% (8)Unmarried:
0.0% (0)
Women who did not give birth in the past 12 months Now married:
86.2% (700)Unmarried:
13.8% (112)
Marital status - Other race population 15 years and over
Males 71.7% Never married18.9% Now married0.0% Separated0.0% Widowed9.4% DivorcedFemales 88.2% Never married8.3% Now married0.0% Separated0.0% Widowed3.5% DivorcedWomen who did not give birth in the past 12 months Now married:
13.9% (30)Unmarried:
86.1% (188)
Marital status - Two or more races population 15 years and over
Males 28.7% Never married69.8% Now married0.0% Separated0.0% Widowed1.5% DivorcedFemales 35.1% Never married46.4% Now married0.0% Separated0.0% Widowed18.6% DivorcedWomen who gave birth in the past 12 months Now married:
100.0% (3)Unmarried:
0.0% (0)
Women who did not give birth in the past 12 months Now married:
33.1% (74)Unmarried:
66.9% (149)
Marital status - White alone, not Hispanic / Latino population 15 years and over
Males 21.2% Never married72.2% Now married0.6% Separated1.2% Widowed4.9% DivorcedFemales 21.3% Never married68.2% Now married0.0% Separated3.5% Widowed7.0% DivorcedWomen who gave birth in the past 12 months Now married:
100.0% (32)Unmarried:
0.0% (0)
Women who did not give birth in the past 12 months Now married:
58.2% (1,167)Unmarried:
41.8% (837)
Marital status - Hispanic or Latino population 15 years and over
Males 42.0% Never married57.0% Now married0.0% Separated0.0% Widowed1.0% DivorcedFemales 47.2% Never married34.5% Now married0.0% Separated5.2% Widowed13.2% DivorcedWomen who gave birth in the past 12 months Now married:
100.0% (2)Unmarried:
0.0% (0)
Women who did not give birth in the past 12 months Now married:
24.8% (83)Unmarried:
75.2% (253)
Ancestries in Bellaire
759 8.0% English742 7.9% American521 5.5% German394 4.2% Czech311 3.3% Eastern European285 3.0% Egyptian260 2.8% Russian225 2.4% Irish164 1.7% Italian137 1.5% Norwegian129 1.4% French90 1.0% Polish85 0.9% European53 0.6% Lebanese52 0.6% Swedish47 0.5% Northern European47 0.5% Scotch-Irish43 0.5% Dutch39 0.4% Scottish35 0.4% Turkish33 0.3% British22 0.2% Finnish22 0.2% Greek21 0.2% Austrian18 0.2% Armenian14 0.1% Portuguese14 0.1% Nigerian13 0.1% Romanian11 0.1% Danish9 0.10% Iranian8 0.08% French Canadian8 0.08% Ethiopian8 0.08% Syrian7 0.07% Lithuanian6 0.06% Israeli5 0.05% Scandinavian5 0.05% Australian5 0.05% Welsh4 0.04% South African
Geographical mobility in Bellaire Same house 1 year ago 7,909 92.4% White (Caucasian)260 94.3% Black or African American4 100.0% American Indian / Alaska Native3,303 87.6% Asian511 98.4% Other race1,624 91.5% Two or more races9,727 92.7% White alone, not Hispanic / Latino1,822 94.9% Hispanic or LatinoMoved within same county 434 5.1% White / Caucasian8 2.8% Black or African American207 5.5% Asian130 7.3% Two or more races595 5.7% White alone, not Hispanic / Latino66 3.4% Hispanic or LatinoMoved within same state 28 0.3% White / Caucasian8 3.0% Black or African American29 0.3% White alone, not Hispanic / Latino1 0.1% Hispanic or LatinoMoved from different state 203 2.4% White / Caucasian122 3.2% Asian19 1.1% Two or more races171 1.6% White alone, not Hispanic / Latino38 2.0% Hispanic or LatinoMoved from abroad 8 0.1% White153 4.0% Asian9 0.1% White alone, not Hispanic / Latino
Children Nativity (place of birth) in Bellaire
Children under 6 years - Living with two parents Both parents native 416 95.2% Native21 4.8% Foreign-bornBoth parents foreign-born 338 100.0% NativeOne native, one foreign-born parent 156 100.0% NativeChildren under 6 years - Living with one parent Native parent 10 100.0% NativeChildren 6 to 17 years - Living with two parents Both parents native 1,698 99.5% Native8 0.5% Foreign-bornBoth parents foreign-born 772 95.5% Native37 4.5% Foreign-bornOne native, one foreign-born parent 629 99.1% Native6 0.9% Foreign-bornChildren 6 to 17 years - Living with one parent Native parent 126 100.0% NativeForeign-born parent 42 50.8% Native40 49.2% Foreign-born
Grandparents responsible for own grandchildren in Bellaire
Grandparents (30 to 59 years) Asian 21 100.0% Not responsible for grandchildren
Grandparents (60 years and over) Asian 87 100.0% Not responsible for grandchildren