Races in Belton, Missouri (MO) Detailed Stats
Data:
Races - White alone (%)
Races - White alone (% change since 2000)
Races - Black alone (%)
Races - Black alone (% change since 2000)
Races - American Indian alone (%)
Races - American Indian alone (% change since 2000)
Races - Asian alone (%)
Races - Asian alone (% change since 2000)
Races - Hispanic (%)
Races - Hispanic (% change since 2000)
Races - Native Hawaiian and Other Pacific Islander alone (%)
Races - Native Hawaiian and Other Pacific Islander alone (% change since 2000)
Races - Two or more races(%)
Races - Two or more races(% change since 2000)
Races - Other race alone (%)
Races - Other race alone (% change since 2000)
Racial diversity
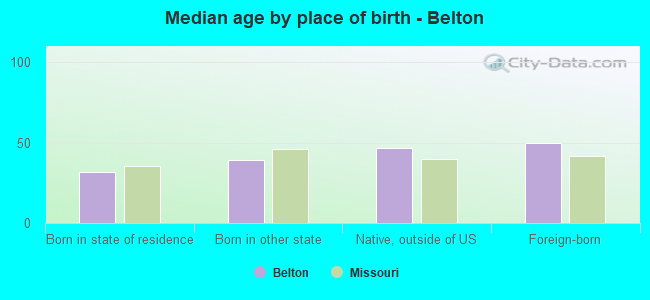
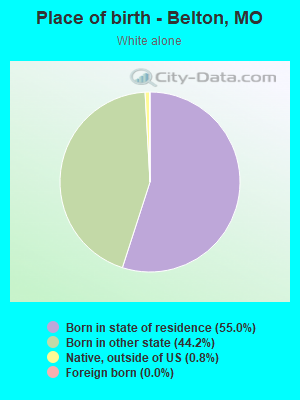
Place of birth - Born in state of residence (%)
Place of birth - Born in state of residence (%) - White
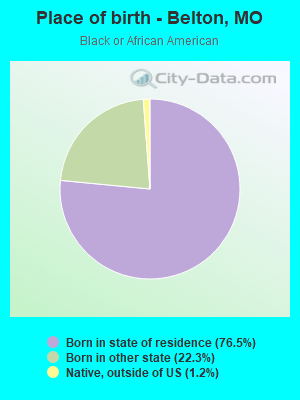
Place of birth - Born in state of residence (%) - Black or African American
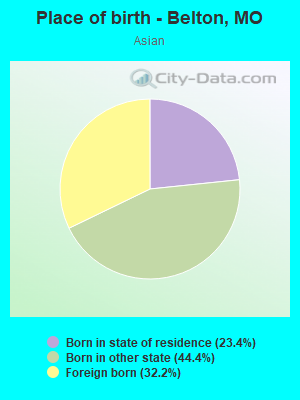
Place of birth - Born in state of residence (%) - Asian
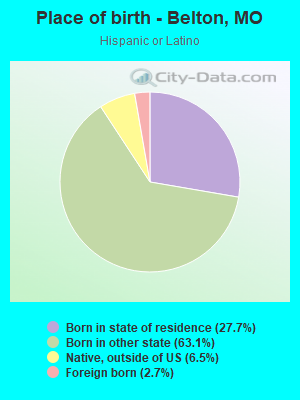
Place of birth - Born in state of residence (%) - Hispanic or Latino
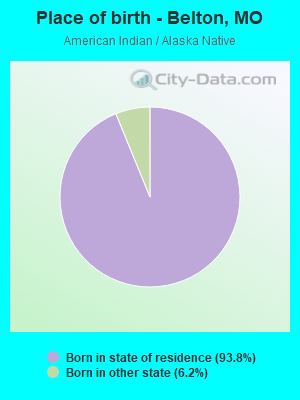
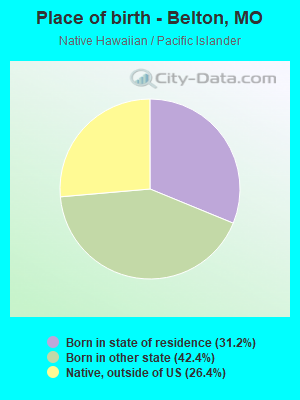
Place of birth - Born in state of residence (%) - American Indian and Alaska Native
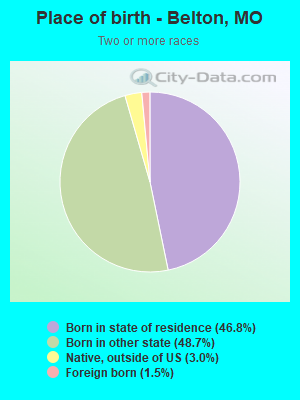
Place of birth - Born in state of residence (%) - Multirace
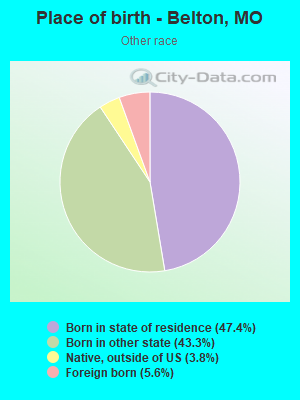
Place of birth - Born in state of residence (%) - Other Race
Place of birth - Born in other state (%)
Place of birth - Born in other state (%) - White
Place of birth - Born in other state (%) - Black or African American
Place of birth - Born in other state (%) - Asian
Place of birth - Born in other state (%) - Hispanic or Latino
Place of birth - Born in other state (%) - American Indian and Alaska Native
Place of birth - Born in other state (%) - Multirace
Place of birth - Born in other state (%) - Other Race
Place of birth - Native, outside of US (%)
Place of birth - Native, outside of US (%) - White
Place of birth - Native, outside of US (%) - Black or African American
Place of birth - Native, outside of US (%) - Asian
Place of birth - Native, outside of US (%) - Hispanic or Latino
Place of birth - Native, outside of US (%) - American Indian and Alaska Native
Place of birth - Native, outside of US (%) - Multirace
Place of birth - Native, outside of US (%) - Other Race
Place of birth - Foreign born (%)
Place of birth - Foreign born (%) - White
Place of birth - Foreign born (%) - Black or African American
Place of birth - Foreign born (%) - Asian
Place of birth - Foreign born (%) - Hispanic or Latino
Place of birth - Foreign born (%) - American Indian and Alaska Native
Place of birth - Foreign born (%) - Multirace
Place of birth - Foreign born (%) - Other Race
Residents speaking English at home (%)
Residents speaking English at home - Born in the United States (%)
Residents speaking English at home - Native, born elsewhere (%)
Residents speaking English at home - Foreign born (%)
Residents speaking Spanish at home (%)
Residents speaking Spanish at home - Born in the United States (%)
Residents speaking Spanish at home - Native, born elsewhere (%)
Residents speaking Spanish at home - Foreign born (%)
Residents speaking other language at home (%)
Residents speaking other language at home - Born in the United States (%)
Residents speaking other language at home - Native, born elsewhere (%)
Residents speaking other language at home - Foreign born (%)
Marital status - Never married (%)
Marital status - Now married (%)
Marital status - Separated (%)
Marital status - Widowed (%)
Marital status - Divorced (%)
Ancestries Reported - Arab (%)
Ancestries Reported - Czech (%)
Ancestries Reported - Danish (%)
Ancestries Reported - Dutch (%)
Ancestries Reported - English (%)
Ancestries Reported - French (%)
Ancestries Reported - French Canadian (%)
Ancestries Reported - German (%)
Ancestries Reported - Greek (%)
Ancestries Reported - Hungarian (%)
Ancestries Reported - Irish (%)
Ancestries Reported - Italian (%)
Ancestries Reported - Lithuanian (%)
Ancestries Reported - Norwegian (%)
Ancestries Reported - Polish (%)
Ancestries Reported - Portuguese (%)
Ancestries Reported - Russian (%)
Ancestries Reported - Scotch-Irish (%)
Ancestries Reported - Scottish (%)
Ancestries Reported - Slovak (%)
Ancestries Reported - Subsaharan African (%)
Ancestries Reported - Swedish (%)
Ancestries Reported - Swiss (%)
Ancestries Reported - Ukrainian (%)
Ancestries Reported - United States (%)
Ancestries Reported - Welsh (%)
Ancestries Reported - West Indian (%)
Ancestries Reported - Other (%)
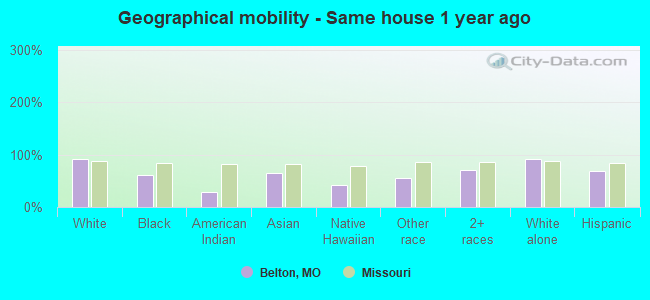
Geographical mobility - Same house 1 year ago (%)
Geographical mobility - Same house 1 year ago (%) - White
Geographical mobility - Same house 1 year ago (%) - Black or African American
Geographical mobility - Same house 1 year ago (%) - Asian
Geographical mobility - Same house 1 year ago (%) - Hispanic or Latino
Geographical mobility - Same house 1 year ago (%) - American Indian and Alaska Native
Geographical mobility - Same house 1 year ago (%) - Multirace
Geographical mobility - Same house 1 year ago (%) - Other Race
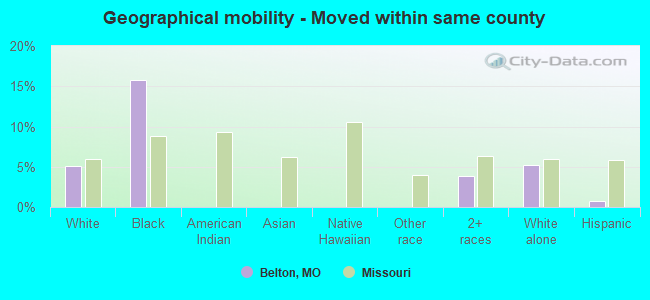
Geographical mobility - Moved within same county (%)
Geographical mobility - Moved within same county (%) - White
Geographical mobility - Moved within same county (%) - Black or African American
Geographical mobility - Moved within same county (%) - Asian
Geographical mobility - Moved within same county (%) - Hispanic or Latino
Geographical mobility - Moved within same county (%) - American Indian and Alaska Native
Geographical mobility - Moved within same county (%) - Multirace
Geographical mobility - Moved within same county (%) - Other Race
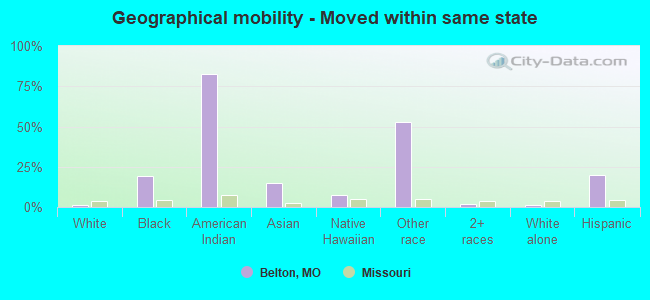
Geographical mobility - Moved from different county within same state (%)
Geographical mobility - Moved from different county within same state (%) - White
Geographical mobility - Moved from different county within same state (%) - Black or African American
Geographical mobility - Moved from different county within same state (%) - Asian
Geographical mobility - Moved from different county within same state (%) - Hispanic or Latino
Geographical mobility - Moved from different county within same state (%) - American Indian and Alaska Native
Geographical mobility - Moved from different county within same state (%) - Multirace
Geographical mobility - Moved from different county within same state (%) - Other Race
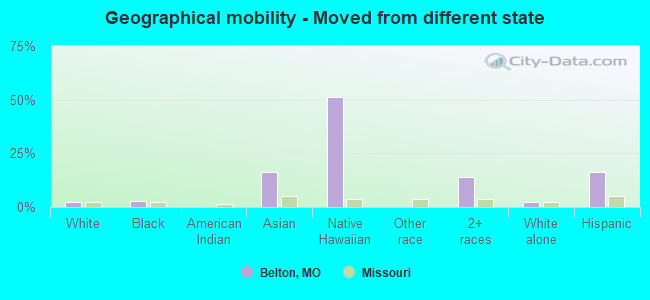
Geographical mobility - Moved from different state (%)
Geographical mobility - Moved from different state (%) - White
Geographical mobility - Moved from different state (%) - Black or African American
Geographical mobility - Moved from different state (%) - Asian
Geographical mobility - Moved from different state (%) - Hispanic or Latino
Geographical mobility - Moved from different state (%) - American Indian and Alaska Native
Geographical mobility - Moved from different state (%) - Multirace
Geographical mobility - Moved from different state (%) - Other Race
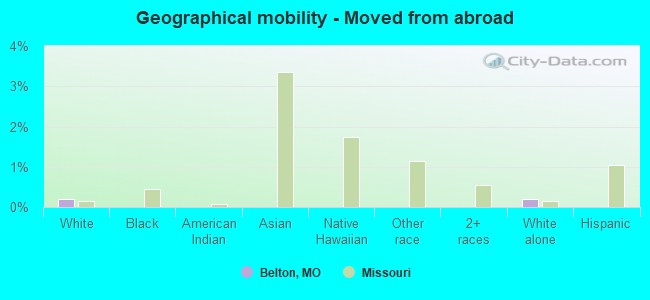
Geographical mobility - Moved from abroad (%)
Geographical mobility - Moved from abroad (%) - White
Geographical mobility - Moved from abroad (%) - Black or African American
Geographical mobility - Moved from abroad (%) - Asian
Geographical mobility - Moved from abroad (%) - Hispanic or Latino
Geographical mobility - Moved from abroad (%) - American Indian and Alaska Native
Geographical mobility - Moved from abroad (%) - Multirace
Geographical mobility - Moved from abroad (%) - Other Race
Place of birth for the foreign-born population - Ireland (%)
Place of birth for the foreign-born population - Denmark (%)
Place of birth for the foreign-born population - Norway (%)
Place of birth for the foreign-born population - Sweden (%)
Place of birth for the foreign-born population - United Kingdom (%)
Place of birth for the foreign-born population - England (%)
Place of birth for the foreign-born population - Scotland (%)
Place of birth for the foreign-born population - Other Northern Europe (%)
Place of birth for the foreign-born population - Austria (%)
Place of birth for the foreign-born population - Belgium (%)
Place of birth for the foreign-born population - France (%)
Place of birth for the foreign-born population - Germany (%)
Place of birth for the foreign-born population - Netherlands (%)
Place of birth for the foreign-born population - Switzerland (%)
Place of birth for the foreign-born population - Other Western Europe (%)
Place of birth for the foreign-born population - Greece (%)
Place of birth for the foreign-born population - Italy (%)
Place of birth for the foreign-born population - Portugal (%)
Place of birth for the foreign-born population - Spain (%)
Place of birth for the foreign-born population - Other Southern Europe (%)
Place of birth for the foreign-born population - Albania (%)
Place of birth for the foreign-born population - Belarus (%)
Place of birth for the foreign-born population - Bosnia and Herzegovina (%)
Place of birth for the foreign-born population - Bulgaria (%)
Place of birth for the foreign-born population - Croatia (%)
Place of birth for the foreign-born population - Czechoslovakia (%)
Place of birth for the foreign-born population - Hungary (%)
Place of birth for the foreign-born population - Latvia (%)
Place of birth for the foreign-born population - Lithuania (%)
Place of birth for the foreign-born population - North Macedonia (Macedonia) (%)
Place of birth for the foreign-born population - Moldova (%)
Place of birth for the foreign-born population - Poland (%)
Place of birth for the foreign-born population - Romania (%)
Place of birth for the foreign-born population - Russia (%)
Place of birth for the foreign-born population - Serbia (%)
Place of birth for the foreign-born population - Ukraine (%)
Place of birth for the foreign-born population - Other Eastern Europe (%)
Place of birth for the foreign-born population - China (%)
Place of birth for the foreign-born population - Hong Kong (%)
Place of birth for the foreign-born population - Taiwan (%)
Place of birth for the foreign-born population - Japan (%)
Place of birth for the foreign-born population - Korea (%)
Place of birth for the foreign-born population - Other Eastern Asia (%)
Place of birth for the foreign-born population - Afghanistan (%)
Place of birth for the foreign-born population - Bangladesh (%)
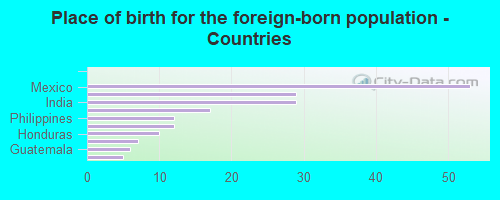
Place of birth for the foreign-born population - India (%)
Place of birth for the foreign-born population - Iran (%)
Place of birth for the foreign-born population - Kazakhstan (%)
Place of birth for the foreign-born population - Nepal (%)
Place of birth for the foreign-born population - Pakistan (%)
Place of birth for the foreign-born population - Sri Lanka (%)
Place of birth for the foreign-born population - Uzbekistan (%)
Place of birth for the foreign-born population - Other South Central Asia (%)
Place of birth for the foreign-born population - Burma (%)
Place of birth for the foreign-born population - Cambodia (%)
Place of birth for the foreign-born population - Indonesia (%)
Place of birth for the foreign-born population - Laos (%)
Place of birth for the foreign-born population - Malaysia (%)
Place of birth for the foreign-born population - Philippines (%)
Place of birth for the foreign-born population - Singapore (%)
Place of birth for the foreign-born population - Thailand (%)
Place of birth for the foreign-born population - Vietnam (%)
Place of birth for the foreign-born population - Other South Eastern Asia (%)
Place of birth for the foreign-born population - Armenia (%)
Place of birth for the foreign-born population - Iraq (%)
Place of birth for the foreign-born population - Israel (%)
Place of birth for the foreign-born population - Jordan (%)
Place of birth for the foreign-born population - Kuwait (%)
Place of birth for the foreign-born population - Lebanon (%)
Place of birth for the foreign-born population - Saudi Arabia (%)
Place of birth for the foreign-born population - Syria (%)
Place of birth for the foreign-born population - Turkey (%)
Place of birth for the foreign-born population - Yemen (%)
Place of birth for the foreign-born population - Other Western Asia (%)
Place of birth for the foreign-born population - Eritrea (%)
Place of birth for the foreign-born population - Ethiopia (%)
Place of birth for the foreign-born population - Kenya (%)
Place of birth for the foreign-born population - Somalia (%)
Place of birth for the foreign-born population - Uganda (%)
Place of birth for the foreign-born population - Zimbabwe (%)
Place of birth for the foreign-born population - Other Eastern Africa (%)
Place of birth for the foreign-born population - Cameroon (%)
Place of birth for the foreign-born population - Congo (%)
Place of birth for the foreign-born population - Democratic Republic of Congo (Zaire) (%)
Place of birth for the foreign-born population - Other Middle Africa (%)
Place of birth for the foreign-born population - Egypt (%)
Place of birth for the foreign-born population - Morocco (%)
Place of birth for the foreign-born population - Sudan (%)
Place of birth for the foreign-born population - Other Northern Africa (%)
Place of birth for the foreign-born population - South Africa (%)
Place of birth for the foreign-born population - Other Southern Africa (%)
Place of birth for the foreign-born population - Cabo Verde (%)
Place of birth for the foreign-born population - Ghana (%)
Place of birth for the foreign-born population - Liberia (%)
Place of birth for the foreign-born population - Nigeria (%)
Place of birth for the foreign-born population - Senegal (%)
Place of birth for the foreign-born population - Sierra Leone (%)
Place of birth for the foreign-born population - Other Western Africa (%)
Place of birth for the foreign-born population - Australia (%)
Place of birth for the foreign-born population - New Zealand (%)
Place of birth for the foreign-born population - Fiji (%)
Place of birth for the foreign-born population - Micronesia (%)
Place of birth for the foreign-born population - Bahamas (%)
Place of birth for the foreign-born population - Barbados (%)
Place of birth for the foreign-born population - Cuba (%)
Place of birth for the foreign-born population - Dominica (%)
Place of birth for the foreign-born population - Dominican Republic (%)
Place of birth for the foreign-born population - Grenada (%)
Place of birth for the foreign-born population - Haiti (%)
Place of birth for the foreign-born population - Jamaica (%)
Place of birth for the foreign-born population - St. Vincent and the Grenadines (%)
Place of birth for the foreign-born population - Trinidad and Tobago (%)
Place of birth for the foreign-born population - West Indies (%)
Place of birth for the foreign-born population - Other Caribbean (%)
Place of birth for the foreign-born population - Belize (%)
Place of birth for the foreign-born population - Costa Rica (%)
Place of birth for the foreign-born population - El Salvador (%)
Place of birth for the foreign-born population - Guatemala (%)
Place of birth for the foreign-born population - Honduras (%)
Place of birth for the foreign-born population - Mexico (%)
Place of birth for the foreign-born population - Nicaragua (%)
Place of birth for the foreign-born population - Panama (%)
Place of birth for the foreign-born population - Other Central America (%)
Place of birth for the foreign-born population - Argentina (%)
Place of birth for the foreign-born population - Bolivia (%)
Place of birth for the foreign-born population - Brazil (%)
Place of birth for the foreign-born population - Chile (%)
Place of birth for the foreign-born population - Colombia (%)
Place of birth for the foreign-born population - Ecuador (%)
Place of birth for the foreign-born population - Guyana (%)
Place of birth for the foreign-born population - Peru (%)
Place of birth for the foreign-born population - Uruguay (%)
Place of birth for the foreign-born population - Venezuela (%)
Place of birth for the foreign-born population - Other South America (%)
Place of birth for the foreign-born population - Canada (%)
Place of birth for the foreign-born population - Other Northern America (%)
Place of birth for the foreign-born population - Other (%)
Latest news about races in Belton, MO collected exclusively by city-data.com from local newspapers, TV, and radio stations
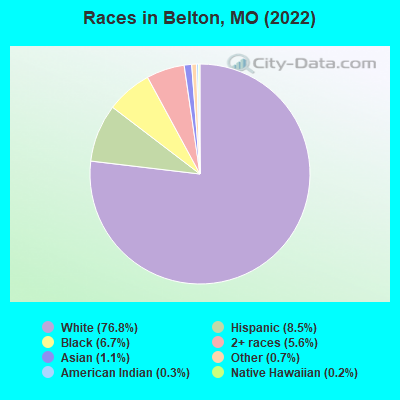
According to 2022 data, the most numerous races in Belton, MO are White alone (18,985 residents), Black alone (1,646 residents), and Two or more races (1,375 residents). 97.0% of Belton residents speak English at home. 0.8% of Belton, MO residents are foreign-born , which is 431.8% less than the foreign-born rate of 4.0% across the entire state of Missouri.
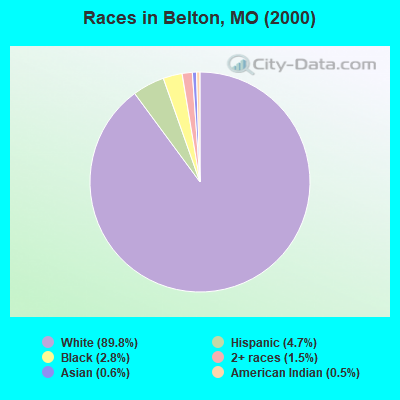
Race distribution in Belton
2000 2022
4,686,474 83.8% White alone 625,667 11.2% Black alone 118,592 2.1% Hispanic 71,905 1.3% Two or more races 61,041 1.1% Asian alone 23,302 0.4% American Indian alone 5,291 0.09% Other race alone 2,939 0.05% Native Hawaiian and Other
4,733,411 76.6% White alone 656,739 10.6% Black alone 316,300 5.1% Two or more races 291,763 4.7% Hispanic 132,436 2.1% Asian alone 27,467 0.4% Other race alone 12,313 0.2% American Indian alone 7,528 0.1% Native Hawaiian and Other
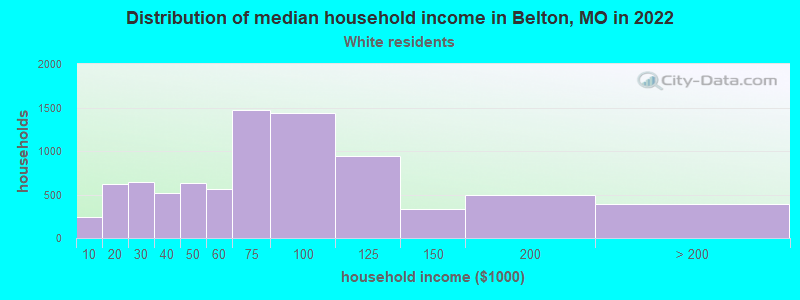
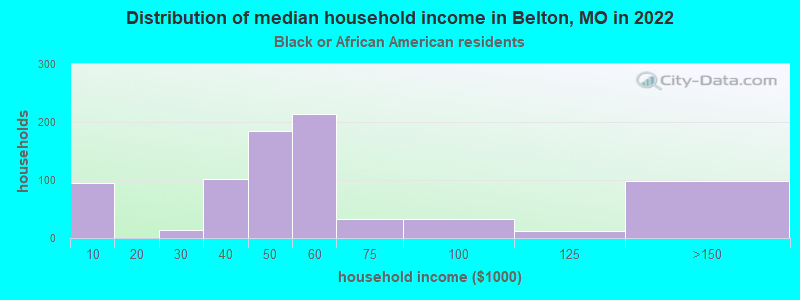
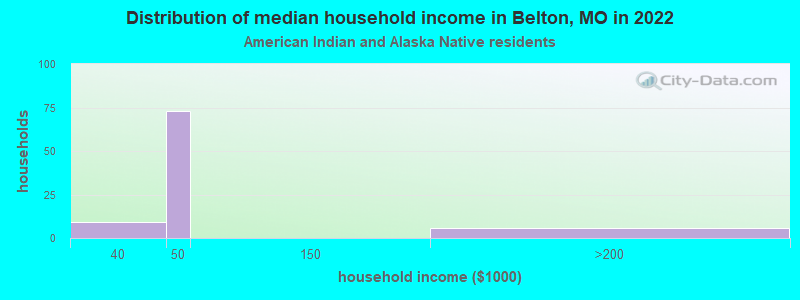
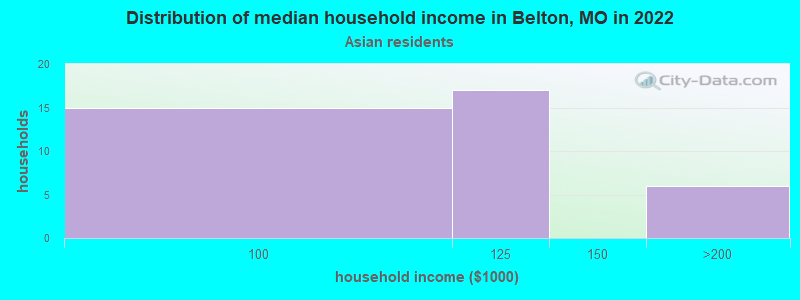
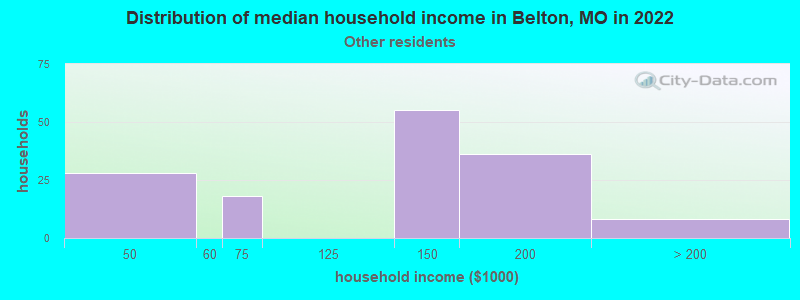
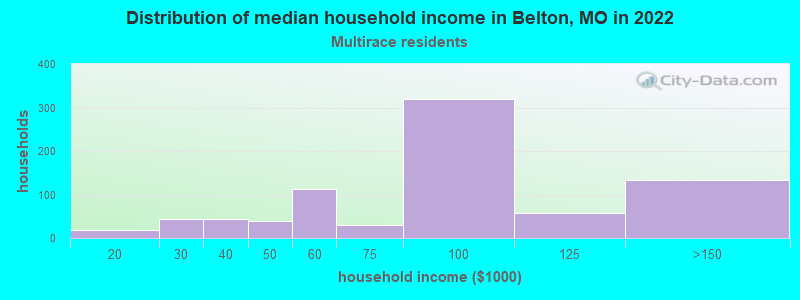
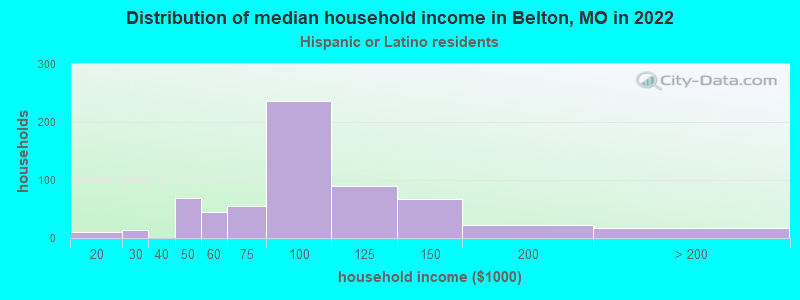
Income and house value in Belton Median household income in 2022 $63,205 White non-Hispanic householders$46,467 Black householders$59,305 American Indian and Alaska Native householders$95,587 Asian householders$68,563 Two or more races householders$72,395 Hispanic or Latino race householdersMedian 2022 house value $226,478 White Non-Hispanic householders$221,445 Black or African American householders$167,090 American Indian or Alaska Native householders $408,919 Asian householders$408,919 Native Hawaiian and other Pacific Islander householders$231,007 Some other race householders$86,816 Two or more races householders$231,762 Hispanic or Latino householders
Median age by race in Belton
39.2 Median age for White residents38.3 40.4 29.0 Median age for Black or African American residents22.1 41.0 48.0 Median age for American Indian / Alaska Native residents-652,291,104.5 -729,166,665.9 32.4 Median age for Asian residents24.8 49.4 46.3 Median age for Native Hawaiian / Pacific Islander residents33.0 36.4 28.5 Median age for Other race residents31.0 17.8 20.3 Median age for Two or more races residents37.1 13.2 39.0 Median age for White alone residents38.5 40.7 30.6 Median age for Hispanic or Latino residents30.3 36.9
Owner/renter occupied households by race in Belton
House owners and renters - White residents 5,289 64.8% Owner occupied2,877 35.2% Renter occupiedHouse owners and renters - Black or African American residents 108 8.9% Owner occupied1,103 91.1% Renter occupiedHouse owners and renters - American Indian / Alaska Native residents 72 100.0% Owner occupiedHouse owners and renters - Asian residents 38 100.0% Owner occupiedHouse owners and renters - Native Hawaiian / Pacific Islander residents 12 100.0% Renter occupiedHouse owners and renters - Other race residents 90 54.4% Owner occupied76 45.6% Renter occupiedHouse owners and renters - Two or more races residents 317 40.5% Owner occupied467 59.5% Renter occupiedHouse owners and renters - White alone residents 5,219 65.5% Owner occupied2,750 34.5% Renter occupiedHouse owners and renters - Hispanic or Latino residents 284 40.1% Owner occupied424 59.9% Renter occupied
Language usage in Belton
English speakers - Total 97.0% of residents of Belton speak English at home.
1.9% of residents speak Spanish at home 374 87.2% Speak English very well55 12.8% Speak English less than very well1.1% of residents speak other language at home 148 62.2% Speak English very well90 37.8% Speak English less than very well
English speakers - Born in the United States 96.8% of residents of Belton speak English at home.
2.1% of residents speak Spanish at home 157 80.5% Speak English very well38 19.5% Speak English less than very well1.1% of residents speak other language at home 47 49.0% Speak English very well49 51.0% Speak English less than very well
English speakers - Native, born elsewhere 79.1% of residents of Belton speak English at home.
15.2% of residents speak Spanish at home 58 100.0% Speak English very well1.6% of residents speak other language at home 6 100.0% Speak English very well
English speakers - Foreign-born 13.4% of residents of Belton speak English at home.
47.6% of residents speak Spanish at home 72 80.9% Speak English very well17 19.1% Speak English less than very well38.5% of residents speak other language at home 42 58.3% Speak English very well30 41.7% Speak English less than very well
White (Caucasian) - Speak only English Native:
98.9% (18,051)Foreign-born:
30.7% (5)
White (Caucasian) - Speak another language Native:
1.0% (181)Foreign-born:
100.0% (15)
Asian - Speak only English Native:
40.2% (69)Foreign-born:
9.8% (8)
Asian - Speak another language Native:
54.6% (94)Foreign-born:
90.3% (73)
Other race - Speak another language Native:
17.6% (108)Foreign-born:
94.9% (41)
Two or more races - Speak only English Native:
97.3% (1,874)Foreign-born:
15.9% (14)
Two or more races - Speak another language Native:
1.5% (29)Foreign-born:
79.3% (68)
White alone - Speak only English Native:
99.3% (17,813)Foreign-born:
72.6% (5)
Hispanic or Latino - Speak only English Native:
88.6% (1,413)Foreign-born:
14.1% (15)
Hispanic or Latino - Speak another language Native:
12.7% (202)Foreign-born:
86.0% (91)
Foreign-born residents in Belton 186 residents are foreign born
This city:
0.8%Missouri:
4.2%
Marital status for residents in Belton Marital status - White (Caucasian) population 15 years and over
Males 32.0% Never married54.3% Now married0.6% Separated2.3% Widowed10.8% DivorcedFemales 24.6% Never married49.2% Now married2.3% Separated7.6% Widowed16.3% DivorcedWomen who gave birth in the past 12 months Now married:
48.0% (115)Unmarried:
52.0% (125)
Women who did not give birth in the past 12 months Now married:
50.0% (2,155)Unmarried:
50.0% (2,153)
Marital status - Black or African American population 15 years and over
Males 19.0% Never married66.8% Now married0.0% Separated0.0% Widowed14.2% DivorcedFemales 24.8% Never married29.1% Now married16.8% Separated2.2% Widowed27.0% DivorcedWomen who gave birth in the past 12 months Now married:
0.0% (0)Unmarried:
100.0% (105)
Women who did not give birth in the past 12 months Now married:
64.8% (266)Unmarried:
35.2% (144)
Marital status - American Indian / Alaska Native population 15 years and over
Males 37.5% Never married62.5% Now married0.0% Separated0.0% Widowed0.0% DivorcedFemales 0.0% Never married0.0% Now married0.0% Separated100.0% Widowed0.0% DivorcedMarital status - Asian population 15 years and over
Males 55.3% Never married30.9% Now married10.6% Separated0.0% Widowed3.3% DivorcedFemales 16.3% Never married36.7% Now married0.0% Separated0.0% Widowed46.9% DivorcedWomen who gave birth in the past 12 months Now married:
100.0% (9)Unmarried:
0.0% (0)
Women who did not give birth in the past 12 months Now married:
33.3% (14)Unmarried:
66.7% (28)
Marital status - Native Hawaiian / Pacific Islander population 15 years and over
Males 0.0% Never married100.0% Now married0.0% Separated0.0% Widowed0.0% DivorcedFemales 15.6% Never married40.6% Now married0.0% Separated0.0% Widowed43.8% DivorcedWomen who did not give birth in the past 12 months Now married:
40.6% (10)Unmarried:
59.4% (15)
Marital status - Other race population 15 years and over
Males 20.1% Never married34.9% Now married0.0% Separated5.4% Widowed39.6% DivorcedFemales 37.0% Never married57.6% Now married0.0% Separated5.4% Widowed0.0% DivorcedWomen who did not give birth in the past 12 months Now married:
79.4% (103)Unmarried:
20.6% (27)
Marital status - Two or more races population 15 years and over
Males 42.9% Never married35.0% Now married8.7% Separated2.2% Widowed11.3% DivorcedFemales 50.0% Never married28.9% Now married0.0% Separated5.3% Widowed15.7% DivorcedWomen who gave birth in the past 12 months Now married:
8.3% (3)Unmarried:
91.7% (34)
Women who did not give birth in the past 12 months Now married:
15.3% (63)Unmarried:
84.7% (350)
Marital status - White alone, not Hispanic / Latino population 15 years and over
Males 31.8% Never married54.8% Now married0.6% Separated2.4% Widowed10.4% DivorcedFemales 24.6% Never married48.8% Now married2.2% Separated7.8% Widowed16.7% DivorcedWomen who gave birth in the past 12 months Now married:
45.8% (106)Unmarried:
54.2% (126)
Women who did not give birth in the past 12 months Now married:
49.6% (2,087)Unmarried:
50.4% (2,119)
Marital status - Hispanic or Latino population 15 years and over
Males 31.9% Never married45.3% Now married7.1% Separated0.0% Widowed15.7% DivorcedFemales 43.5% Never married42.8% Now married2.4% Separated1.7% Widowed9.7% DivorcedWomen who gave birth in the past 12 months Now married:
100.0% (11)Unmarried:
0.0% (0)
Women who did not give birth in the past 12 months Now married:
38.1% (171)Unmarried:
61.9% (277)
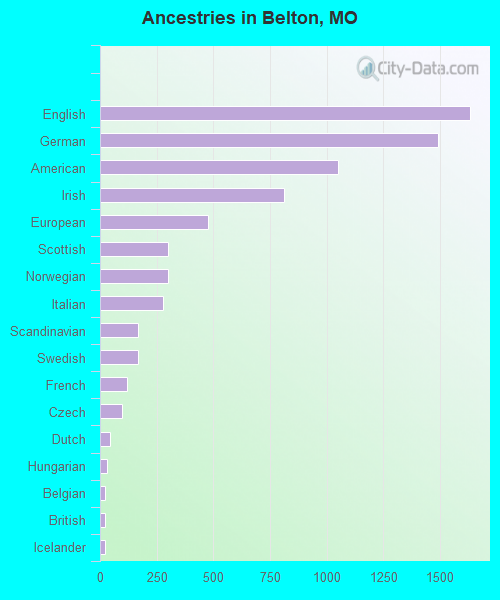
Ancestries in Belton
1,635 17.5% English1,492 16.0% German1,052 11.3% American814 8.7% Irish477 5.1% European299 3.2% Scottish298 3.2% Norwegian280 3.0% Italian167 1.8% Scandinavian166 1.8% Swedish117 1.3% French99 1.1% Czech42 0.4% Dutch31 0.3% Hungarian23 0.2% Belgian21 0.2% British21 0.2% Icelander11 0.1% French Canadian11 0.1% Greek7 0.07% Northern European5 0.05% Croatian5 0.05% Welsh3 0.03% Polish
Children Nativity (place of birth) in Belton
Children under 6 years - Living with two parents Both parents native 766 100.0% NativeOne native, one foreign-born parent 79 100.0% NativeChildren under 6 years - Living with one parent Native parent 1,063 100.0% NativeForeign-born parent 10 100.0% NativeChildren 6 to 17 years - Living with two parents Both parents native 2,387 100.0% NativeOne native, one foreign-born parent 38 100.0% NativeChildren 6 to 17 years - Living with one parent Native parent 1,312 100.0% NativeForeign-born parent 18 51.6% Native16 48.4% Foreign-born
Grandparents responsible for own grandchildren in Belton
Grandparents (30 to 59 years) White / Caucasian 10 7.4% Responsible for grandchildren131 92.6% Not responsible for grandchildrenBlack or African American 41 91.6% Responsible for grandchildren4 8.4% Not responsible for grandchildrenWhite alone, not Hispanic / Latino 10 7.9% Responsible for grandchildren122 92.1% Not responsible for grandchildrenHispanic or Latino 8 100.0% Not responsible for grandchildrenGrandparents (60 years and over) White / Caucasian 20 16.7% Responsible for grandchildren99 83.3% Not responsible for grandchildrenBlack or African American 11 100.0% Responsible for grandchildrenWhite alone, not Hispanic / Latino 20 16.7% Responsible for grandchildren99 83.3% Not responsible for grandchildren