Races in Benicia, California (CA) Detailed Stats
Data:
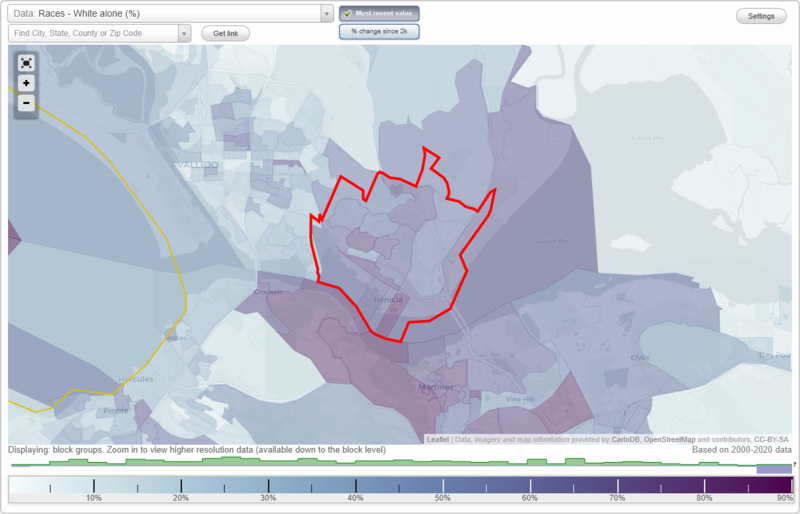
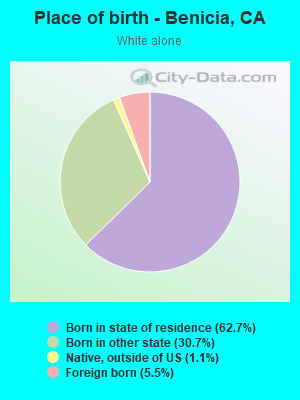
Races - White alone (%)
Races - White alone (% change since 2000)
Races - Black alone (%)
Races - Black alone (% change since 2000)
Races - American Indian alone (%)
Races - American Indian alone (% change since 2000)
Races - Asian alone (%)
Races - Asian alone (% change since 2000)
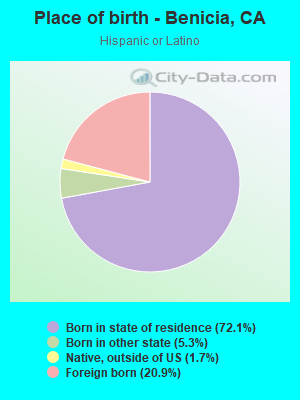
Races - Hispanic (%)
Races - Hispanic (% change since 2000)
Races - Native Hawaiian and Other Pacific Islander alone (%)
Races - Native Hawaiian and Other Pacific Islander alone (% change since 2000)
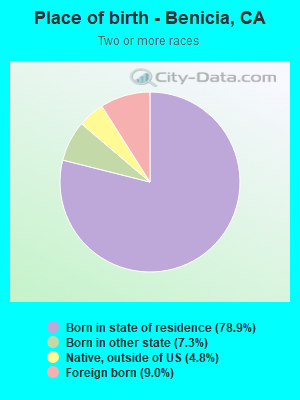
Races - Two or more races(%)
Races - Two or more races(% change since 2000)
Races - Other race alone (%)
Races - Other race alone (% change since 2000)
Racial diversity
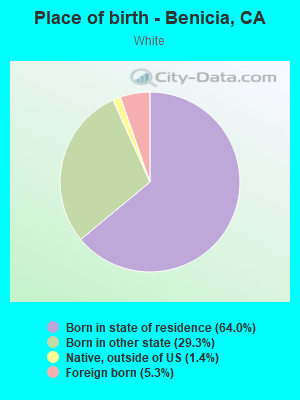
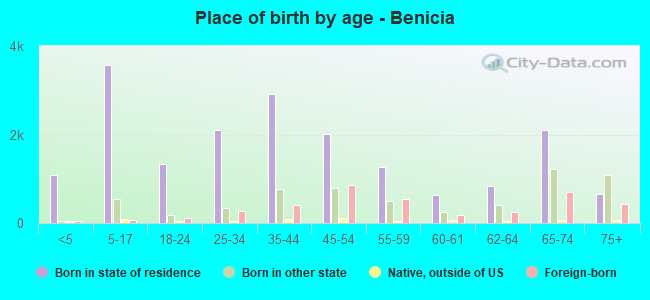
Place of birth - Born in state of residence (%)
Place of birth - Born in state of residence (%) - White
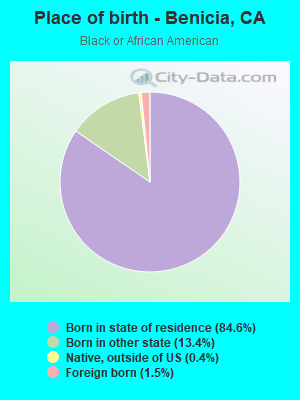
Place of birth - Born in state of residence (%) - Black or African American
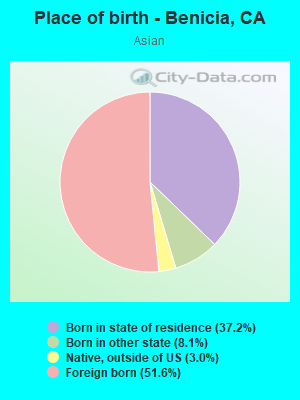
Place of birth - Born in state of residence (%) - Asian
Place of birth - Born in state of residence (%) - Hispanic or Latino
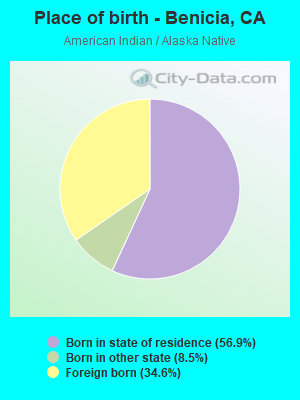
Place of birth - Born in state of residence (%) - American Indian and Alaska Native
Place of birth - Born in state of residence (%) - Multirace
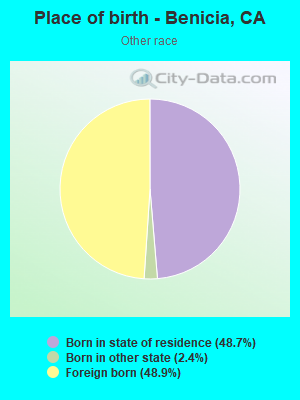
Place of birth - Born in state of residence (%) - Other Race
Place of birth - Born in other state (%)
Place of birth - Born in other state (%) - White
Place of birth - Born in other state (%) - Black or African American
Place of birth - Born in other state (%) - Asian
Place of birth - Born in other state (%) - Hispanic or Latino
Place of birth - Born in other state (%) - American Indian and Alaska Native
Place of birth - Born in other state (%) - Multirace
Place of birth - Born in other state (%) - Other Race
Place of birth - Native, outside of US (%)
Place of birth - Native, outside of US (%) - White
Place of birth - Native, outside of US (%) - Black or African American
Place of birth - Native, outside of US (%) - Asian
Place of birth - Native, outside of US (%) - Hispanic or Latino
Place of birth - Native, outside of US (%) - American Indian and Alaska Native
Place of birth - Native, outside of US (%) - Multirace
Place of birth - Native, outside of US (%) - Other Race
Place of birth - Foreign born (%)
Place of birth - Foreign born (%) - White
Place of birth - Foreign born (%) - Black or African American
Place of birth - Foreign born (%) - Asian
Place of birth - Foreign born (%) - Hispanic or Latino
Place of birth - Foreign born (%) - American Indian and Alaska Native
Place of birth - Foreign born (%) - Multirace
Place of birth - Foreign born (%) - Other Race
Residents speaking English at home (%)
Residents speaking English at home - Born in the United States (%)
Residents speaking English at home - Native, born elsewhere (%)
Residents speaking English at home - Foreign born (%)
Residents speaking Spanish at home (%)
Residents speaking Spanish at home - Born in the United States (%)
Residents speaking Spanish at home - Native, born elsewhere (%)
Residents speaking Spanish at home - Foreign born (%)
Residents speaking other language at home (%)
Residents speaking other language at home - Born in the United States (%)
Residents speaking other language at home - Native, born elsewhere (%)
Residents speaking other language at home - Foreign born (%)
Marital status - Never married (%)
Marital status - Now married (%)
Marital status - Separated (%)
Marital status - Widowed (%)
Marital status - Divorced (%)
Ancestries Reported - Arab (%)
Ancestries Reported - Czech (%)
Ancestries Reported - Danish (%)
Ancestries Reported - Dutch (%)
Ancestries Reported - English (%)
Ancestries Reported - French (%)
Ancestries Reported - French Canadian (%)
Ancestries Reported - German (%)
Ancestries Reported - Greek (%)
Ancestries Reported - Hungarian (%)
Ancestries Reported - Irish (%)
Ancestries Reported - Italian (%)
Ancestries Reported - Lithuanian (%)
Ancestries Reported - Norwegian (%)
Ancestries Reported - Polish (%)
Ancestries Reported - Portuguese (%)
Ancestries Reported - Russian (%)
Ancestries Reported - Scotch-Irish (%)
Ancestries Reported - Scottish (%)
Ancestries Reported - Slovak (%)
Ancestries Reported - Subsaharan African (%)
Ancestries Reported - Swedish (%)
Ancestries Reported - Swiss (%)
Ancestries Reported - Ukrainian (%)
Ancestries Reported - United States (%)
Ancestries Reported - Welsh (%)
Ancestries Reported - West Indian (%)
Ancestries Reported - Other (%)
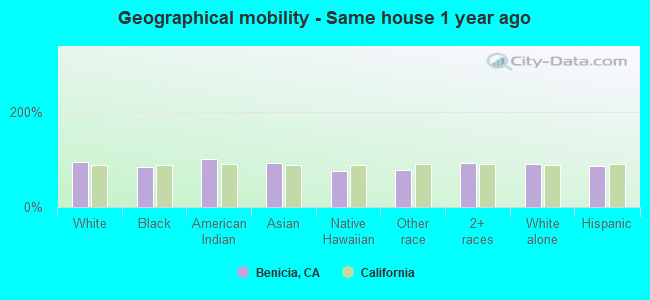
Geographical mobility - Same house 1 year ago (%)
Geographical mobility - Same house 1 year ago (%) - White
Geographical mobility - Same house 1 year ago (%) - Black or African American
Geographical mobility - Same house 1 year ago (%) - Asian
Geographical mobility - Same house 1 year ago (%) - Hispanic or Latino
Geographical mobility - Same house 1 year ago (%) - American Indian and Alaska Native
Geographical mobility - Same house 1 year ago (%) - Multirace
Geographical mobility - Same house 1 year ago (%) - Other Race
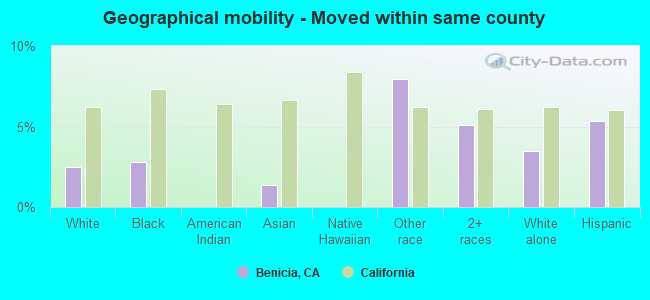
Geographical mobility - Moved within same county (%)
Geographical mobility - Moved within same county (%) - White
Geographical mobility - Moved within same county (%) - Black or African American
Geographical mobility - Moved within same county (%) - Asian
Geographical mobility - Moved within same county (%) - Hispanic or Latino
Geographical mobility - Moved within same county (%) - American Indian and Alaska Native
Geographical mobility - Moved within same county (%) - Multirace
Geographical mobility - Moved within same county (%) - Other Race
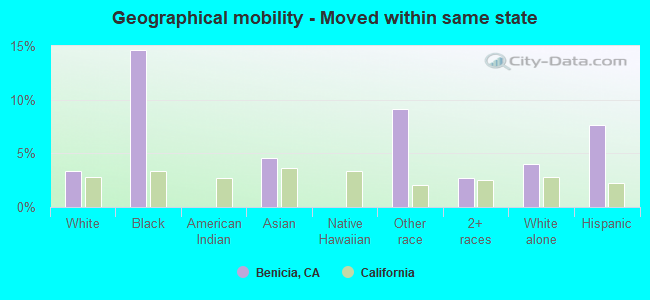
Geographical mobility - Moved from different county within same state (%)
Geographical mobility - Moved from different county within same state (%) - White
Geographical mobility - Moved from different county within same state (%) - Black or African American
Geographical mobility - Moved from different county within same state (%) - Asian
Geographical mobility - Moved from different county within same state (%) - Hispanic or Latino
Geographical mobility - Moved from different county within same state (%) - American Indian and Alaska Native
Geographical mobility - Moved from different county within same state (%) - Multirace
Geographical mobility - Moved from different county within same state (%) - Other Race
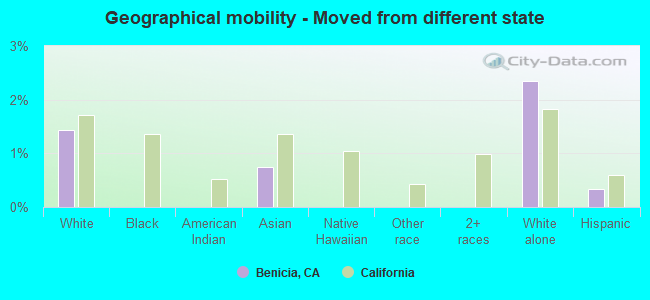
Geographical mobility - Moved from different state (%)
Geographical mobility - Moved from different state (%) - White
Geographical mobility - Moved from different state (%) - Black or African American
Geographical mobility - Moved from different state (%) - Asian
Geographical mobility - Moved from different state (%) - Hispanic or Latino
Geographical mobility - Moved from different state (%) - American Indian and Alaska Native
Geographical mobility - Moved from different state (%) - Multirace
Geographical mobility - Moved from different state (%) - Other Race
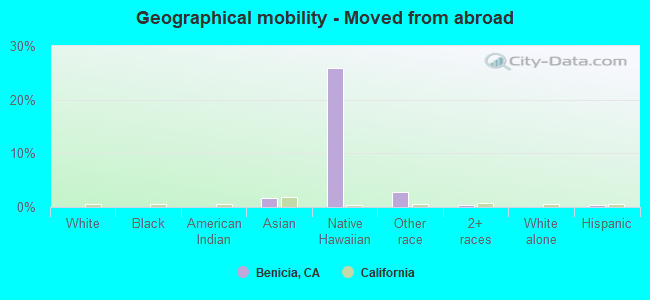
Geographical mobility - Moved from abroad (%)
Geographical mobility - Moved from abroad (%) - White
Geographical mobility - Moved from abroad (%) - Black or African American
Geographical mobility - Moved from abroad (%) - Asian
Geographical mobility - Moved from abroad (%) - Hispanic or Latino
Geographical mobility - Moved from abroad (%) - American Indian and Alaska Native
Geographical mobility - Moved from abroad (%) - Multirace
Geographical mobility - Moved from abroad (%) - Other Race
Place of birth for the foreign-born population - Ireland (%)
Place of birth for the foreign-born population - Denmark (%)
Place of birth for the foreign-born population - Norway (%)
Place of birth for the foreign-born population - Sweden (%)
Place of birth for the foreign-born population - United Kingdom (%)
Place of birth for the foreign-born population - England (%)
Place of birth for the foreign-born population - Scotland (%)
Place of birth for the foreign-born population - Other Northern Europe (%)
Place of birth for the foreign-born population - Austria (%)
Place of birth for the foreign-born population - Belgium (%)
Place of birth for the foreign-born population - France (%)
Place of birth for the foreign-born population - Germany (%)
Place of birth for the foreign-born population - Netherlands (%)
Place of birth for the foreign-born population - Switzerland (%)
Place of birth for the foreign-born population - Other Western Europe (%)
Place of birth for the foreign-born population - Greece (%)
Place of birth for the foreign-born population - Italy (%)
Place of birth for the foreign-born population - Portugal (%)
Place of birth for the foreign-born population - Spain (%)
Place of birth for the foreign-born population - Other Southern Europe (%)
Place of birth for the foreign-born population - Albania (%)
Place of birth for the foreign-born population - Belarus (%)
Place of birth for the foreign-born population - Bosnia and Herzegovina (%)
Place of birth for the foreign-born population - Bulgaria (%)
Place of birth for the foreign-born population - Croatia (%)
Place of birth for the foreign-born population - Czechoslovakia (%)
Place of birth for the foreign-born population - Hungary (%)
Place of birth for the foreign-born population - Latvia (%)
Place of birth for the foreign-born population - Lithuania (%)
Place of birth for the foreign-born population - North Macedonia (Macedonia) (%)
Place of birth for the foreign-born population - Moldova (%)
Place of birth for the foreign-born population - Poland (%)
Place of birth for the foreign-born population - Romania (%)
Place of birth for the foreign-born population - Russia (%)
Place of birth for the foreign-born population - Serbia (%)
Place of birth for the foreign-born population - Ukraine (%)
Place of birth for the foreign-born population - Other Eastern Europe (%)
Place of birth for the foreign-born population - China (%)
Place of birth for the foreign-born population - Hong Kong (%)
Place of birth for the foreign-born population - Taiwan (%)
Place of birth for the foreign-born population - Japan (%)
Place of birth for the foreign-born population - Korea (%)
Place of birth for the foreign-born population - Other Eastern Asia (%)
Place of birth for the foreign-born population - Afghanistan (%)
Place of birth for the foreign-born population - Bangladesh (%)
Place of birth for the foreign-born population - India (%)
Place of birth for the foreign-born population - Iran (%)
Place of birth for the foreign-born population - Kazakhstan (%)
Place of birth for the foreign-born population - Nepal (%)
Place of birth for the foreign-born population - Pakistan (%)
Place of birth for the foreign-born population - Sri Lanka (%)
Place of birth for the foreign-born population - Uzbekistan (%)
Place of birth for the foreign-born population - Other South Central Asia (%)
Place of birth for the foreign-born population - Burma (%)
Place of birth for the foreign-born population - Cambodia (%)
Place of birth for the foreign-born population - Indonesia (%)
Place of birth for the foreign-born population - Laos (%)
Place of birth for the foreign-born population - Malaysia (%)
Place of birth for the foreign-born population - Philippines (%)
Place of birth for the foreign-born population - Singapore (%)
Place of birth for the foreign-born population - Thailand (%)
Place of birth for the foreign-born population - Vietnam (%)
Place of birth for the foreign-born population - Other South Eastern Asia (%)
Place of birth for the foreign-born population - Armenia (%)
Place of birth for the foreign-born population - Iraq (%)
Place of birth for the foreign-born population - Israel (%)
Place of birth for the foreign-born population - Jordan (%)
Place of birth for the foreign-born population - Kuwait (%)
Place of birth for the foreign-born population - Lebanon (%)
Place of birth for the foreign-born population - Saudi Arabia (%)
Place of birth for the foreign-born population - Syria (%)
Place of birth for the foreign-born population - Turkey (%)
Place of birth for the foreign-born population - Yemen (%)
Place of birth for the foreign-born population - Other Western Asia (%)
Place of birth for the foreign-born population - Eritrea (%)
Place of birth for the foreign-born population - Ethiopia (%)
Place of birth for the foreign-born population - Kenya (%)
Place of birth for the foreign-born population - Somalia (%)
Place of birth for the foreign-born population - Uganda (%)
Place of birth for the foreign-born population - Zimbabwe (%)
Place of birth for the foreign-born population - Other Eastern Africa (%)
Place of birth for the foreign-born population - Cameroon (%)
Place of birth for the foreign-born population - Congo (%)
Place of birth for the foreign-born population - Democratic Republic of Congo (Zaire) (%)
Place of birth for the foreign-born population - Other Middle Africa (%)
Place of birth for the foreign-born population - Egypt (%)
Place of birth for the foreign-born population - Morocco (%)
Place of birth for the foreign-born population - Sudan (%)
Place of birth for the foreign-born population - Other Northern Africa (%)
Place of birth for the foreign-born population - South Africa (%)
Place of birth for the foreign-born population - Other Southern Africa (%)
Place of birth for the foreign-born population - Cabo Verde (%)
Place of birth for the foreign-born population - Ghana (%)
Place of birth for the foreign-born population - Liberia (%)
Place of birth for the foreign-born population - Nigeria (%)
Place of birth for the foreign-born population - Senegal (%)
Place of birth for the foreign-born population - Sierra Leone (%)
Place of birth for the foreign-born population - Other Western Africa (%)
Place of birth for the foreign-born population - Australia (%)
Place of birth for the foreign-born population - New Zealand (%)
Place of birth for the foreign-born population - Fiji (%)
Place of birth for the foreign-born population - Micronesia (%)
Place of birth for the foreign-born population - Bahamas (%)
Place of birth for the foreign-born population - Barbados (%)
Place of birth for the foreign-born population - Cuba (%)
Place of birth for the foreign-born population - Dominica (%)
Place of birth for the foreign-born population - Dominican Republic (%)
Place of birth for the foreign-born population - Grenada (%)
Place of birth for the foreign-born population - Haiti (%)
Place of birth for the foreign-born population - Jamaica (%)
Place of birth for the foreign-born population - St. Vincent and the Grenadines (%)
Place of birth for the foreign-born population - Trinidad and Tobago (%)
Place of birth for the foreign-born population - West Indies (%)
Place of birth for the foreign-born population - Other Caribbean (%)
Place of birth for the foreign-born population - Belize (%)
Place of birth for the foreign-born population - Costa Rica (%)
Place of birth for the foreign-born population - El Salvador (%)
Place of birth for the foreign-born population - Guatemala (%)
Place of birth for the foreign-born population - Honduras (%)
Place of birth for the foreign-born population - Mexico (%)
Place of birth for the foreign-born population - Nicaragua (%)
Place of birth for the foreign-born population - Panama (%)
Place of birth for the foreign-born population - Other Central America (%)
Place of birth for the foreign-born population - Argentina (%)
Place of birth for the foreign-born population - Bolivia (%)
Place of birth for the foreign-born population - Brazil (%)
Place of birth for the foreign-born population - Chile (%)
Place of birth for the foreign-born population - Colombia (%)
Place of birth for the foreign-born population - Ecuador (%)
Place of birth for the foreign-born population - Guyana (%)
Place of birth for the foreign-born population - Peru (%)
Place of birth for the foreign-born population - Uruguay (%)
Place of birth for the foreign-born population - Venezuela (%)
Place of birth for the foreign-born population - Other South America (%)
Place of birth for the foreign-born population - Canada (%)
Place of birth for the foreign-born population - Other Northern America (%)
Place of birth for the foreign-born population - Other (%)
Latest news about races in Benicia, CA collected exclusively by city-data.com from local newspapers, TV, and radio stations
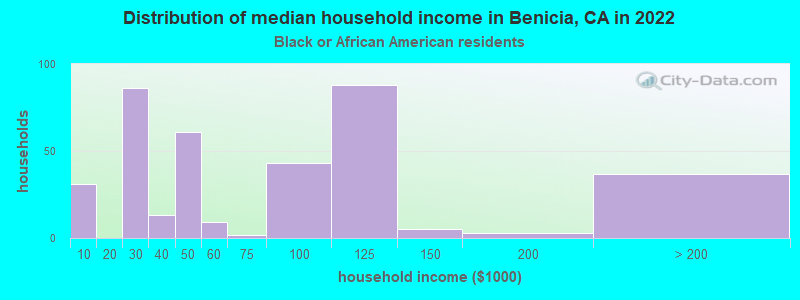
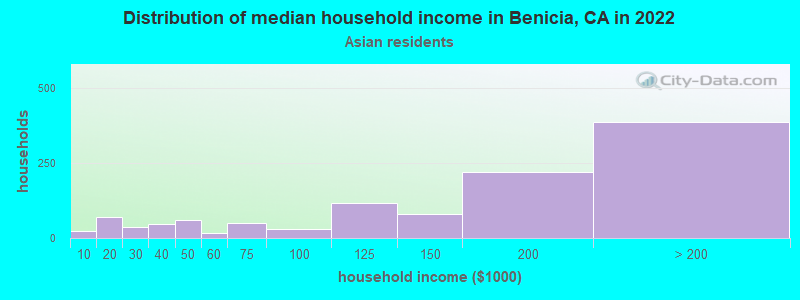
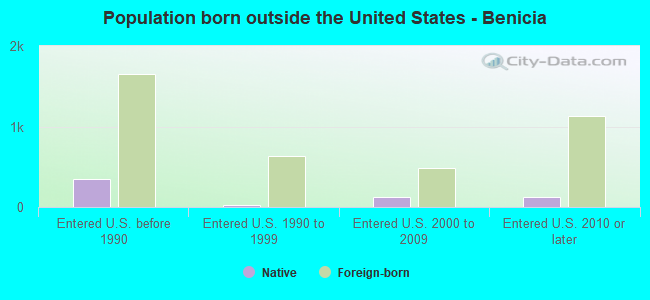
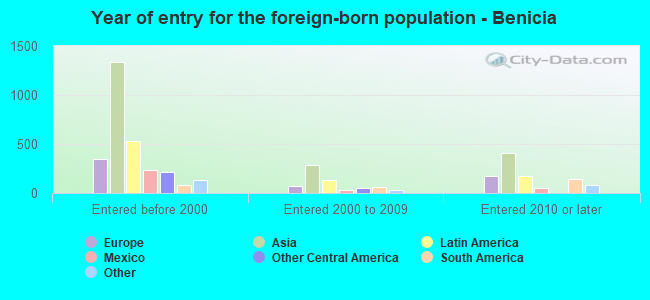
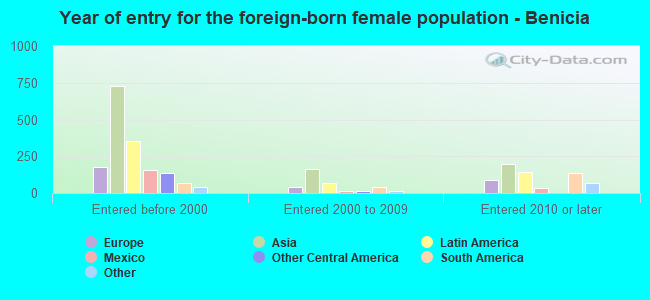
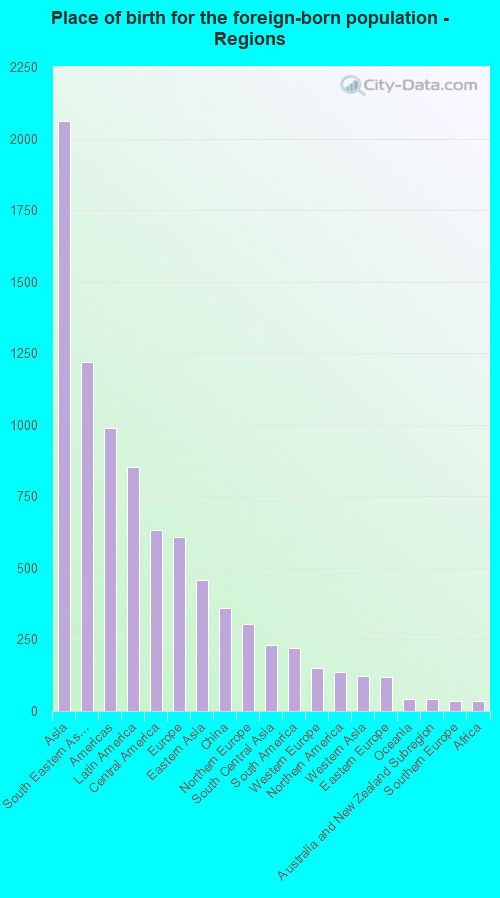
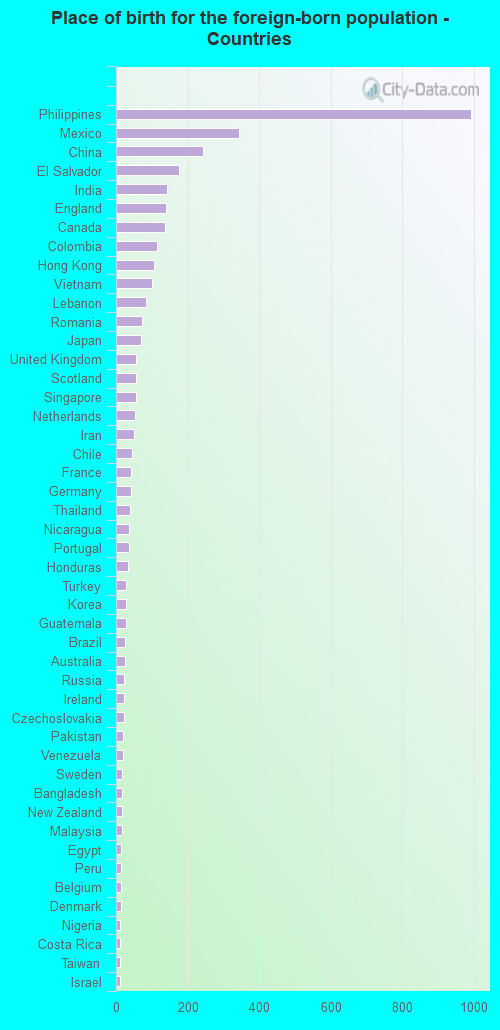
According to 2022 data, the most numerous races in Benicia, CA are Hispanic (3,846 residents), White alone (17,149 residents), and Asian alone (3,403 residents). 84.0% of Benicia residents speak English at home. 13.1% of Benicia, CA residents are foreign-born (7.2% born in Asia, 3.0% born in Latin America, 2.1% born in Europe), which is 99.0% less than the foreign-born rate of 26.0% across the entire state of California.
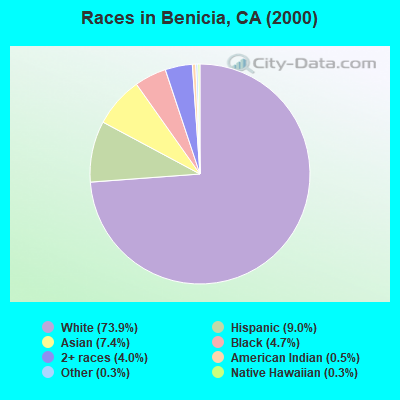
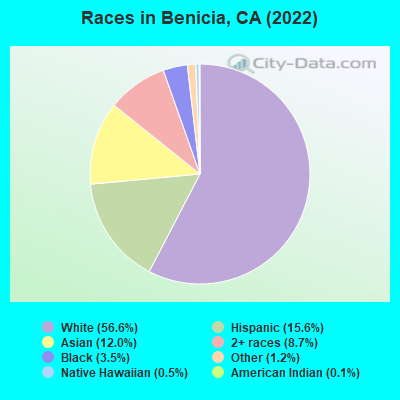
Race distribution in Benicia
2000 2022
15,816,790 46.7% White alone 10,966,556 32.4% Hispanic 3,648,860 10.8% Asian alone 2,181,926 6.4% Black alone 903,115 2.7% Two or more races 178,984 0.5% American Indian alone 103,736 0.3% Native Hawaiian and Other 71,681 0.2% Other race alone
15,732,184 40.3% Hispanic 13,160,426 33.7% White alone 5,957,867 15.3% Asian alone 2,025,218 5.2% Black alone 1,663,222 4.3% Two or more races 251,618 0.6% Other race alone 135,777 0.3% Native Hawaiian and Other 103,030 0.3% American Indian alone
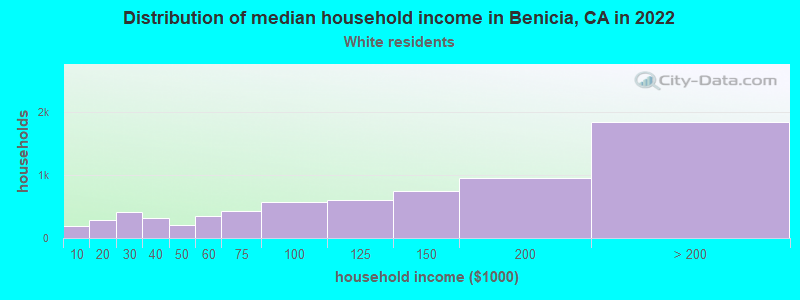
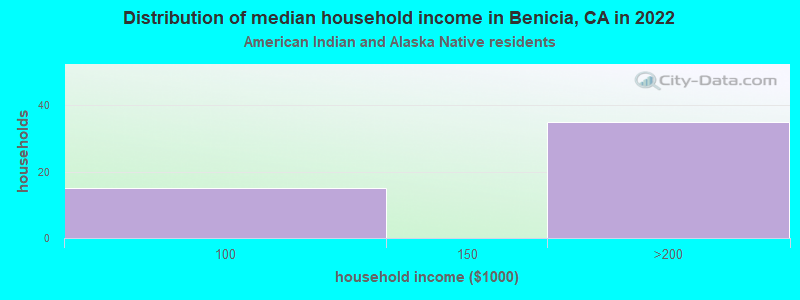
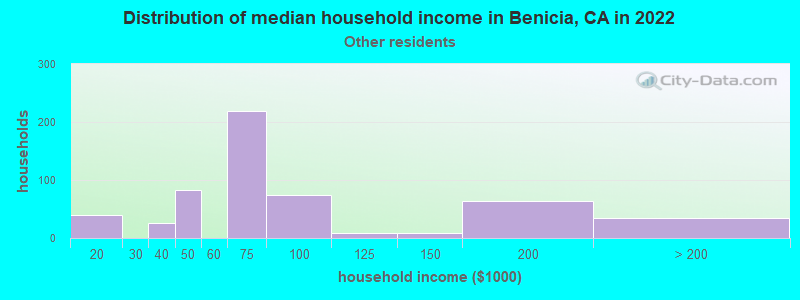
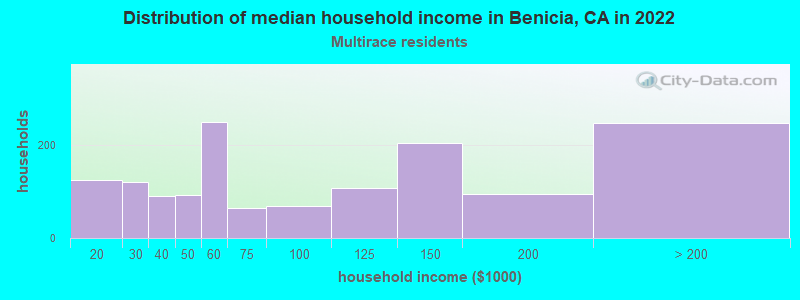
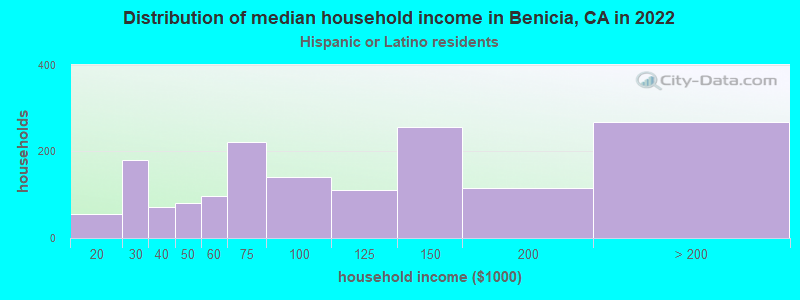
Income and house value in Benicia Median household income in 2022 $133,462 White non-Hispanic householders$63,545 Black householders$102,931 American Indian and Alaska Native householders$189,549 Asian householders$75,296 Native Hawaiian and other Pacific Islander householders$114,569 Some other race householders$147,613 Two or more races householders$127,410 Hispanic or Latino race householdersMedian 2022 house value $976,129 White Non-Hispanic householdersover $1,000,000 Black or African American householders$494,903 American Indian or Alaska Native householders over $1,000,000 Asian householdersover $1,000,000 Some other race householders$979,008 Two or more races householders$966,411 Hispanic or Latino householders
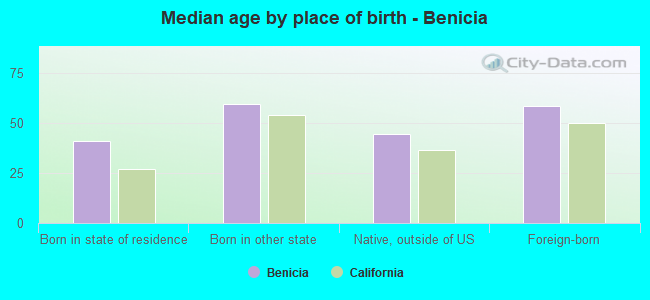
Median age by race in Benicia
52.2 Median age for White residents49.4 53.0 36.9 Median age for Black or African American residents43.4 32.7 61.5 Median age for American Indian / Alaska Native residents76.3 6.0 50.0 Median age for Asian residents47.6 51.4 63.1 Median age for Native Hawaiian / Pacific Islander residents42.8 Median age for Other race residents31.7 42.6 29.6 Median age for Two or more races residents29.6 31.1 51.7 Median age for White alone residents48.1 53.4 38.1 Median age for Hispanic or Latino residents34.3 38.1
Owner/renter occupied households by race in Benicia
House owners and renters - White residents 6,002 75.9% Owner occupied1,903 24.1% Renter occupiedHouse owners and renters - Black or African American residents 174 37.9% Owner occupied286 62.1% Renter occupiedHouse owners and renters - American Indian / Alaska Native residents 40 100.0% Owner occupiedHouse owners and renters - Asian residents 824 76.2% Owner occupied258 23.8% Renter occupiedHouse owners and renters - Native Hawaiian / Pacific Islander residents 16 100.0% Owner occupiedHouse owners and renters - Other race residents 194 58.1% Owner occupied140 41.9% Renter occupiedHouse owners and renters - Two or more races residents 1,490 76.1% Owner occupied468 23.9% Renter occupiedHouse owners and renters - White alone residents 5,851 75.0% Owner occupied1,949 25.0% Renter occupiedHouse owners and renters - Hispanic or Latino residents 798 67.4% Owner occupied386 32.6% Renter occupied
Language usage in Benicia
English speakers - Total 84.0% of residents of Benicia speak English at home.
5.2% of residents speak Spanish at home 1,097 77.7% Speak English very well314 22.3% Speak English less than very well11.4% of residents speak other language at home 2,222 71.7% Speak English very well879 28.3% Speak English less than very well
English speakers - Born in the United States 92.0% of residents of Benicia speak English at home.
3.2% of residents speak Spanish at home 191 95.5% Speak English very well9 4.5% Speak English less than very well4.8% of residents speak other language at home 292 97.3% Speak English very well8 2.7% Speak English less than very well
English speakers - Native, born elsewhere 79.2% of residents of Benicia speak English at home.
3.9% of residents speak Spanish at home 23 100.0% Speak English very well16.2% of residents speak other language at home 95 100.0% Speak English very well
English speakers - Foreign-born 29.2% of residents of Benicia speak English at home.
16.8% of residents speak Spanish at home 400 65.8% Speak English very well208 34.2% Speak English less than very well57.6% of residents speak other language at home 1,294 62.1% Speak English very well791 37.9% Speak English less than very well
White (Caucasian) - Speak only English Native:
98.7% (15,881)Foreign-born:
55.3% (511)
White (Caucasian) - Speak another language Native:
4.9% (796)Foreign-born:
54.3% (501)
Black or African American - Speak another language Native:
3.4% (30)Foreign-born:
93.9% (14)
American Indian / Alaska Native - Speak only English Native:
83.5% (50)Foreign-born:
89.9% (28)
Asian - Speak only English Native:
86.6% (1,411)Foreign-born:
18.4% (339)
Asian - Speak another language Native:
17.2% (281)Foreign-born:
82.9% (1,527)
Other race - Speak only English Native:
67.0% (321)Foreign-born:
34.4% (156)
Other race - Speak another language Native:
28.7% (138)Foreign-born:
74.7% (340)
Two or more races - Speak only English Native:
71.2% (3,700)Foreign-born:
17.7% (115)
Two or more races - Speak another language Native:
14.6% (758)Foreign-born:
73.4% (474)
White alone - Speak only English Native:
95.9% (14,808)Foreign-born:
48.3% (440)
White alone - Speak another language Native:
4.0% (617)Foreign-born:
51.3% (468)
Hispanic or Latino - Speak only English Native:
81.0% (2,436)Foreign-born:
37.1% (294)
Hispanic or Latino - Speak another language Native:
22.0% (661)Foreign-born:
73.4% (582)
Foreign-born residents in Benicia 3,739 residents are foreign born (7.2% Asia , 3.0% Latin America , 2.1% Europe ).
This city:
13.1%California:
100.0%
Marital status for residents in Benicia Marital status - White (Caucasian) population 15 years and over
Males 26.1% Never married61.2% Now married1.0% Separated3.4% Widowed8.3% DivorcedFemales 20.2% Never married55.2% Now married1.8% Separated7.4% Widowed15.4% DivorcedWomen who gave birth in the past 12 months Now married:
42.6% (74)Unmarried:
57.4% (99)
Women who did not give birth in the past 12 months Now married:
52.2% (1,598)Unmarried:
47.8% (1,463)
Marital status - Black or African American population 15 years and over
Males 44.5% Never married31.4% Now married4.2% Separated0.0% Widowed19.9% DivorcedFemales 40.5% Never married37.7% Now married12.1% Separated3.5% Widowed6.2% DivorcedWomen who did not give birth in the past 12 months Now married:
41.9% (62)Unmarried:
58.1% (87)
Marital status - American Indian / Alaska Native population 15 years and over
Males 0.0% Never married100.0% Now married0.0% Separated0.0% Widowed0.0% DivorcedFemales 0.0% Never married100.0% Now married0.0% Separated0.0% Widowed0.0% DivorcedMarital status - Asian population 15 years and over
Males 29.9% Never married54.3% Now married1.9% Separated4.2% Widowed9.7% DivorcedFemales 14.4% Never married65.0% Now married0.5% Separated9.5% Widowed10.6% DivorcedWomen who gave birth in the past 12 months Now married:
100.0% (18)Unmarried:
0.0% (0)
Women who did not give birth in the past 12 months Now married:
62.8% (442)Unmarried:
37.2% (263)
Marital status - Native Hawaiian / Pacific Islander population 15 years and over
Males 0.0% Never married45.7% Now married0.0% Separated54.3% Widowed0.0% DivorcedFemales 0.0% Never married100.0% Now married0.0% Separated0.0% Widowed0.0% DivorcedMarital status - Other race population 15 years and over
Males 37.8% Never married62.2% Now married0.0% Separated0.0% Widowed0.0% DivorcedFemales 29.0% Never married54.5% Now married2.9% Separated0.0% Widowed13.6% DivorcedWomen who did not give birth in the past 12 months Now married:
53.4% (163)Unmarried:
46.6% (143)
Marital status - Two or more races population 15 years and over
Males 46.2% Never married38.1% Now married1.0% Separated0.0% Widowed14.6% DivorcedFemales 49.1% Never married33.6% Now married1.0% Separated7.0% Widowed9.2% DivorcedWomen who gave birth in the past 12 months Now married:
100.0% (51)Unmarried:
0.0% (0)
Women who did not give birth in the past 12 months Now married:
19.5% (280)Unmarried:
80.5% (1,157)
Marital status - White alone, not Hispanic / Latino population 15 years and over
Males 24.5% Never married62.5% Now married1.0% Separated3.3% Widowed8.6% DivorcedFemales 19.2% Never married55.3% Now married2.1% Separated7.9% Widowed15.5% DivorcedWomen who gave birth in the past 12 months Now married:
47.2% (83)Unmarried:
52.8% (93)
Women who did not give birth in the past 12 months Now married:
52.1% (1,474)Unmarried:
47.9% (1,356)
Marital status - Hispanic or Latino population 15 years and over
Males 36.5% Never married55.7% Now married1.6% Separated2.9% Widowed3.3% DivorcedFemales 33.4% Never married52.1% Now married0.9% Separated1.7% Widowed11.9% DivorcedWomen who gave birth in the past 12 months Now married:
0.0% (0)Unmarried:
100.0% (22)
Women who did not give birth in the past 12 months Now married:
47.6% (551)Unmarried:
52.4% (606)
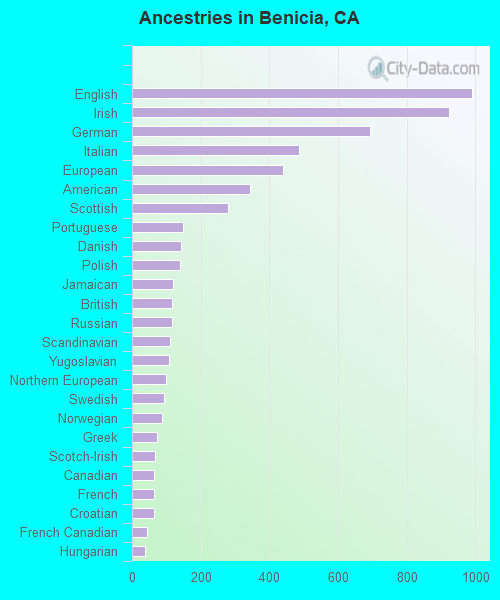
Ancestries in Benicia
769 6.2% European709 5.7% Irish599 4.8% English569 4.6% American561 4.5% Italian548 4.4% German211 1.7% Scottish206 1.7% Palestinian195 1.6% Polish190 1.5% Portuguese186 1.5% Northern European155 1.2% Norwegian127 1.0% Scandinavian104 0.8% Dutch104 0.8% Scotch-Irish96 0.8% Greek87 0.7% British85 0.7% Russian83 0.7% Romanian77 0.6% Iranian60 0.5% Danish54 0.4% Swedish50 0.4% Eastern European46 0.4% Canadian43 0.3% French42 0.3% Croatian41 0.3% French Canadian38 0.3% African34 0.3% Armenian34 0.3% Czech33 0.3% Yugoslavian32 0.3% Brazilian31 0.2% Macedonian26 0.2% Celtic26 0.2% Czechoslovakian26 0.2% Welsh25 0.2% Swiss20 0.2% Australian20 0.2% Lithuanian19 0.2% Hungarian18 0.1% Lebanese18 0.1% Finnish17 0.1% Egyptian16 0.1% Slavic13 0.1% Estonian11 0.09% Belgian9 0.07% Maltese8 0.06% Ukrainian5 0.04% Slovene
Geographical mobility in Benicia Same house 1 year ago 15,988 94.1% White (Caucasian)773 84.4% Black or African American89 100.0% American Indian / Alaska Native3,262 93.1% Asian53 76.4% Native Hawaiian / Pacific Islander828 78.0% Other race6,063 93.4% Two or more races15,552 90.7% White alone, not Hispanic / Latino3,168 86.4% Hispanic or LatinoMoved within same county 424 2.5% White / Caucasian26 2.8% Black or African American48 1.4% Asian84 7.9% Other race332 5.1% Two or more races600 3.5% White alone, not Hispanic / Latino196 5.3% Hispanic or LatinoMoved within same state 565 3.3% White / Caucasian134 14.6% Black or African American161 4.6% Asian97 9.1% Other race175 2.7% Two or more races679 4.0% White alone, not Hispanic / Latino281 7.7% Hispanic or LatinoMoved from different state 244 1.4% White / Caucasian26 0.7% Asian404 2.4% White alone, not Hispanic / Latino12 0.3% Hispanic or LatinoMoved from abroad 6 0.0% White60 1.7% Asian18 26.0% Native Hawaiian / Pacific Islander30 2.8% Other race29 0.4% Two or more races6 0.0% White alone, not Hispanic / Latino15 0.4% Hispanic or Latino
Children Nativity (place of birth) in Benicia
Children under 6 years - Living with two parents Both parents native 862 100.0% NativeBoth parents foreign-born 38 58.6% Native27 41.4% Foreign-bornOne native, one foreign-born parent 141 100.0% NativeChildren under 6 years - Living with one parent Native parent 220 100.0% NativeForeign-born parent 22 60.6% Native14 39.4% Foreign-bornChildren 6 to 17 years - Living with two parents Both parents native 1,484 99.3% Native10 0.7% Foreign-bornBoth parents foreign-born 166 85.2% Native29 14.8% Foreign-bornOne native, one foreign-born parent 932 100.0% NativeChildren 6 to 17 years - Living with one parent Native parent 1,140 100.0% NativeForeign-born parent 31 55.3% Native25 44.7% Foreign-born
Grandparents responsible for own grandchildren in Benicia
Grandparents (30 to 59 years) White / Caucasian 24 79.2% Responsible for grandchildren6 20.8% Not responsible for grandchildrenTwo or more races 25 100.0% Responsible for grandchildrenWhite alone, not Hispanic / Latino 18 64.3% Responsible for grandchildren10 35.7% Not responsible for grandchildrenHispanic or Latino 20 100.0% Responsible for grandchildrenGrandparents (60 years and over) White / Caucasian 38 13.5% Responsible for grandchildren240 86.5% Not responsible for grandchildrenTwo or more races 66 100.0% Not responsible for grandchildrenWhite alone, not Hispanic / Latino 46 12.4% Responsible for grandchildren325 87.6% Not responsible for grandchildrenHispanic or Latino 13 18.1% Responsible for grandchildren60 81.9% Not responsible for grandchildren