Races in Bensenville, Illinois (IL) Detailed Stats
Data:
Races - White alone (%)
Races - White alone (% change since 2000)
Races - Black alone (%)
Races - Black alone (% change since 2000)
Races - American Indian alone (%)
Races - American Indian alone (% change since 2000)
Races - Asian alone (%)
Races - Asian alone (% change since 2000)
Races - Hispanic (%)
Races - Hispanic (% change since 2000)
Races - Native Hawaiian and Other Pacific Islander alone (%)
Races - Native Hawaiian and Other Pacific Islander alone (% change since 2000)
Races - Two or more races(%)
Races - Two or more races(% change since 2000)
Races - Other race alone (%)
Races - Other race alone (% change since 2000)
Racial diversity
Place of birth - Born in state of residence (%)
Place of birth - Born in state of residence (%) - White
Place of birth - Born in state of residence (%) - Black or African American
Place of birth - Born in state of residence (%) - Asian
Place of birth - Born in state of residence (%) - Hispanic or Latino
Place of birth - Born in state of residence (%) - American Indian and Alaska Native
Place of birth - Born in state of residence (%) - Multirace
Place of birth - Born in state of residence (%) - Other Race
Place of birth - Born in other state (%)
Place of birth - Born in other state (%) - White
Place of birth - Born in other state (%) - Black or African American
Place of birth - Born in other state (%) - Asian
Place of birth - Born in other state (%) - Hispanic or Latino
Place of birth - Born in other state (%) - American Indian and Alaska Native
Place of birth - Born in other state (%) - Multirace
Place of birth - Born in other state (%) - Other Race
Place of birth - Native, outside of US (%)
Place of birth - Native, outside of US (%) - White
Place of birth - Native, outside of US (%) - Black or African American
Place of birth - Native, outside of US (%) - Asian
Place of birth - Native, outside of US (%) - Hispanic or Latino
Place of birth - Native, outside of US (%) - American Indian and Alaska Native
Place of birth - Native, outside of US (%) - Multirace
Place of birth - Native, outside of US (%) - Other Race
Place of birth - Foreign born (%)
Place of birth - Foreign born (%) - White
Place of birth - Foreign born (%) - Black or African American
Place of birth - Foreign born (%) - Asian
Place of birth - Foreign born (%) - Hispanic or Latino
Place of birth - Foreign born (%) - American Indian and Alaska Native
Place of birth - Foreign born (%) - Multirace
Place of birth - Foreign born (%) - Other Race
Residents speaking English at home (%)
Residents speaking English at home - Born in the United States (%)
Residents speaking English at home - Native, born elsewhere (%)
Residents speaking English at home - Foreign born (%)
Residents speaking Spanish at home (%)
Residents speaking Spanish at home - Born in the United States (%)
Residents speaking Spanish at home - Native, born elsewhere (%)
Residents speaking Spanish at home - Foreign born (%)
Residents speaking other language at home (%)
Residents speaking other language at home - Born in the United States (%)
Residents speaking other language at home - Native, born elsewhere (%)
Residents speaking other language at home - Foreign born (%)
Marital status - Never married (%)
Marital status - Now married (%)
Marital status - Separated (%)
Marital status - Widowed (%)
Marital status - Divorced (%)
Ancestries Reported - Arab (%)
Ancestries Reported - Czech (%)
Ancestries Reported - Danish (%)
Ancestries Reported - Dutch (%)
Ancestries Reported - English (%)
Ancestries Reported - French (%)
Ancestries Reported - French Canadian (%)
Ancestries Reported - German (%)
Ancestries Reported - Greek (%)
Ancestries Reported - Hungarian (%)
Ancestries Reported - Irish (%)
Ancestries Reported - Italian (%)
Ancestries Reported - Lithuanian (%)
Ancestries Reported - Norwegian (%)
Ancestries Reported - Polish (%)
Ancestries Reported - Portuguese (%)
Ancestries Reported - Russian (%)
Ancestries Reported - Scotch-Irish (%)
Ancestries Reported - Scottish (%)
Ancestries Reported - Slovak (%)
Ancestries Reported - Subsaharan African (%)
Ancestries Reported - Swedish (%)
Ancestries Reported - Swiss (%)
Ancestries Reported - Ukrainian (%)
Ancestries Reported - United States (%)
Ancestries Reported - Welsh (%)
Ancestries Reported - West Indian (%)
Ancestries Reported - Other (%)
Geographical mobility - Same house 1 year ago (%)
Geographical mobility - Same house 1 year ago (%) - White
Geographical mobility - Same house 1 year ago (%) - Black or African American
Geographical mobility - Same house 1 year ago (%) - Asian
Geographical mobility - Same house 1 year ago (%) - Hispanic or Latino
Geographical mobility - Same house 1 year ago (%) - American Indian and Alaska Native
Geographical mobility - Same house 1 year ago (%) - Multirace
Geographical mobility - Same house 1 year ago (%) - Other Race
Geographical mobility - Moved within same county (%)
Geographical mobility - Moved within same county (%) - White
Geographical mobility - Moved within same county (%) - Black or African American
Geographical mobility - Moved within same county (%) - Asian
Geographical mobility - Moved within same county (%) - Hispanic or Latino
Geographical mobility - Moved within same county (%) - American Indian and Alaska Native
Geographical mobility - Moved within same county (%) - Multirace
Geographical mobility - Moved within same county (%) - Other Race
Geographical mobility - Moved from different county within same state (%)
Geographical mobility - Moved from different county within same state (%) - White
Geographical mobility - Moved from different county within same state (%) - Black or African American
Geographical mobility - Moved from different county within same state (%) - Asian
Geographical mobility - Moved from different county within same state (%) - Hispanic or Latino
Geographical mobility - Moved from different county within same state (%) - American Indian and Alaska Native
Geographical mobility - Moved from different county within same state (%) - Multirace
Geographical mobility - Moved from different county within same state (%) - Other Race
Geographical mobility - Moved from different state (%)
Geographical mobility - Moved from different state (%) - White
Geographical mobility - Moved from different state (%) - Black or African American
Geographical mobility - Moved from different state (%) - Asian
Geographical mobility - Moved from different state (%) - Hispanic or Latino
Geographical mobility - Moved from different state (%) - American Indian and Alaska Native
Geographical mobility - Moved from different state (%) - Multirace
Geographical mobility - Moved from different state (%) - Other Race
Geographical mobility - Moved from abroad (%)
Geographical mobility - Moved from abroad (%) - White
Geographical mobility - Moved from abroad (%) - Black or African American
Geographical mobility - Moved from abroad (%) - Asian
Geographical mobility - Moved from abroad (%) - Hispanic or Latino
Geographical mobility - Moved from abroad (%) - American Indian and Alaska Native
Geographical mobility - Moved from abroad (%) - Multirace
Geographical mobility - Moved from abroad (%) - Other Race
Place of birth for the foreign-born population - Ireland (%)
Place of birth for the foreign-born population - Denmark (%)
Place of birth for the foreign-born population - Norway (%)
Place of birth for the foreign-born population - Sweden (%)
Place of birth for the foreign-born population - United Kingdom (%)
Place of birth for the foreign-born population - England (%)
Place of birth for the foreign-born population - Scotland (%)
Place of birth for the foreign-born population - Other Northern Europe (%)
Place of birth for the foreign-born population - Austria (%)
Place of birth for the foreign-born population - Belgium (%)
Place of birth for the foreign-born population - France (%)
Place of birth for the foreign-born population - Germany (%)
Place of birth for the foreign-born population - Netherlands (%)
Place of birth for the foreign-born population - Switzerland (%)
Place of birth for the foreign-born population - Other Western Europe (%)
Place of birth for the foreign-born population - Greece (%)
Place of birth for the foreign-born population - Italy (%)
Place of birth for the foreign-born population - Portugal (%)
Place of birth for the foreign-born population - Spain (%)
Place of birth for the foreign-born population - Other Southern Europe (%)
Place of birth for the foreign-born population - Albania (%)
Place of birth for the foreign-born population - Belarus (%)
Place of birth for the foreign-born population - Bosnia and Herzegovina (%)
Place of birth for the foreign-born population - Bulgaria (%)
Place of birth for the foreign-born population - Croatia (%)
Place of birth for the foreign-born population - Czechoslovakia (%)
Place of birth for the foreign-born population - Hungary (%)
Place of birth for the foreign-born population - Latvia (%)
Place of birth for the foreign-born population - Lithuania (%)
Place of birth for the foreign-born population - North Macedonia (Macedonia) (%)
Place of birth for the foreign-born population - Moldova (%)
Place of birth for the foreign-born population - Poland (%)
Place of birth for the foreign-born population - Romania (%)
Place of birth for the foreign-born population - Russia (%)
Place of birth for the foreign-born population - Serbia (%)
Place of birth for the foreign-born population - Ukraine (%)
Place of birth for the foreign-born population - Other Eastern Europe (%)
Place of birth for the foreign-born population - China (%)
Place of birth for the foreign-born population - Hong Kong (%)
Place of birth for the foreign-born population - Taiwan (%)
Place of birth for the foreign-born population - Japan (%)
Place of birth for the foreign-born population - Korea (%)
Place of birth for the foreign-born population - Other Eastern Asia (%)
Place of birth for the foreign-born population - Afghanistan (%)
Place of birth for the foreign-born population - Bangladesh (%)
Place of birth for the foreign-born population - India (%)
Place of birth for the foreign-born population - Iran (%)
Place of birth for the foreign-born population - Kazakhstan (%)
Place of birth for the foreign-born population - Nepal (%)
Place of birth for the foreign-born population - Pakistan (%)
Place of birth for the foreign-born population - Sri Lanka (%)
Place of birth for the foreign-born population - Uzbekistan (%)
Place of birth for the foreign-born population - Other South Central Asia (%)
Place of birth for the foreign-born population - Burma (%)
Place of birth for the foreign-born population - Cambodia (%)
Place of birth for the foreign-born population - Indonesia (%)
Place of birth for the foreign-born population - Laos (%)
Place of birth for the foreign-born population - Malaysia (%)
Place of birth for the foreign-born population - Philippines (%)
Place of birth for the foreign-born population - Singapore (%)
Place of birth for the foreign-born population - Thailand (%)
Place of birth for the foreign-born population - Vietnam (%)
Place of birth for the foreign-born population - Other South Eastern Asia (%)
Place of birth for the foreign-born population - Armenia (%)
Place of birth for the foreign-born population - Iraq (%)
Place of birth for the foreign-born population - Israel (%)
Place of birth for the foreign-born population - Jordan (%)
Place of birth for the foreign-born population - Kuwait (%)
Place of birth for the foreign-born population - Lebanon (%)
Place of birth for the foreign-born population - Saudi Arabia (%)
Place of birth for the foreign-born population - Syria (%)
Place of birth for the foreign-born population - Turkey (%)
Place of birth for the foreign-born population - Yemen (%)
Place of birth for the foreign-born population - Other Western Asia (%)
Place of birth for the foreign-born population - Eritrea (%)
Place of birth for the foreign-born population - Ethiopia (%)
Place of birth for the foreign-born population - Kenya (%)
Place of birth for the foreign-born population - Somalia (%)
Place of birth for the foreign-born population - Uganda (%)
Place of birth for the foreign-born population - Zimbabwe (%)
Place of birth for the foreign-born population - Other Eastern Africa (%)
Place of birth for the foreign-born population - Cameroon (%)
Place of birth for the foreign-born population - Congo (%)
Place of birth for the foreign-born population - Democratic Republic of Congo (Zaire) (%)
Place of birth for the foreign-born population - Other Middle Africa (%)
Place of birth for the foreign-born population - Egypt (%)
Place of birth for the foreign-born population - Morocco (%)
Place of birth for the foreign-born population - Sudan (%)
Place of birth for the foreign-born population - Other Northern Africa (%)
Place of birth for the foreign-born population - South Africa (%)
Place of birth for the foreign-born population - Other Southern Africa (%)
Place of birth for the foreign-born population - Cabo Verde (%)
Place of birth for the foreign-born population - Ghana (%)
Place of birth for the foreign-born population - Liberia (%)
Place of birth for the foreign-born population - Nigeria (%)
Place of birth for the foreign-born population - Senegal (%)
Place of birth for the foreign-born population - Sierra Leone (%)
Place of birth for the foreign-born population - Other Western Africa (%)
Place of birth for the foreign-born population - Australia (%)
Place of birth for the foreign-born population - New Zealand (%)
Place of birth for the foreign-born population - Fiji (%)
Place of birth for the foreign-born population - Micronesia (%)
Place of birth for the foreign-born population - Bahamas (%)
Place of birth for the foreign-born population - Barbados (%)
Place of birth for the foreign-born population - Cuba (%)
Place of birth for the foreign-born population - Dominica (%)
Place of birth for the foreign-born population - Dominican Republic (%)
Place of birth for the foreign-born population - Grenada (%)
Place of birth for the foreign-born population - Haiti (%)
Place of birth for the foreign-born population - Jamaica (%)
Place of birth for the foreign-born population - St. Vincent and the Grenadines (%)
Place of birth for the foreign-born population - Trinidad and Tobago (%)
Place of birth for the foreign-born population - West Indies (%)
Place of birth for the foreign-born population - Other Caribbean (%)
Place of birth for the foreign-born population - Belize (%)
Place of birth for the foreign-born population - Costa Rica (%)
Place of birth for the foreign-born population - El Salvador (%)
Place of birth for the foreign-born population - Guatemala (%)
Place of birth for the foreign-born population - Honduras (%)
Place of birth for the foreign-born population - Mexico (%)
Place of birth for the foreign-born population - Nicaragua (%)
Place of birth for the foreign-born population - Panama (%)
Place of birth for the foreign-born population - Other Central America (%)
Place of birth for the foreign-born population - Argentina (%)
Place of birth for the foreign-born population - Bolivia (%)
Place of birth for the foreign-born population - Brazil (%)
Place of birth for the foreign-born population - Chile (%)
Place of birth for the foreign-born population - Colombia (%)
Place of birth for the foreign-born population - Ecuador (%)
Place of birth for the foreign-born population - Guyana (%)
Place of birth for the foreign-born population - Peru (%)
Place of birth for the foreign-born population - Uruguay (%)
Place of birth for the foreign-born population - Venezuela (%)
Place of birth for the foreign-born population - Other South America (%)
Place of birth for the foreign-born population - Canada (%)
Place of birth for the foreign-born population - Other Northern America (%)
Place of birth for the foreign-born population - Other (%)
Latest news about races in Bensenville, IL collected exclusively by city-data.com from local newspapers, TV, and radio stations
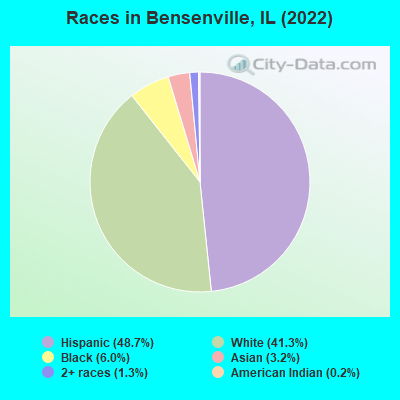
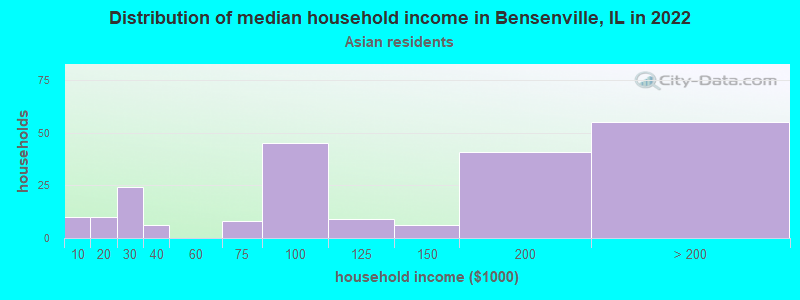
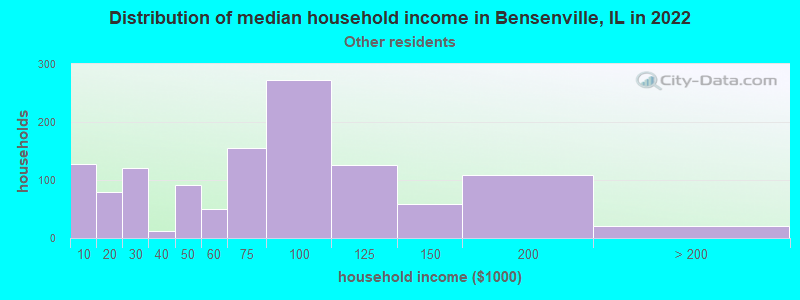
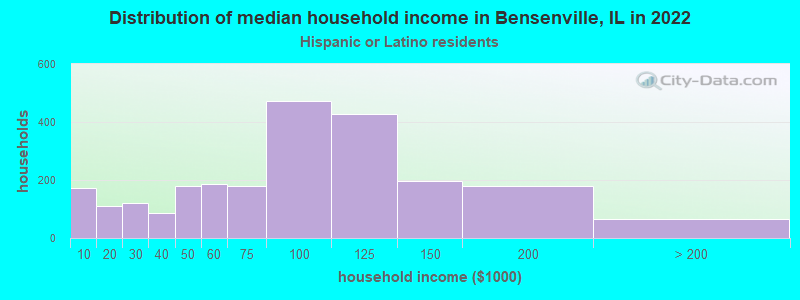
According to 2022 data, the most numerous races in Bensenville, IL are White alone (7,636 residents), Hispanic (8,995 residents), and Black alone (1,111 residents). 50.0% of Bensenville residents speak English at home. 29.3% of Bensenville, IL residents are foreign-born (17.5% born in Latin America, 8.5% born in Europe), which is 52.2% greater than the foreign-born rate of 14.0% across the entire state of Illinois.
Race distribution in Bensenville
2000 2022
8,424,140 67.8% White alone 1,856,152 14.9% Black alone 1,530,262 12.3% Hispanic 419,916 3.4% Asian alone 153,996 1.2% Two or more races 13,479 0.1% Other race alone 18,232 0.1% American Indian alone 3,116 0.03% Native Hawaiian and Other
7,356,301 58.5% White alone 2,299,726 18.3% Hispanic 1,660,423 13.2% Black alone 747,296 5.9% Asian alone 458,599 3.6% Two or more races 45,386 0.4% Other race alone 10,405 0.08% American Indian alone 3,896 0.03% Native Hawaiian and Other
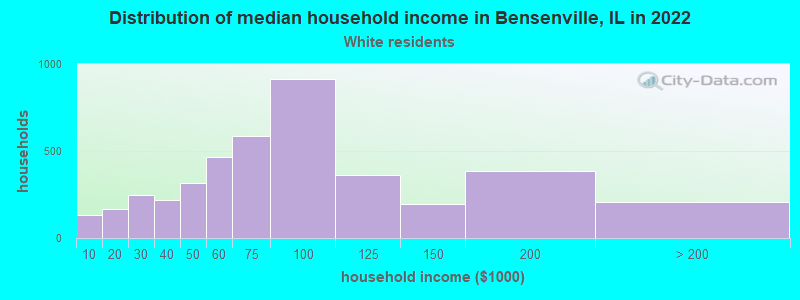
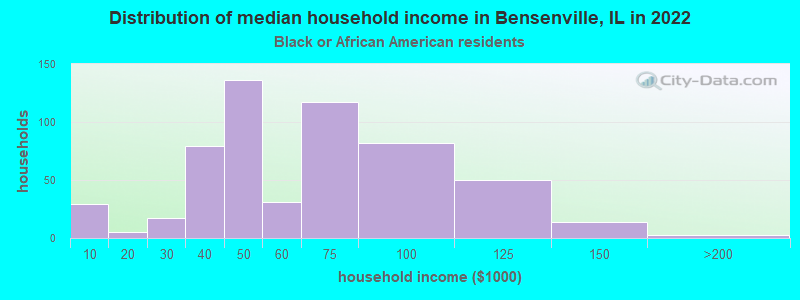
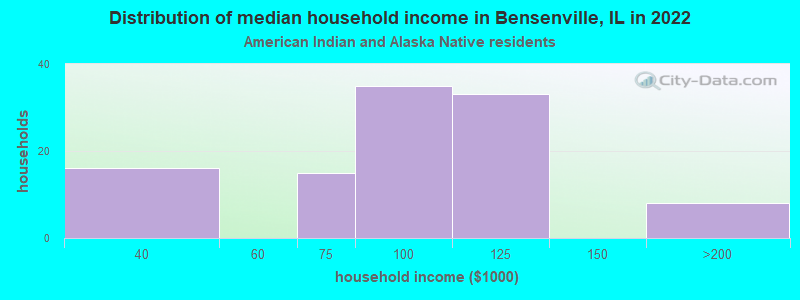
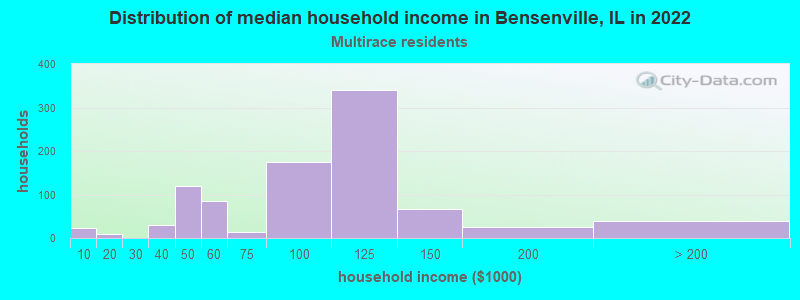
Income and house value in Bensenville Median household income in 2022 $71,116 White non-Hispanic householders$53,694 Black householders$68,429 American Indian and Alaska Native householders$85,742 Asian householders$73,610 Some other race householders$106,658 Two or more races householders$77,549 Hispanic or Latino race householdersMedian 2022 house value $268,759 White Non-Hispanic householders$194,694 Black or African American householders$274,158 American Indian or Alaska Native householders $207,348 Asian householders$257,624 Some other race householders$227,762 Two or more races householders$255,600 Hispanic or Latino householders
Median age by race in Bensenville
43.6 Median age for White residents42.5 44.1 32.6 Median age for Black or African American residents33.5 35.2 23.1 Median age for American Indian / Alaska Native residents38.1 16.3 38.8 Median age for Asian residents35.3 47.4 21.8 Median age for Native Hawaiian / Pacific Islander residents24.2 -576,015,108.0 32.9 Median age for Other race residents31.9 35.3 39.1 Median age for Two or more races residents41.3 34.6 51.8 Median age for White alone residents52.4 51.4 28.5 Median age for Hispanic or Latino residents29.8 27.2
Owner/renter occupied households by race in Bensenville
House owners and renters - White residents 2,556 63.6% Owner occupied1,466 36.4% Renter occupiedHouse owners and renters - Black or African American residents 67 11.9% Owner occupied500 88.1% Renter occupiedHouse owners and renters - American Indian / Alaska Native residents 34 57.4% Owner occupied25 42.6% Renter occupiedHouse owners and renters - Asian residents 101 45.6% Owner occupied120 54.4% Renter occupiedHouse owners and renters - Native Hawaiian / Pacific Islander residents 8 32.3% Owner occupied17 67.7% Renter occupiedHouse owners and renters - Other race residents 480 39.0% Owner occupied753 61.0% Renter occupiedHouse owners and renters - Two or more races residents 707 69.9% Owner occupied304 30.1% Renter occupiedHouse owners and renters - White alone residents 2,204 62.2% Owner occupied1,338 37.8% Renter occupiedHouse owners and renters - Hispanic or Latino residents 1,283 53.7% Owner occupied1,108 46.3% Renter occupied
Language usage in Bensenville
English speakers - Total 50.0% of residents of Bensenville speak English at home.
37.7% of residents speak Spanish at home 3,286 50.0% Speak English very well3,284 50.0% Speak English less than very well14.5% of residents speak other language at home 1,489 59.1% Speak English very well1,031 40.9% Speak English less than very well
English speakers - Born in the United States 81.8% of residents of Bensenville speak English at home.
9.8% of residents speak Spanish at home 117 87.3% Speak English very well17 12.7% Speak English less than very well6.7% of residents speak other language at home 92 100.0% Speak English very well
English speakers - Native, born elsewhere 14.7% of residents of Bensenville speak English at home.
95.9% of residents speak Spanish at home 85 40.9% Speak English very well123 59.1% Speak English less than very well
English speakers - Foreign-born 9.1% of residents of Bensenville speak English at home.
58.8% of residents speak Spanish at home 585 18.6% Speak English very well2,563 81.4% Speak English less than very well36.6% of residents speak other language at home 976 49.8% Speak English very well984 50.2% Speak English less than very well
White (Caucasian) - Speak only English Native:
79.8% (5,759)Foreign-born:
10.4% (206)
White (Caucasian) - Speak another language Native:
16.3% (1,173)Foreign-born:
88.5% (1,749)
Black or African American - Speak only English Native:
97.2% (1,118)Foreign-born:
100.0% (17)
American Indian / Alaska Native - Speak another language Native:
93.0% (187)Foreign-born:
100.0% (71)
Asian - Speak only English Native:
71.5% (125)Foreign-born:
3.3% (13)
Asian - Speak another language Native:
31.2% (54)Foreign-born:
97.7% (398)
Other race - Speak only English Native:
13.5% (288)Foreign-born:
8.5% (219)
Other race - Speak another language Native:
82.0% (1,754)Foreign-born:
90.9% (2,335)
Two or more races - Speak only English Native:
59.2% (1,132)Foreign-born:
8.2% (76)
Two or more races - Speak another language Native:
41.9% (801)Foreign-born:
92.3% (850)
White alone - Speak only English Native:
91.2% (5,204)Foreign-born:
9.7% (163)
White alone - Speak another language Native:
8.4% (482)Foreign-born:
89.9% (1,508)
Hispanic or Latino - Speak only English Native:
32.5% (1,637)Foreign-born:
7.9% (260)
Hispanic or Latino - Speak another language Native:
67.9% (3,412)Foreign-born:
92.0% (3,040)
Foreign-born residents in Bensenville 5,412 residents are foreign born (17.5% Latin America , 8.5% Europe ).
This city:
29.3%Illinois:
14.1%
Marital status for residents in Bensenville Marital status - White (Caucasian) population 15 years and over
Males 38.1% Never married42.7% Now married0.7% Separated4.9% Widowed13.6% DivorcedFemales 31.0% Never married40.0% Now married2.0% Separated12.3% Widowed14.6% DivorcedWomen who gave birth in the past 12 months Now married:
72.3% (95)Unmarried:
27.7% (36)
Women who did not give birth in the past 12 months Now married:
34.6% (678)Unmarried:
65.4% (1,282)
Marital status - Black or African American population 15 years and over
Males 35.7% Never married32.9% Now married0.0% Separated0.0% Widowed31.4% DivorcedFemales 28.5% Never married23.9% Now married20.4% Separated5.2% Widowed22.0% DivorcedWomen who did not give birth in the past 12 months Now married:
39.5% (76)Unmarried:
60.5% (117)
Marital status - American Indian / Alaska Native population 15 years and over
Males 46.1% Never married47.4% Now married0.0% Separated0.0% Widowed6.6% DivorcedFemales 49.6% Never married41.9% Now married0.9% Separated6.0% Widowed1.7% DivorcedWomen who gave birth in the past 12 months Now married:
100.0% (32)Unmarried:
0.0% (0)
Women who did not give birth in the past 12 months Now married:
34.8% (52)Unmarried:
65.2% (97)
Marital status - Asian population 15 years and over
Males 48.3% Never married46.8% Now married0.0% Separated0.0% Widowed4.9% DivorcedFemales 19.3% Never married72.5% Now married3.4% Separated0.0% Widowed4.7% DivorcedWomen who gave birth in the past 12 months Now married:
100.0% (12)Unmarried:
0.0% (0)
Women who did not give birth in the past 12 months Now married:
61.5% (72)Unmarried:
38.5% (45)
Marital status - Native Hawaiian / Pacific Islander population 15 years and over
Males 56.5% Never married43.5% Now married0.0% Separated0.0% Widowed0.0% DivorcedFemales 0.0% Never married100.0% Now married0.0% Separated0.0% Widowed0.0% DivorcedWomen who did not give birth in the past 12 months Now married:
100.0% (14)Unmarried:
0.0% (0)
Marital status - Other race population 15 years and over
Males 37.8% Never married56.2% Now married1.0% Separated0.0% Widowed5.0% DivorcedFemales 30.5% Never married57.5% Now married6.2% Separated1.6% Widowed4.2% DivorcedWomen who gave birth in the past 12 months Now married:
36.7% (31)Unmarried:
63.3% (53)
Women who did not give birth in the past 12 months Now married:
57.2% (639)Unmarried:
42.8% (477)
Marital status - Two or more races population 15 years and over
Males 41.2% Never married50.0% Now married6.6% Separated0.0% Widowed2.2% DivorcedFemales 31.0% Never married61.3% Now married0.0% Separated1.1% Widowed6.7% DivorcedWomen who gave birth in the past 12 months Now married:
100.0% (11)Unmarried:
0.0% (0)
Women who did not give birth in the past 12 months Now married:
60.3% (370)Unmarried:
39.7% (244)
Marital status - White alone, not Hispanic / Latino population 15 years and over
Males 33.5% Never married43.1% Now married1.0% Separated6.4% Widowed16.1% DivorcedFemales 27.9% Never married41.0% Now married0.7% Separated13.9% Widowed16.5% DivorcedWomen who gave birth in the past 12 months Now married:
77.3% (80)Unmarried:
22.7% (24)
Women who did not give birth in the past 12 months Now married:
32.9% (482)Unmarried:
67.1% (982)
Marital status - Hispanic or Latino population 15 years and over
Males 44.1% Never married49.1% Now married2.2% Separated0.0% Widowed4.6% DivorcedFemales 35.8% Never married50.9% Now married5.2% Separated2.6% Widowed5.6% DivorcedWomen who gave birth in the past 12 months Now married:
56.8% (74)Unmarried:
43.2% (56)
Women who did not give birth in the past 12 months Now married:
50.8% (1,019)Unmarried:
49.2% (985)
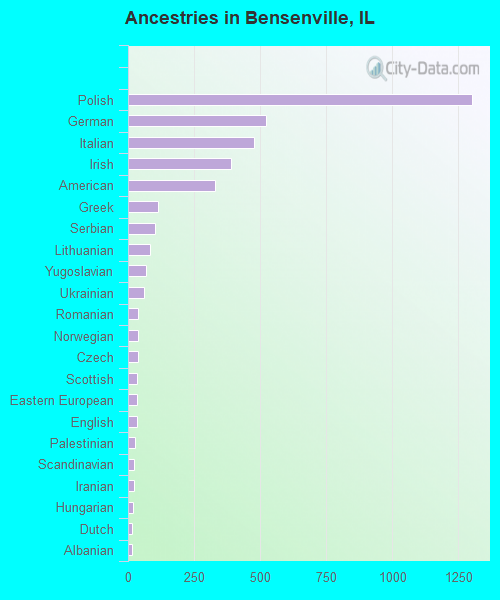
Ancestries in Bensenville
1,301 11.6% Polish522 4.7% German478 4.3% Italian391 3.5% Irish331 2.9% American112 1.0% Greek103 0.9% Serbian85 0.8% Lithuanian68 0.6% Yugoslavian61 0.5% Ukrainian39 0.3% Romanian37 0.3% Norwegian36 0.3% Czech35 0.3% Scottish33 0.3% Eastern European33 0.3% English26 0.2% Palestinian24 0.2% Scandinavian23 0.2% Iranian18 0.2% Hungarian17 0.2% Dutch14 0.1% Albanian11 0.10% Assyrian9 0.08% Bulgarian7 0.06% Australian6 0.05% Finnish6 0.05% Swedish5 0.04% Pennsylvania German4 0.04% Austrian3 0.03% Canadian3 0.03% Russian
Geographical mobility in Bensenville Same house 1 year ago 8,728 89.9% White (Caucasian)1,027 84.4% Black or African American330 83.6% American Indian / Alaska Native528 88.7% Asian55 100.0% Native Hawaiian / Pacific Islander4,448 90.4% Other race2,758 90.8% Two or more races6,710 88.8% White alone, not Hispanic / Latino8,074 90.8% Hispanic or LatinoMoved within same county 318 3.3% White / Caucasian14 1.2% Black or African American41 6.8% Asian21 0.4% Other race197 6.5% Two or more races298 3.9% White alone, not Hispanic / Latino153 1.7% Hispanic or LatinoMoved within same state 576 5.9% White / Caucasian52 4.3% Black or African American70 17.7% American Indian / Alaska Native27 4.5% Asian268 5.5% Other race27 0.9% Two or more races479 6.3% White alone, not Hispanic / Latino470 5.3% Hispanic or LatinoMoved from different state 60 0.6% White / Caucasian61 5.0% Black or African American62 0.8% White alone, not Hispanic / LatinoMoved from abroad 69 0.7% White141 2.9% Other race24 0.3% White alone, not Hispanic / Latino191 2.1% Hispanic or Latino
Children Nativity (place of birth) in Bensenville
Children under 6 years - Living with two parents Both parents native 407 99.6% Native1 0.4% Foreign-bornBoth parents foreign-born 151 86.5% Native23 13.5% Foreign-bornOne native, one foreign-born parent 134 100.0% NativeChildren under 6 years - Living with one parent Native parent 252 100.0% NativeForeign-born parent 186 93.9% Native12 6.1% Foreign-bornChildren 6 to 17 years - Living with two parents Both parents native 711 100.0% NativeBoth parents foreign-born 695 86.0% Native113 14.0% Foreign-bornOne native, one foreign-born parent 410 95.0% Native21 5.0% Foreign-bornChildren 6 to 17 years - Living with one parent Native parent 505 100.0% NativeForeign-born parent 354 54.5% Native296 45.5% Foreign-born
Grandparents responsible for own grandchildren in Bensenville
Grandparents (30 to 59 years) White / Caucasian 30 100.0% Not responsible for grandchildrenBlack or African American 92 100.0% Responsible for grandchildrenAmerican Indian / Alaska Native 1 86.6% Not responsible for grandchildrenOther race 77 100.0% Not responsible for grandchildrenTwo or more races 66 100.0% Not responsible for grandchildrenWhite alone, not Hispanic / Latino 13 100.0% Not responsible for grandchildrenHispanic or Latino 190 100.0% Not responsible for grandchildrenGrandparents (60 years and over) White / Caucasian 10 4.7% Responsible for grandchildren206 95.3% Not responsible for grandchildrenBlack or African American 14 53.6% Responsible for grandchildren12 46.4% Not responsible for grandchildrenOther race 80 100.0% Not responsible for grandchildrenWhite alone, not Hispanic / Latino 11 5.7% Responsible for grandchildren184 94.3% Not responsible for grandchildrenHispanic or Latino 227 100.0% Not responsible for grandchildren