Races in Berea, Ohio (OH) Detailed Stats
Data:
Races - White alone (%)
Races - White alone (% change since 2000)
Races - Black alone (%)
Races - Black alone (% change since 2000)
Races - American Indian alone (%)
Races - American Indian alone (% change since 2000)
Races - Asian alone (%)
Races - Asian alone (% change since 2000)
Races - Hispanic (%)
Races - Hispanic (% change since 2000)
Races - Native Hawaiian and Other Pacific Islander alone (%)
Races - Native Hawaiian and Other Pacific Islander alone (% change since 2000)
Races - Two or more races(%)
Races - Two or more races(% change since 2000)
Races - Other race alone (%)
Races - Other race alone (% change since 2000)
Racial diversity
Place of birth - Born in state of residence (%)
Place of birth - Born in state of residence (%) - White
Place of birth - Born in state of residence (%) - Black or African American
Place of birth - Born in state of residence (%) - Asian
Place of birth - Born in state of residence (%) - Hispanic or Latino
Place of birth - Born in state of residence (%) - American Indian and Alaska Native
Place of birth - Born in state of residence (%) - Multirace
Place of birth - Born in state of residence (%) - Other Race
Place of birth - Born in other state (%)
Place of birth - Born in other state (%) - White
Place of birth - Born in other state (%) - Black or African American
Place of birth - Born in other state (%) - Asian
Place of birth - Born in other state (%) - Hispanic or Latino
Place of birth - Born in other state (%) - American Indian and Alaska Native
Place of birth - Born in other state (%) - Multirace
Place of birth - Born in other state (%) - Other Race
Place of birth - Native, outside of US (%)
Place of birth - Native, outside of US (%) - White
Place of birth - Native, outside of US (%) - Black or African American
Place of birth - Native, outside of US (%) - Asian
Place of birth - Native, outside of US (%) - Hispanic or Latino
Place of birth - Native, outside of US (%) - American Indian and Alaska Native
Place of birth - Native, outside of US (%) - Multirace
Place of birth - Native, outside of US (%) - Other Race
Place of birth - Foreign born (%)
Place of birth - Foreign born (%) - White
Place of birth - Foreign born (%) - Black or African American
Place of birth - Foreign born (%) - Asian
Place of birth - Foreign born (%) - Hispanic or Latino
Place of birth - Foreign born (%) - American Indian and Alaska Native
Place of birth - Foreign born (%) - Multirace
Place of birth - Foreign born (%) - Other Race
Residents speaking English at home (%)
Residents speaking English at home - Born in the United States (%)
Residents speaking English at home - Native, born elsewhere (%)
Residents speaking English at home - Foreign born (%)
Residents speaking Spanish at home (%)
Residents speaking Spanish at home - Born in the United States (%)
Residents speaking Spanish at home - Native, born elsewhere (%)
Residents speaking Spanish at home - Foreign born (%)
Residents speaking other language at home (%)
Residents speaking other language at home - Born in the United States (%)
Residents speaking other language at home - Native, born elsewhere (%)
Residents speaking other language at home - Foreign born (%)
Marital status - Never married (%)
Marital status - Now married (%)
Marital status - Separated (%)
Marital status - Widowed (%)
Marital status - Divorced (%)
Ancestries Reported - Arab (%)
Ancestries Reported - Czech (%)
Ancestries Reported - Danish (%)
Ancestries Reported - Dutch (%)
Ancestries Reported - English (%)
Ancestries Reported - French (%)
Ancestries Reported - French Canadian (%)
Ancestries Reported - German (%)
Ancestries Reported - Greek (%)
Ancestries Reported - Hungarian (%)
Ancestries Reported - Irish (%)
Ancestries Reported - Italian (%)
Ancestries Reported - Lithuanian (%)
Ancestries Reported - Norwegian (%)
Ancestries Reported - Polish (%)
Ancestries Reported - Portuguese (%)
Ancestries Reported - Russian (%)
Ancestries Reported - Scotch-Irish (%)
Ancestries Reported - Scottish (%)
Ancestries Reported - Slovak (%)
Ancestries Reported - Subsaharan African (%)
Ancestries Reported - Swedish (%)
Ancestries Reported - Swiss (%)
Ancestries Reported - Ukrainian (%)
Ancestries Reported - United States (%)
Ancestries Reported - Welsh (%)
Ancestries Reported - West Indian (%)
Ancestries Reported - Other (%)
Geographical mobility - Same house 1 year ago (%)
Geographical mobility - Same house 1 year ago (%) - White
Geographical mobility - Same house 1 year ago (%) - Black or African American
Geographical mobility - Same house 1 year ago (%) - Asian
Geographical mobility - Same house 1 year ago (%) - Hispanic or Latino
Geographical mobility - Same house 1 year ago (%) - American Indian and Alaska Native
Geographical mobility - Same house 1 year ago (%) - Multirace
Geographical mobility - Same house 1 year ago (%) - Other Race
Geographical mobility - Moved within same county (%)
Geographical mobility - Moved within same county (%) - White
Geographical mobility - Moved within same county (%) - Black or African American
Geographical mobility - Moved within same county (%) - Asian
Geographical mobility - Moved within same county (%) - Hispanic or Latino
Geographical mobility - Moved within same county (%) - American Indian and Alaska Native
Geographical mobility - Moved within same county (%) - Multirace
Geographical mobility - Moved within same county (%) - Other Race
Geographical mobility - Moved from different county within same state (%)
Geographical mobility - Moved from different county within same state (%) - White
Geographical mobility - Moved from different county within same state (%) - Black or African American
Geographical mobility - Moved from different county within same state (%) - Asian
Geographical mobility - Moved from different county within same state (%) - Hispanic or Latino
Geographical mobility - Moved from different county within same state (%) - American Indian and Alaska Native
Geographical mobility - Moved from different county within same state (%) - Multirace
Geographical mobility - Moved from different county within same state (%) - Other Race
Geographical mobility - Moved from different state (%)
Geographical mobility - Moved from different state (%) - White
Geographical mobility - Moved from different state (%) - Black or African American
Geographical mobility - Moved from different state (%) - Asian
Geographical mobility - Moved from different state (%) - Hispanic or Latino
Geographical mobility - Moved from different state (%) - American Indian and Alaska Native
Geographical mobility - Moved from different state (%) - Multirace
Geographical mobility - Moved from different state (%) - Other Race
Geographical mobility - Moved from abroad (%)
Geographical mobility - Moved from abroad (%) - White
Geographical mobility - Moved from abroad (%) - Black or African American
Geographical mobility - Moved from abroad (%) - Asian
Geographical mobility - Moved from abroad (%) - Hispanic or Latino
Geographical mobility - Moved from abroad (%) - American Indian and Alaska Native
Geographical mobility - Moved from abroad (%) - Multirace
Geographical mobility - Moved from abroad (%) - Other Race
Place of birth for the foreign-born population - Ireland (%)
Place of birth for the foreign-born population - Denmark (%)
Place of birth for the foreign-born population - Norway (%)
Place of birth for the foreign-born population - Sweden (%)
Place of birth for the foreign-born population - United Kingdom (%)
Place of birth for the foreign-born population - England (%)
Place of birth for the foreign-born population - Scotland (%)
Place of birth for the foreign-born population - Other Northern Europe (%)
Place of birth for the foreign-born population - Austria (%)
Place of birth for the foreign-born population - Belgium (%)
Place of birth for the foreign-born population - France (%)
Place of birth for the foreign-born population - Germany (%)
Place of birth for the foreign-born population - Netherlands (%)
Place of birth for the foreign-born population - Switzerland (%)
Place of birth for the foreign-born population - Other Western Europe (%)
Place of birth for the foreign-born population - Greece (%)
Place of birth for the foreign-born population - Italy (%)
Place of birth for the foreign-born population - Portugal (%)
Place of birth for the foreign-born population - Spain (%)
Place of birth for the foreign-born population - Other Southern Europe (%)
Place of birth for the foreign-born population - Albania (%)
Place of birth for the foreign-born population - Belarus (%)
Place of birth for the foreign-born population - Bosnia and Herzegovina (%)
Place of birth for the foreign-born population - Bulgaria (%)
Place of birth for the foreign-born population - Croatia (%)
Place of birth for the foreign-born population - Czechoslovakia (%)
Place of birth for the foreign-born population - Hungary (%)
Place of birth for the foreign-born population - Latvia (%)
Place of birth for the foreign-born population - Lithuania (%)
Place of birth for the foreign-born population - North Macedonia (Macedonia) (%)
Place of birth for the foreign-born population - Moldova (%)
Place of birth for the foreign-born population - Poland (%)
Place of birth for the foreign-born population - Romania (%)
Place of birth for the foreign-born population - Russia (%)
Place of birth for the foreign-born population - Serbia (%)
Place of birth for the foreign-born population - Ukraine (%)
Place of birth for the foreign-born population - Other Eastern Europe (%)
Place of birth for the foreign-born population - China (%)
Place of birth for the foreign-born population - Hong Kong (%)
Place of birth for the foreign-born population - Taiwan (%)
Place of birth for the foreign-born population - Japan (%)
Place of birth for the foreign-born population - Korea (%)
Place of birth for the foreign-born population - Other Eastern Asia (%)
Place of birth for the foreign-born population - Afghanistan (%)
Place of birth for the foreign-born population - Bangladesh (%)
Place of birth for the foreign-born population - India (%)
Place of birth for the foreign-born population - Iran (%)
Place of birth for the foreign-born population - Kazakhstan (%)
Place of birth for the foreign-born population - Nepal (%)
Place of birth for the foreign-born population - Pakistan (%)
Place of birth for the foreign-born population - Sri Lanka (%)
Place of birth for the foreign-born population - Uzbekistan (%)
Place of birth for the foreign-born population - Other South Central Asia (%)
Place of birth for the foreign-born population - Burma (%)
Place of birth for the foreign-born population - Cambodia (%)
Place of birth for the foreign-born population - Indonesia (%)
Place of birth for the foreign-born population - Laos (%)
Place of birth for the foreign-born population - Malaysia (%)
Place of birth for the foreign-born population - Philippines (%)
Place of birth for the foreign-born population - Singapore (%)
Place of birth for the foreign-born population - Thailand (%)
Place of birth for the foreign-born population - Vietnam (%)
Place of birth for the foreign-born population - Other South Eastern Asia (%)
Place of birth for the foreign-born population - Armenia (%)
Place of birth for the foreign-born population - Iraq (%)
Place of birth for the foreign-born population - Israel (%)
Place of birth for the foreign-born population - Jordan (%)
Place of birth for the foreign-born population - Kuwait (%)
Place of birth for the foreign-born population - Lebanon (%)
Place of birth for the foreign-born population - Saudi Arabia (%)
Place of birth for the foreign-born population - Syria (%)
Place of birth for the foreign-born population - Turkey (%)
Place of birth for the foreign-born population - Yemen (%)
Place of birth for the foreign-born population - Other Western Asia (%)
Place of birth for the foreign-born population - Eritrea (%)
Place of birth for the foreign-born population - Ethiopia (%)
Place of birth for the foreign-born population - Kenya (%)
Place of birth for the foreign-born population - Somalia (%)
Place of birth for the foreign-born population - Uganda (%)
Place of birth for the foreign-born population - Zimbabwe (%)
Place of birth for the foreign-born population - Other Eastern Africa (%)
Place of birth for the foreign-born population - Cameroon (%)
Place of birth for the foreign-born population - Congo (%)
Place of birth for the foreign-born population - Democratic Republic of Congo (Zaire) (%)
Place of birth for the foreign-born population - Other Middle Africa (%)
Place of birth for the foreign-born population - Egypt (%)
Place of birth for the foreign-born population - Morocco (%)
Place of birth for the foreign-born population - Sudan (%)
Place of birth for the foreign-born population - Other Northern Africa (%)
Place of birth for the foreign-born population - South Africa (%)
Place of birth for the foreign-born population - Other Southern Africa (%)
Place of birth for the foreign-born population - Cabo Verde (%)
Place of birth for the foreign-born population - Ghana (%)
Place of birth for the foreign-born population - Liberia (%)
Place of birth for the foreign-born population - Nigeria (%)
Place of birth for the foreign-born population - Senegal (%)
Place of birth for the foreign-born population - Sierra Leone (%)
Place of birth for the foreign-born population - Other Western Africa (%)
Place of birth for the foreign-born population - Australia (%)
Place of birth for the foreign-born population - New Zealand (%)
Place of birth for the foreign-born population - Fiji (%)
Place of birth for the foreign-born population - Micronesia (%)
Place of birth for the foreign-born population - Bahamas (%)
Place of birth for the foreign-born population - Barbados (%)
Place of birth for the foreign-born population - Cuba (%)
Place of birth for the foreign-born population - Dominica (%)
Place of birth for the foreign-born population - Dominican Republic (%)
Place of birth for the foreign-born population - Grenada (%)
Place of birth for the foreign-born population - Haiti (%)
Place of birth for the foreign-born population - Jamaica (%)
Place of birth for the foreign-born population - St. Vincent and the Grenadines (%)
Place of birth for the foreign-born population - Trinidad and Tobago (%)
Place of birth for the foreign-born population - West Indies (%)
Place of birth for the foreign-born population - Other Caribbean (%)
Place of birth for the foreign-born population - Belize (%)
Place of birth for the foreign-born population - Costa Rica (%)
Place of birth for the foreign-born population - El Salvador (%)
Place of birth for the foreign-born population - Guatemala (%)
Place of birth for the foreign-born population - Honduras (%)
Place of birth for the foreign-born population - Mexico (%)
Place of birth for the foreign-born population - Nicaragua (%)
Place of birth for the foreign-born population - Panama (%)
Place of birth for the foreign-born population - Other Central America (%)
Place of birth for the foreign-born population - Argentina (%)
Place of birth for the foreign-born population - Bolivia (%)
Place of birth for the foreign-born population - Brazil (%)
Place of birth for the foreign-born population - Chile (%)
Place of birth for the foreign-born population - Colombia (%)
Place of birth for the foreign-born population - Ecuador (%)
Place of birth for the foreign-born population - Guyana (%)
Place of birth for the foreign-born population - Peru (%)
Place of birth for the foreign-born population - Uruguay (%)
Place of birth for the foreign-born population - Venezuela (%)
Place of birth for the foreign-born population - Other South America (%)
Place of birth for the foreign-born population - Canada (%)
Place of birth for the foreign-born population - Other Northern America (%)
Place of birth for the foreign-born population - Other (%)
Latest news about races in Berea, OH collected exclusively by city-data.com from local newspapers, TV, and radio stations
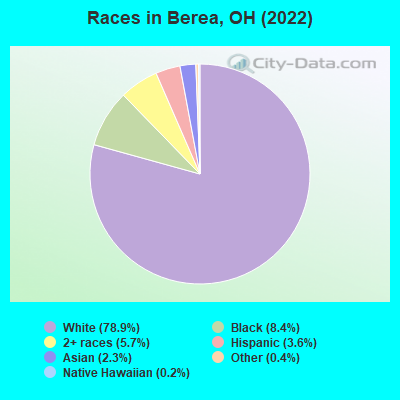
According to 2022 data, the most numerous races in Berea, OH are White alone (14,403 residents), Black alone (1,524 residents), and Two or more races (1,031 residents). 95.3% of Berea residents speak English at home. 2.3% of Berea, OH residents are foreign-born (1.0% born in Asia, 0.5% born in Europe, 0.3% born in Africa, 0.3% born in Latin America), which is 72.9% less than the foreign-born rate of 4.0% across the entire state of Ohio.
Race distribution in Berea
2000 2022
9,538,111 84.0% White alone 1,290,662 11.4% Black alone 217,123 1.9% Hispanic 137,770 1.2% Two or more races 131,670 1.2% Asian alone 21,985 0.2% American Indian alone 13,483 0.1% Other race alone 2,336 0.02% Native Hawaiian and Other
8,948,793 76.1% White alone 1,401,403 11.9% Black alone 529,291 4.5% Two or more races 517,232 4.4% Hispanic 293,387 2.5% Asian alone 52,805 0.4% Other race alone 9,785 0.08% American Indian alone 3,362 0.03% Native Hawaiian and Other
Income and house value in Berea Median household income in 2022 $67,586 White non-Hispanic householders$85,796 Black householders$119,605 Asian householders$38,734 Two or more races householders$53,372 Hispanic or Latino race householdersMedian 2022 house value $193,802 White Non-Hispanic householders$186,782 Black or African American householders$155,107 American Indian or Alaska Native householders $207,517 Asian householders$265,315 Some other race householders$175,516 Two or more races householders$209,150 Hispanic or Latino householders
Median age by race in Berea
40.4 Median age for White residents40.1 40.6 32.0 Median age for Black or African American residents42.5 20.1 -545,601,290.8 Median age for American Indian / Alaska Native residents-734,374,999.3 -499,999,999.5 23.5 Median age for Asian residents27.5 22.2 18.3 Median age for Native Hawaiian / Pacific Islander residents-750,242,953.6 -805,394,989.6 24.4 Median age for Other race residents21.9 19.3 20.4 Median age for Two or more races residents17.7 23.5 40.2 Median age for White alone residents40.1 40.4 21.5 Median age for Hispanic or Latino residents21.4 21.1
Owner/renter occupied households by race in Berea
House owners and renters - White residents 4,723 74.9% Owner occupied1,584 25.1% Renter occupiedHouse owners and renters - Black or African American residents 207 49.6% Owner occupied210 50.4% Renter occupiedHouse owners and renters - American Indian / Alaska Native residents 16 100.0% Renter occupiedHouse owners and renters - Asian residents 70 90.1% Owner occupied8 9.9% Renter occupiedHouse owners and renters - Other race residents 19 25.3% Owner occupied55 74.7% Renter occupiedHouse owners and renters - Two or more races residents 123 58.6% Owner occupied87 41.4% Renter occupiedHouse owners and renters - White alone residents 4,662 74.2% Owner occupied1,625 25.8% Renter occupiedHouse owners and renters - Hispanic or Latino residents 139 68.6% Owner occupied63 31.4% Renter occupied
Language usage in Berea
English speakers - Total 95.3% of residents of Berea speak English at home.
1.2% of residents speak Spanish at home 165 79.7% Speak English very well42 20.3% Speak English less than very well3.4% of residents speak other language at home 462 77.3% Speak English very well136 22.7% Speak English less than very well
English speakers - Born in the United States 94.4% of residents of Berea speak English at home.
1.2% of residents speak Spanish at home 46 100.0% Speak English very well4.7% of residents speak other language at home 154 84.2% Speak English very well29 15.8% Speak English less than very well
English speakers - Native, born elsewhere 69.0% of residents of Berea speak English at home.
6.9% of residents speak Spanish at home 4 100.0% Speak English less than very well17.2% of residents speak other language at home 10 100.0% Speak English very well
English speakers - Foreign-born 25.4% of residents of Berea speak English at home.
5.4% of residents speak Spanish at home 2 9.1% Speak English very well20 90.9% Speak English less than very well69.5% of residents speak other language at home 199 70.6% Speak English very well83 29.4% Speak English less than very well
White (Caucasian) - Speak only English Native:
99.4% (13,722)Foreign-born:
55.0% (76)
White (Caucasian) - Speak another language Native:
1.2% (171)Foreign-born:
45.8% (63)
Black or African American - Speak only English Native:
100.0% (1,504)Foreign-born:
5.7% (4)
Black or African American - Speak another language Native:
0.3% (5)Foreign-born:
100.0% (69)
Asian - Speak only English Native:
29.4% (72)Foreign-born:
13.5% (25)
Asian - Speak another language Native:
72.9% (177)Foreign-born:
86.5% (158)
Other race - Speak another language Native:
35.6% (66)Foreign-born:
100.0% (15)
White alone - Speak only English Native:
98.5% (13,638)Foreign-born:
45.0% (52)
White alone - Speak another language Native:
1.4% (190)Foreign-born:
54.9% (64)
Hispanic or Latino - Speak only English Native:
76.0% (418)Foreign-born:
40.8% (21)
Hispanic or Latino - Speak another language Native:
25.2% (139)Foreign-born:
42.5% (22)
Foreign-born residents in Berea 422 residents are foreign born (1.0% Asia , 0.5% Europe , 0.3% Africa , 0.3% Latin America ).
Marital status for residents in Berea Marital status - White (Caucasian) population 15 years and over
Males 42.4% Never married41.7% Now married2.3% Separated4.4% Widowed9.2% DivorcedFemales 40.6% Never married36.8% Now married0.3% Separated9.8% Widowed12.4% DivorcedWomen who gave birth in the past 12 months Now married:
41.9% (61)Unmarried:
58.1% (84)
Women who did not give birth in the past 12 months Now married:
29.3% (1,017)Unmarried:
70.7% (2,452)
Marital status - Black or African American population 15 years and over
Males 41.5% Never married31.2% Now married2.6% Separated3.3% Widowed21.4% DivorcedFemales 79.5% Never married13.9% Now married0.0% Separated5.4% Widowed1.1% DivorcedWomen who did not give birth in the past 12 months Now married:
3.0% (14)Unmarried:
97.0% (455)
Marital status - Asian population 15 years and over
Males 54.7% Never married21.8% Now married0.0% Separated0.0% Widowed23.5% DivorcedFemales 59.5% Never married36.9% Now married0.0% Separated0.0% Widowed3.6% DivorcedWomen who gave birth in the past 12 months Now married:
0.0% (0)Unmarried:
100.0% (10)
Women who did not give birth in the past 12 months Now married:
26.9% (40)Unmarried:
73.1% (109)
Marital status - Native Hawaiian / Pacific Islander population 15 years and over
Males 100.0% Never married0.0% Now married0.0% Separated0.0% Widowed0.0% DivorcedFemales 100.0% Never married0.0% Now married0.0% Separated0.0% Widowed0.0% DivorcedWomen who did not give birth in the past 12 months Now married:
0.0% (0)Unmarried:
100.0% (31)
Marital status - Other race population 15 years and over
Males 50.7% Never married49.3% Now married0.0% Separated0.0% Widowed0.0% DivorcedFemales 44.0% Never married0.0% Now married0.0% Separated0.0% Widowed56.0% DivorcedWomen who did not give birth in the past 12 months Now married:
0.0% (0)Unmarried:
100.0% (45)
Marital status - Two or more races population 15 years and over
Males 82.4% Never married10.6% Now married2.4% Separated0.0% Widowed4.5% DivorcedFemales 81.3% Never married12.4% Now married0.0% Separated5.1% Widowed1.2% DivorcedWomen who gave birth in the past 12 months Now married:
33.3% (7)Unmarried:
66.7% (14)
Women who did not give birth in the past 12 months Now married:
6.5% (33)Unmarried:
93.5% (474)
Marital status - White alone, not Hispanic / Latino population 15 years and over
Males 42.3% Never married41.7% Now married2.3% Separated4.4% Widowed9.2% DivorcedFemales 40.4% Never married37.0% Now married0.4% Separated9.6% Widowed12.7% DivorcedWomen who gave birth in the past 12 months Now married:
41.9% (63)Unmarried:
58.1% (87)
Women who did not give birth in the past 12 months Now married:
29.7% (1,031)Unmarried:
70.3% (2,443)
Marital status - Hispanic or Latino population 15 years and over
Males 57.1% Never married27.0% Now married0.0% Separated0.0% Widowed15.8% DivorcedFemales 58.3% Never married22.2% Now married0.0% Separated13.9% Widowed5.6% DivorcedWomen who did not give birth in the past 12 months Now married:
11.1% (20)Unmarried:
88.9% (159)
Ancestries in Berea
981 14.6% German744 11.1% American544 8.1% Irish543 8.1% English403 6.0% Polish379 5.6% Italian179 2.7% Scottish148 2.2% Slovak142 2.1% European123 1.8% Hungarian91 1.4% Scotch-Irish61 0.9% Eastern European56 0.8% Welsh50 0.7% Norwegian43 0.6% Czech42 0.6% British41 0.6% Slovene34 0.5% Lebanese31 0.5% Ukrainian30 0.4% French Canadian24 0.4% Greek21 0.3% Dutch18 0.3% French16 0.2% Bulgarian13 0.2% Ghanaian13 0.2% Nigerian12 0.2% Canadian10 0.1% Serbian10 0.1% African8 0.1% Russian7 0.1% Croatian7 0.1% Finnish7 0.1% Romanian7 0.1% Danish7 0.1% Swiss7 0.1% Austrian7 0.1% Belizean6 0.09% Egyptian6 0.09% Latvian4 0.06% Northern European3 0.04% Palestinian3 0.04% Haitian3 0.04% Trinidadian and Tobagonian2 0.03% Czechoslovakian1 0.01% Arab
Geographical mobility in Berea Same house 1 year ago 12,365 86.5% White (Caucasian)1,323 83.9% Black or African American21 100.0% American Indian / Alaska Native305 72.1% Asian73 100.0% Native Hawaiian / Pacific Islander134 68.0% Other race1,222 86.3% Two or more races12,374 86.2% White alone, not Hispanic / Latino528 81.8% Hispanic or LatinoMoved within same county 1,035 7.2% White / Caucasian156 9.9% Black or African American51 12.0% Asian42 21.3% Other race83 5.9% Two or more races1,065 7.4% White alone, not Hispanic / Latino54 8.3% Hispanic or LatinoMoved within same state 551 3.9% White / Caucasian56 3.5% Black or African American29 6.8% Asian41 2.9% Two or more races555 3.9% White alone, not Hispanic / Latino30 4.6% Hispanic or LatinoMoved from different state 377 2.6% White / Caucasian10 0.7% Black or African American7 1.7% Asian17 8.5% Other race87 6.1% Two or more races389 2.7% White alone, not Hispanic / Latino38 5.9% Hispanic or LatinoMoved from abroad 6 0.0% White37 2.3% Black or African American46 10.8% Asian8 0.1% White alone, not Hispanic / Latino
Children Nativity (place of birth) in Berea
Children under 6 years - Living with two parents Both parents native 537 100.0% NativeBoth parents foreign-born 11 100.0% NativeOne native, one foreign-born parent 43 100.0% NativeChildren under 6 years - Living with one parent Native parent 263 100.0% Native
Children 6 to 17 years - Living with two parents Both parents native 1,231 100.0% NativeBoth parents foreign-born 25 100.0% NativeOne native, one foreign-born parent 53 100.0% NativeChildren 6 to 17 years - Living with one parent Native parent 1,065 100.0% Native
Grandparents responsible for own grandchildren in Berea
Grandparents (30 to 59 years) White / Caucasian 52 100.0% Not responsible for grandchildrenBlack or African American 7 100.0% Responsible for grandchildrenWhite alone, not Hispanic / Latino 52 100.0% Not responsible for grandchildrenGrandparents (60 years and over) White / Caucasian 24 36.7% Responsible for grandchildren41 63.3% Not responsible for grandchildrenBlack or African American 5 24.1% Responsible for grandchildren16 75.9% Not responsible for grandchildrenWhite alone, not Hispanic / Latino 24 36.1% Responsible for grandchildren43 63.9% Not responsible for grandchildren