Races in Berkeley, California (CA) Detailed Stats
Data:
Races - White alone (%)
Races - White alone (% change since 2000)
Races - Black alone (%)
Races - Black alone (% change since 2000)
Races - American Indian alone (%)
Races - American Indian alone (% change since 2000)
Races - Asian alone (%)
Races - Asian alone (% change since 2000)
Races - Hispanic (%)
Races - Hispanic (% change since 2000)
Races - Native Hawaiian and Other Pacific Islander alone (%)
Races - Native Hawaiian and Other Pacific Islander alone (% change since 2000)
Races - Two or more races(%)
Races - Two or more races(% change since 2000)
Races - Other race alone (%)
Races - Other race alone (% change since 2000)
Racial diversity
Place of birth - Born in state of residence (%)
Place of birth - Born in state of residence (%) - White
Place of birth - Born in state of residence (%) - Black or African American
Place of birth - Born in state of residence (%) - Asian
Place of birth - Born in state of residence (%) - Hispanic or Latino
Place of birth - Born in state of residence (%) - American Indian and Alaska Native
Place of birth - Born in state of residence (%) - Multirace
Place of birth - Born in state of residence (%) - Other Race
Place of birth - Born in other state (%)
Place of birth - Born in other state (%) - White
Place of birth - Born in other state (%) - Black or African American
Place of birth - Born in other state (%) - Asian
Place of birth - Born in other state (%) - Hispanic or Latino
Place of birth - Born in other state (%) - American Indian and Alaska Native
Place of birth - Born in other state (%) - Multirace
Place of birth - Born in other state (%) - Other Race
Place of birth - Native, outside of US (%)
Place of birth - Native, outside of US (%) - White
Place of birth - Native, outside of US (%) - Black or African American
Place of birth - Native, outside of US (%) - Asian
Place of birth - Native, outside of US (%) - Hispanic or Latino
Place of birth - Native, outside of US (%) - American Indian and Alaska Native
Place of birth - Native, outside of US (%) - Multirace
Place of birth - Native, outside of US (%) - Other Race
Place of birth - Foreign born (%)
Place of birth - Foreign born (%) - White
Place of birth - Foreign born (%) - Black or African American
Place of birth - Foreign born (%) - Asian
Place of birth - Foreign born (%) - Hispanic or Latino
Place of birth - Foreign born (%) - American Indian and Alaska Native
Place of birth - Foreign born (%) - Multirace
Place of birth - Foreign born (%) - Other Race
Residents speaking English at home (%)
Residents speaking English at home - Born in the United States (%)
Residents speaking English at home - Native, born elsewhere (%)
Residents speaking English at home - Foreign born (%)
Residents speaking Spanish at home (%)
Residents speaking Spanish at home - Born in the United States (%)
Residents speaking Spanish at home - Native, born elsewhere (%)
Residents speaking Spanish at home - Foreign born (%)
Residents speaking other language at home (%)
Residents speaking other language at home - Born in the United States (%)
Residents speaking other language at home - Native, born elsewhere (%)
Residents speaking other language at home - Foreign born (%)
Marital status - Never married (%)
Marital status - Now married (%)
Marital status - Separated (%)
Marital status - Widowed (%)
Marital status - Divorced (%)
Ancestries Reported - Arab (%)
Ancestries Reported - Czech (%)
Ancestries Reported - Danish (%)
Ancestries Reported - Dutch (%)
Ancestries Reported - English (%)
Ancestries Reported - French (%)
Ancestries Reported - French Canadian (%)
Ancestries Reported - German (%)
Ancestries Reported - Greek (%)
Ancestries Reported - Hungarian (%)
Ancestries Reported - Irish (%)
Ancestries Reported - Italian (%)
Ancestries Reported - Lithuanian (%)
Ancestries Reported - Norwegian (%)
Ancestries Reported - Polish (%)
Ancestries Reported - Portuguese (%)
Ancestries Reported - Russian (%)
Ancestries Reported - Scotch-Irish (%)
Ancestries Reported - Scottish (%)
Ancestries Reported - Slovak (%)
Ancestries Reported - Subsaharan African (%)
Ancestries Reported - Swedish (%)
Ancestries Reported - Swiss (%)
Ancestries Reported - Ukrainian (%)
Ancestries Reported - United States (%)
Ancestries Reported - Welsh (%)
Ancestries Reported - West Indian (%)
Ancestries Reported - Other (%)
Geographical mobility - Same house 1 year ago (%)
Geographical mobility - Same house 1 year ago (%) - White
Geographical mobility - Same house 1 year ago (%) - Black or African American
Geographical mobility - Same house 1 year ago (%) - Asian
Geographical mobility - Same house 1 year ago (%) - Hispanic or Latino
Geographical mobility - Same house 1 year ago (%) - American Indian and Alaska Native
Geographical mobility - Same house 1 year ago (%) - Multirace
Geographical mobility - Same house 1 year ago (%) - Other Race
Geographical mobility - Moved within same county (%)
Geographical mobility - Moved within same county (%) - White
Geographical mobility - Moved within same county (%) - Black or African American
Geographical mobility - Moved within same county (%) - Asian
Geographical mobility - Moved within same county (%) - Hispanic or Latino
Geographical mobility - Moved within same county (%) - American Indian and Alaska Native
Geographical mobility - Moved within same county (%) - Multirace
Geographical mobility - Moved within same county (%) - Other Race
Geographical mobility - Moved from different county within same state (%)
Geographical mobility - Moved from different county within same state (%) - White
Geographical mobility - Moved from different county within same state (%) - Black or African American
Geographical mobility - Moved from different county within same state (%) - Asian
Geographical mobility - Moved from different county within same state (%) - Hispanic or Latino
Geographical mobility - Moved from different county within same state (%) - American Indian and Alaska Native
Geographical mobility - Moved from different county within same state (%) - Multirace
Geographical mobility - Moved from different county within same state (%) - Other Race
Geographical mobility - Moved from different state (%)
Geographical mobility - Moved from different state (%) - White
Geographical mobility - Moved from different state (%) - Black or African American
Geographical mobility - Moved from different state (%) - Asian
Geographical mobility - Moved from different state (%) - Hispanic or Latino
Geographical mobility - Moved from different state (%) - American Indian and Alaska Native
Geographical mobility - Moved from different state (%) - Multirace
Geographical mobility - Moved from different state (%) - Other Race
Geographical mobility - Moved from abroad (%)
Geographical mobility - Moved from abroad (%) - White
Geographical mobility - Moved from abroad (%) - Black or African American
Geographical mobility - Moved from abroad (%) - Asian
Geographical mobility - Moved from abroad (%) - Hispanic or Latino
Geographical mobility - Moved from abroad (%) - American Indian and Alaska Native
Geographical mobility - Moved from abroad (%) - Multirace
Geographical mobility - Moved from abroad (%) - Other Race
Place of birth for the foreign-born population - Ireland (%)
Place of birth for the foreign-born population - Denmark (%)
Place of birth for the foreign-born population - Norway (%)
Place of birth for the foreign-born population - Sweden (%)
Place of birth for the foreign-born population - United Kingdom (%)
Place of birth for the foreign-born population - England (%)
Place of birth for the foreign-born population - Scotland (%)
Place of birth for the foreign-born population - Other Northern Europe (%)
Place of birth for the foreign-born population - Austria (%)
Place of birth for the foreign-born population - Belgium (%)
Place of birth for the foreign-born population - France (%)
Place of birth for the foreign-born population - Germany (%)
Place of birth for the foreign-born population - Netherlands (%)
Place of birth for the foreign-born population - Switzerland (%)
Place of birth for the foreign-born population - Other Western Europe (%)
Place of birth for the foreign-born population - Greece (%)
Place of birth for the foreign-born population - Italy (%)
Place of birth for the foreign-born population - Portugal (%)
Place of birth for the foreign-born population - Spain (%)
Place of birth for the foreign-born population - Other Southern Europe (%)
Place of birth for the foreign-born population - Albania (%)
Place of birth for the foreign-born population - Belarus (%)
Place of birth for the foreign-born population - Bosnia and Herzegovina (%)
Place of birth for the foreign-born population - Bulgaria (%)
Place of birth for the foreign-born population - Croatia (%)
Place of birth for the foreign-born population - Czechoslovakia (%)
Place of birth for the foreign-born population - Hungary (%)
Place of birth for the foreign-born population - Latvia (%)
Place of birth for the foreign-born population - Lithuania (%)
Place of birth for the foreign-born population - North Macedonia (Macedonia) (%)
Place of birth for the foreign-born population - Moldova (%)
Place of birth for the foreign-born population - Poland (%)
Place of birth for the foreign-born population - Romania (%)
Place of birth for the foreign-born population - Russia (%)
Place of birth for the foreign-born population - Serbia (%)
Place of birth for the foreign-born population - Ukraine (%)
Place of birth for the foreign-born population - Other Eastern Europe (%)
Place of birth for the foreign-born population - China (%)
Place of birth for the foreign-born population - Hong Kong (%)
Place of birth for the foreign-born population - Taiwan (%)
Place of birth for the foreign-born population - Japan (%)
Place of birth for the foreign-born population - Korea (%)
Place of birth for the foreign-born population - Other Eastern Asia (%)
Place of birth for the foreign-born population - Afghanistan (%)
Place of birth for the foreign-born population - Bangladesh (%)
Place of birth for the foreign-born population - India (%)
Place of birth for the foreign-born population - Iran (%)
Place of birth for the foreign-born population - Kazakhstan (%)
Place of birth for the foreign-born population - Nepal (%)
Place of birth for the foreign-born population - Pakistan (%)
Place of birth for the foreign-born population - Sri Lanka (%)
Place of birth for the foreign-born population - Uzbekistan (%)
Place of birth for the foreign-born population - Other South Central Asia (%)
Place of birth for the foreign-born population - Burma (%)
Place of birth for the foreign-born population - Cambodia (%)
Place of birth for the foreign-born population - Indonesia (%)
Place of birth for the foreign-born population - Laos (%)
Place of birth for the foreign-born population - Malaysia (%)
Place of birth for the foreign-born population - Philippines (%)
Place of birth for the foreign-born population - Singapore (%)
Place of birth for the foreign-born population - Thailand (%)
Place of birth for the foreign-born population - Vietnam (%)
Place of birth for the foreign-born population - Other South Eastern Asia (%)
Place of birth for the foreign-born population - Armenia (%)
Place of birth for the foreign-born population - Iraq (%)
Place of birth for the foreign-born population - Israel (%)
Place of birth for the foreign-born population - Jordan (%)
Place of birth for the foreign-born population - Kuwait (%)
Place of birth for the foreign-born population - Lebanon (%)
Place of birth for the foreign-born population - Saudi Arabia (%)
Place of birth for the foreign-born population - Syria (%)
Place of birth for the foreign-born population - Turkey (%)
Place of birth for the foreign-born population - Yemen (%)
Place of birth for the foreign-born population - Other Western Asia (%)
Place of birth for the foreign-born population - Eritrea (%)
Place of birth for the foreign-born population - Ethiopia (%)
Place of birth for the foreign-born population - Kenya (%)
Place of birth for the foreign-born population - Somalia (%)
Place of birth for the foreign-born population - Uganda (%)
Place of birth for the foreign-born population - Zimbabwe (%)
Place of birth for the foreign-born population - Other Eastern Africa (%)
Place of birth for the foreign-born population - Cameroon (%)
Place of birth for the foreign-born population - Congo (%)
Place of birth for the foreign-born population - Democratic Republic of Congo (Zaire) (%)
Place of birth for the foreign-born population - Other Middle Africa (%)
Place of birth for the foreign-born population - Egypt (%)
Place of birth for the foreign-born population - Morocco (%)
Place of birth for the foreign-born population - Sudan (%)
Place of birth for the foreign-born population - Other Northern Africa (%)
Place of birth for the foreign-born population - South Africa (%)
Place of birth for the foreign-born population - Other Southern Africa (%)
Place of birth for the foreign-born population - Cabo Verde (%)
Place of birth for the foreign-born population - Ghana (%)
Place of birth for the foreign-born population - Liberia (%)
Place of birth for the foreign-born population - Nigeria (%)
Place of birth for the foreign-born population - Senegal (%)
Place of birth for the foreign-born population - Sierra Leone (%)
Place of birth for the foreign-born population - Other Western Africa (%)
Place of birth for the foreign-born population - Australia (%)
Place of birth for the foreign-born population - New Zealand (%)
Place of birth for the foreign-born population - Fiji (%)
Place of birth for the foreign-born population - Micronesia (%)
Place of birth for the foreign-born population - Bahamas (%)
Place of birth for the foreign-born population - Barbados (%)
Place of birth for the foreign-born population - Cuba (%)
Place of birth for the foreign-born population - Dominica (%)
Place of birth for the foreign-born population - Dominican Republic (%)
Place of birth for the foreign-born population - Grenada (%)
Place of birth for the foreign-born population - Haiti (%)
Place of birth for the foreign-born population - Jamaica (%)
Place of birth for the foreign-born population - St. Vincent and the Grenadines (%)
Place of birth for the foreign-born population - Trinidad and Tobago (%)
Place of birth for the foreign-born population - West Indies (%)
Place of birth for the foreign-born population - Other Caribbean (%)
Place of birth for the foreign-born population - Belize (%)
Place of birth for the foreign-born population - Costa Rica (%)
Place of birth for the foreign-born population - El Salvador (%)
Place of birth for the foreign-born population - Guatemala (%)
Place of birth for the foreign-born population - Honduras (%)
Place of birth for the foreign-born population - Mexico (%)
Place of birth for the foreign-born population - Nicaragua (%)
Place of birth for the foreign-born population - Panama (%)
Place of birth for the foreign-born population - Other Central America (%)
Place of birth for the foreign-born population - Argentina (%)
Place of birth for the foreign-born population - Bolivia (%)
Place of birth for the foreign-born population - Brazil (%)
Place of birth for the foreign-born population - Chile (%)
Place of birth for the foreign-born population - Colombia (%)
Place of birth for the foreign-born population - Ecuador (%)
Place of birth for the foreign-born population - Guyana (%)
Place of birth for the foreign-born population - Peru (%)
Place of birth for the foreign-born population - Uruguay (%)
Place of birth for the foreign-born population - Venezuela (%)
Place of birth for the foreign-born population - Other South America (%)
Place of birth for the foreign-born population - Canada (%)
Place of birth for the foreign-born population - Other Northern America (%)
Place of birth for the foreign-born population - Other (%)
Latest news about races in Berkeley, CA collected exclusively by city-data.com from local newspapers, TV, and radio stations
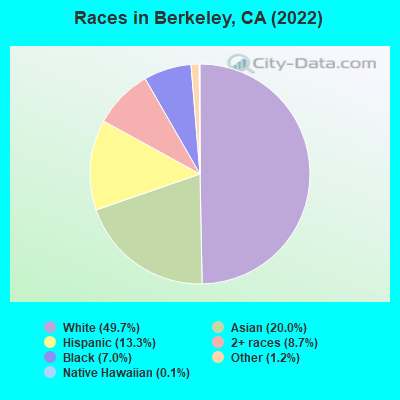
According to 2022 data, the most numerous races in Berkeley, CA are Hispanic (15,150 residents), White alone (61,770 residents), and Asian alone (28,246 residents). 70.6% of Berkeley residents speak English at home. 21.1% of Berkeley, CA residents are foreign-born (11.8% born in Asia, 4.1% born in Europe, 3.4% born in Latin America), which is 23.1% less than the foreign-born rate of 26.0% across the entire state of California.
Race distribution in Berkeley
2000 2022
56,691 55.2% White alone 16,740 16.3% Asian alone 13,707 13.3% Black alone 10,001 9.7% Hispanic 4,592 4.5% Two or more races 598 0.6% Other race alone 293 0.3% American Indian alone 121 0.1% Native Hawaiian and Other
61,770 50.8% White alone 28,246 23.2% Asian alone 15,150 12.5% Hispanic 8,596 7.1% Two or more races 6,632 5.5% Black alone 554 0.5% Other race alone 219 0.2% American Indian alone 53 0.04% Native Hawaiian and Other
2000 2022
15,816,790 46.7% White alone 10,966,556 32.4% Hispanic 3,648,860 10.8% Asian alone 2,181,926 6.4% Black alone 903,115 2.7% Two or more races 178,984 0.5% American Indian alone 103,736 0.3% Native Hawaiian and Other 71,681 0.2% Other race alone
15,732,184 40.3% Hispanic 13,160,426 33.7% White alone 5,957,867 15.3% Asian alone 2,025,218 5.2% Black alone 1,663,222 4.3% Two or more races 251,618 0.6% Other race alone 135,777 0.3% Native Hawaiian and Other 103,030 0.3% American Indian alone
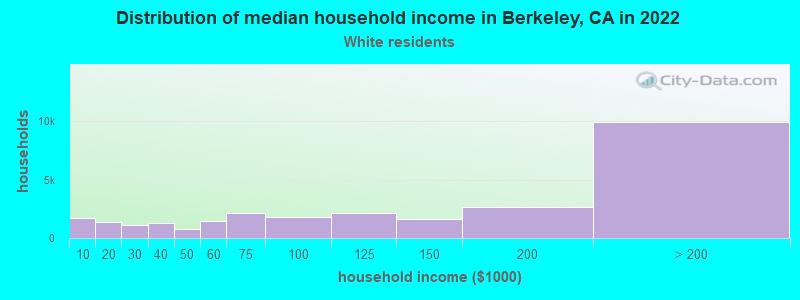
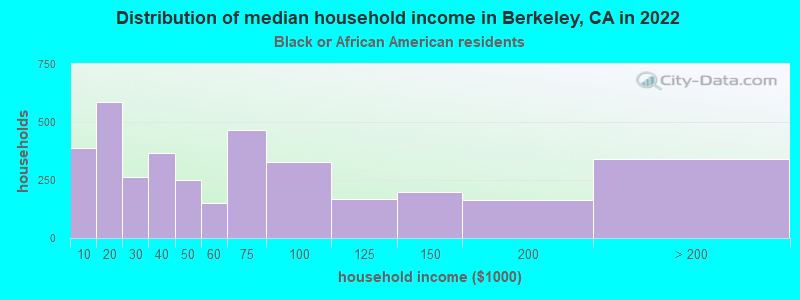
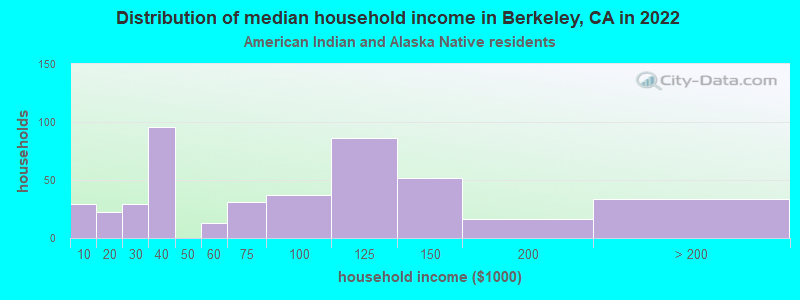
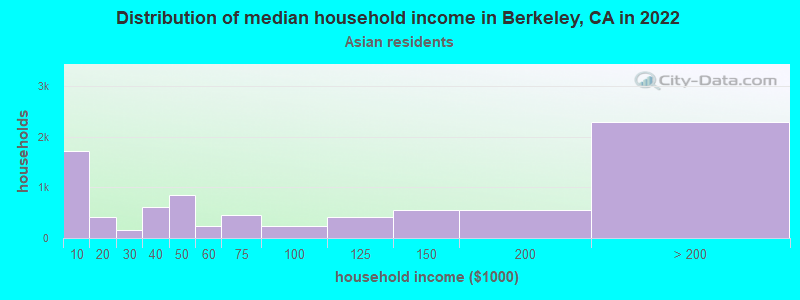
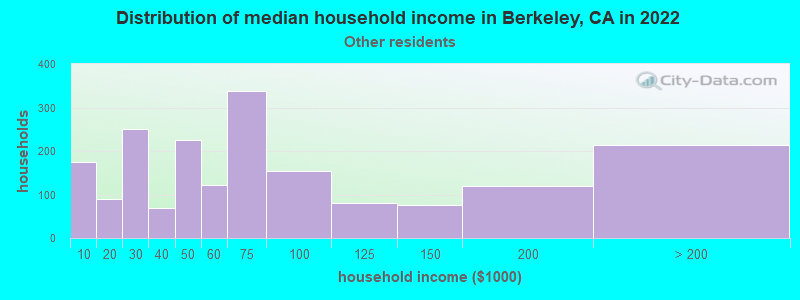
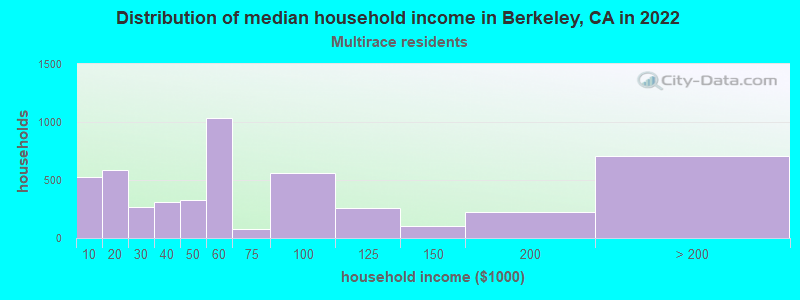
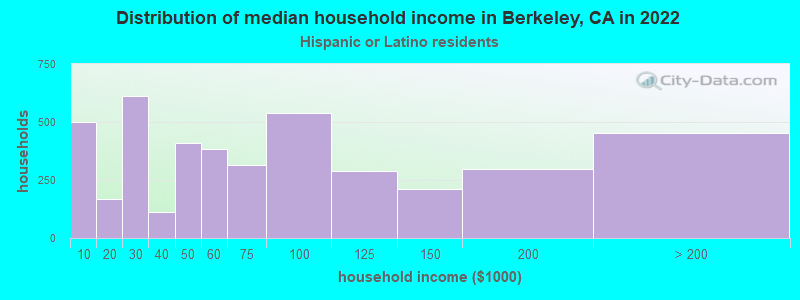
Income and house value in Berkeley Median household income in 2022 $138,399 White non-Hispanic householders$49,971 Black householders$35,060 American Indian and Alaska Native householders$75,296 Asian householders$11,718 Native Hawaiian and other Pacific Islander householders$179,486 Some other race householders$122,303 Two or more races householders$100,757 Hispanic or Latino race householdersMedian 2022 house value over $1,000,000 White Non-Hispanic householders$906,662 Black or African American householders$899,824 American Indian or Alaska Native householders over $1,000,000 Asian householders$809,841 Native Hawaiian and other Pacific Islander householdersover $1,000,000 Some other race householdersover $1,000,000 Two or more races householdersover $1,000,000 Hispanic or Latino householders
Median age by race in Berkeley
38.6 Median age for White residents38.1 40.1 40.2 Median age for Black or African American residents39.6 40.3 31.8 Median age for American Indian / Alaska Native residents36.0 30.1 24.7 Median age for Asian residents25.6 24.0 30.6 Median age for Native Hawaiian / Pacific Islander residents42.6 27.9 28.2 Median age for Other race residents29.9 27.2 27.4 Median age for Two or more races residents26.4 28.4 39.1 Median age for White alone residents37.4 40.7 25.3 Median age for Hispanic or Latino residents25.6 24.8
Owner/renter occupied households by race in Berkeley
House owners and renters - White residents 13,090 50.4% Owner occupied12,866 49.6% Renter occupiedHouse owners and renters - Black or African American residents 772 26.5% Owner occupied2,139 73.5% Renter occupiedHouse owners and renters - American Indian / Alaska Native residents 29 6.1% Owner occupied444 93.9% Renter occupiedHouse owners and renters - Asian residents 2,320 26.9% Owner occupied6,294 73.1% Renter occupiedHouse owners and renters - Native Hawaiian / Pacific Islander residents 16 11.0% Owner occupied132 89.0% Renter occupiedHouse owners and renters - Other race residents 616 64.5% Owner occupied339 35.5% Renter occupiedHouse owners and renters - Two or more races residents 1,467 23.6% Owner occupied4,750 76.4% Renter occupiedHouse owners and renters - White alone residents 13,655 50.2% Owner occupied13,520 49.8% Renter occupiedHouse owners and renters - Hispanic or Latino residents 1,271 32.7% Owner occupied2,618 67.3% Renter occupied
Language usage in Berkeley
English speakers - Total 70.6% of residents of Berkeley speak English at home.
8.0% of residents speak Spanish at home 7,679 81.2% Speak English very well1,776 18.8% Speak English less than very well22.1% of residents speak other language at home 20,818 79.8% Speak English very well5,283 20.2% Speak English less than very well
English speakers - Born in the United States 88.0% of residents of Berkeley speak English at home.
3.4% of residents speak Spanish at home 1,090 90.8% Speak English very well111 9.2% Speak English less than very well9.0% of residents speak other language at home 3,106 96.1% Speak English very well126 3.9% Speak English less than very well
English speakers - Native, born elsewhere 62.2% of residents of Berkeley speak English at home.
12.9% of residents speak Spanish at home 307 100.0% Speak English very well24.1% of residents speak other language at home 542 94.6% Speak English very well31 5.4% Speak English less than very well
English speakers - Foreign-born 26.0% of residents of Berkeley speak English at home.
12.7% of residents speak Spanish at home 2,003 62.1% Speak English very well1,222 37.9% Speak English less than very well65.0% of residents speak other language at home 11,723 71.3% Speak English very well4,723 28.7% Speak English less than very well
White (Caucasian) - Speak only English Native:
96.0% (50,342)Foreign-born:
47.7% (2,809)
White (Caucasian) - Speak another language Native:
7.3% (3,828)Foreign-born:
61.3% (3,605)
Black or African American - Speak only English Native:
95.3% (7,720)Foreign-born:
49.0% (462)
Black or African American - Speak another language Native:
4.8% (385)Foreign-born:
56.1% (529)
American Indian / Alaska Native - Speak only English Native:
64.0% (405)Foreign-born:
13.5% (27)
American Indian / Alaska Native - Speak another language Native:
33.9% (215)Foreign-born:
85.6% (168)
Asian - Speak only English Native:
57.6% (8,810)Foreign-born:
24.9% (3,287)
Asian - Speak another language Native:
42.4% (6,485)Foreign-born:
76.5% (10,080)
Native Hawaiian / Pacific Islander - Speak only English Native:
62.6% (192)Foreign-born:
12.1% (30)
Native Hawaiian / Pacific Islander - Speak another language Native:
36.3% (111)Foreign-born:
86.0% (213)
Other race - Speak only English Native:
59.9% (1,716)Foreign-born:
28.5% (428)
Other race - Speak another language Native:
43.9% (1,258)Foreign-born:
78.3% (1,176)
Two or more races - Speak only English Native:
66.2% (11,600)Foreign-born:
13.5% (557)
Two or more races - Speak another language Native:
29.7% (5,197)Foreign-born:
82.7% (3,413)
White alone - Speak only English Native:
93.4% (50,641)Foreign-born:
42.9% (2,806)
White alone - Speak another language Native:
6.7% (3,605)Foreign-born:
56.9% (3,720)
Hispanic or Latino - Speak only English Native:
61.1% (6,216)Foreign-born:
15.7% (582)
Hispanic or Latino - Speak another language Native:
40.4% (4,109)Foreign-born:
87.0% (3,222)
Foreign-born residents in Berkeley 25,932 residents are foreign born (11.8% Asia , 4.1% Europe , 3.4% Latin America ).
This city:
21.1%California:
100.0%
Marital status for residents in Berkeley Marital status - White (Caucasian) population 15 years and over
Males 49.4% Never married39.8% Now married1.2% Separated1.0% Widowed8.5% DivorcedFemales 47.0% Never married37.6% Now married0.5% Separated3.3% Widowed11.6% DivorcedWomen who gave birth in the past 12 months Now married:
100.0% (66)Unmarried:
0.0% (0)
Women who did not give birth in the past 12 months Now married:
27.8% (4,352)Unmarried:
72.2% (11,286)
Marital status - Black or African American population 15 years and over
Males 48.0% Never married30.6% Now married0.3% Separated6.0% Widowed15.1% DivorcedFemales 56.2% Never married22.6% Now married9.1% Separated7.3% Widowed4.7% DivorcedWomen who gave birth in the past 12 months Now married:
2.5% (1)Unmarried:
97.5% (38)
Women who did not give birth in the past 12 months Now married:
17.7% (400)Unmarried:
82.3% (1,855)
Marital status - American Indian / Alaska Native population 15 years and over
Males 58.6% Never married27.9% Now married2.5% Separated2.0% Widowed9.0% DivorcedFemales 63.2% Never married24.4% Now married4.1% Separated0.0% Widowed8.2% DivorcedWomen who gave birth in the past 12 months Now married:
45.5% (8)Unmarried:
54.5% (10)
Women who did not give birth in the past 12 months Now married:
27.5% (78)Unmarried:
72.5% (205)
Marital status - Asian population 15 years and over
Males 73.1% Never married23.3% Now married0.3% Separated0.3% Widowed3.0% DivorcedFemales 68.8% Never married23.1% Now married1.7% Separated2.4% Widowed3.9% DivorcedWomen who gave birth in the past 12 months Now married:
100.0% (75)Unmarried:
0.0% (0)
Women who did not give birth in the past 12 months Now married:
16.7% (1,969)Unmarried:
83.3% (9,830)
Marital status - Native Hawaiian / Pacific Islander population 15 years and over
Males 51.5% Never married22.3% Now married1.7% Separated24.5% Widowed0.0% DivorcedFemales 70.7% Never married27.3% Now married0.0% Separated0.0% Widowed2.1% DivorcedWomen who did not give birth in the past 12 months Now married:
15.4% (41)Unmarried:
84.6% (222)
Marital status - Other race population 15 years and over
Males 57.6% Never married34.5% Now married0.9% Separated0.3% Widowed6.6% DivorcedFemales 67.9% Never married27.5% Now married0.0% Separated1.2% Widowed3.5% DivorcedWomen who gave birth in the past 12 months Now married:
63.6% (16)Unmarried:
36.4% (9)
Women who did not give birth in the past 12 months Now married:
21.9% (461)Unmarried:
78.1% (1,641)
Marital status - Two or more races population 15 years and over
Males 68.1% Never married28.2% Now married0.0% Separated0.0% Widowed3.7% DivorcedFemales 72.7% Never married16.0% Now married0.0% Separated5.5% Widowed5.8% DivorcedWomen who gave birth in the past 12 months Now married:
46.3% (74)Unmarried:
53.7% (86)
Women who did not give birth in the past 12 months Now married:
15.2% (1,318)Unmarried:
84.8% (7,372)
Marital status - White alone, not Hispanic / Latino population 15 years and over
Males 49.5% Never married38.9% Now married1.3% Separated1.1% Widowed9.1% DivorcedFemales 46.8% Never married37.0% Now married0.3% Separated3.7% Widowed12.2% DivorcedWomen who gave birth in the past 12 months Now married:
100.0% (78)Unmarried:
0.0% (0)
Women who did not give birth in the past 12 months Now married:
25.5% (4,053)Unmarried:
74.5% (11,851)
Marital status - Hispanic or Latino population 15 years and over
Males 53.2% Never married39.7% Now married2.3% Separated0.0% Widowed4.8% DivorcedFemales 59.5% Never married33.3% Now married1.1% Separated0.9% Widowed5.2% DivorcedWomen who gave birth in the past 12 months Now married:
100.0% (103)Unmarried:
0.0% (0)
Women who did not give birth in the past 12 months Now married:
26.2% (1,459)Unmarried:
73.8% (4,112)
Ancestries in Berkeley
4,050 6.8% European2,364 3.9% English1,854 3.1% Irish1,730 2.9% German1,498 2.5% American1,246 2.1% Italian1,116 1.9% Eastern European1,070 1.8% Iranian676 1.1% Northern European635 1.1% British576 1.0% Polish571 1.0% Russian478 0.8% French395 0.7% Scottish340 0.6% African326 0.5% Turkish289 0.5% Greek236 0.4% Dutch210 0.4% Armenian199 0.3% Ukrainian185 0.3% Scandinavian181 0.3% Swedish173 0.3% Lebanese161 0.3% Scotch-Irish157 0.3% Brazilian156 0.3% French Canadian141 0.2% Norwegian137 0.2% Swiss124 0.2% Hungarian117 0.2% Kenyan114 0.2% Ethiopian114 0.2% Romanian108 0.2% Canadian106 0.2% Palestinian95 0.2% Danish94 0.2% Portuguese92 0.2% Egyptian85 0.1% Afghan84 0.1% Finnish81 0.1% Jamaican79 0.1% Albanian75 0.1% Israeli74 0.1% Lithuanian72 0.1% South African71 0.1% Austrian68 0.1% Nigerian67 0.1% Arab66 0.1% Croatian59 0.10% Haitian56 0.09% Serbian53 0.09% Zimbabwean51 0.09% Barbadian50 0.08% Welsh48 0.08% Czech48 0.08% Czechoslovakian43 0.07% Ugandan35 0.06% Latvian35 0.06% Bulgarian31 0.05% Belizean26 0.04% Estonian26 0.04% Basque25 0.04% Belgian22 0.04% Australian21 0.04% Iraqi21 0.04% Slovak21 0.04% Yugoslavian19 0.03% Slavic18 0.03% Liberian18 0.03% Senegalese18 0.03% Guyanese17 0.03% Jordanian16 0.03% Ghanaian13 0.02% Luxembourger11 0.02% Trinidadian and Tobagonian10 0.02% Slovene9 0.02% Moroccan9 0.02% Sierra Leonean8 0.01% New Zealander7 0.01% Assyrian6 0.01% West Indian4 0.01% Cape Verdean
Geographical mobility in Berkeley Same house 1 year ago 45,647 77.5% White (Caucasian)5,938 81.4% Black or African American614 70.2% American Indian / Alaska Native17,502 61.9% Asian149 25.8% Native Hawaiian / Pacific Islander3,172 70.3% Other race19,830 78.6% Two or more races47,715 78.0% White alone, not Hispanic / Latino10,203 72.5% Hispanic or LatinoMoved within same county 6,234 10.6% White / Caucasian643 8.8% Black or African American117 13.4% American Indian / Alaska Native3,808 13.5% Asian255 44.1% Native Hawaiian / Pacific Islander510 11.3% Other race1,963 7.8% Two or more races5,104 8.3% White alone, not Hispanic / Latino1,371 9.7% Hispanic or LatinoMoved within same state 4,401 7.5% White / Caucasian695 9.5% Black or African American99 11.4% American Indian / Alaska Native4,113 14.5% Asian109 18.8% Native Hawaiian / Pacific Islander274 6.1% Other race1,584 6.3% Two or more races4,991 8.2% White alone, not Hispanic / Latino1,745 12.4% Hispanic or LatinoMoved from different state 1,608 2.7% White / Caucasian3 0.3% American Indian / Alaska Native1,154 4.1% Asian8 1.4% Native Hawaiian / Pacific Islander398 8.8% Other race562 2.2% Two or more races1,911 3.1% White alone, not Hispanic / Latino326 2.3% Hispanic or LatinoMoved from abroad 781 1.3% White34 3.9% American Indian / Alaska Native1,486 5.3% Asian46 7.9% Native Hawaiian / Pacific Islander65 1.4% Other race289 1.1% Two or more races1,032 1.7% White alone, not Hispanic / Latino269 1.9% Hispanic or Latino
Children Nativity (place of birth) in Berkeley
Children under 6 years - Living with two parents Both parents native 1,838 100.0% NativeBoth parents foreign-born 606 94.9% Native33 5.1% Foreign-bornOne native, one foreign-born parent 1,429 100.0% NativeChildren under 6 years - Living with one parent Native parent 669 99.9% Native0 0.1% Foreign-bornForeign-born parent 24 100.0% Foreign-bornChildren 6 to 17 years - Living with two parents Both parents native 3,527 98.8% Native45 1.2% Foreign-bornBoth parents foreign-born 374 75.1% Native124 24.9% Foreign-bornOne native, one foreign-born parent 1,447 100.0% NativeChildren 6 to 17 years - Living with one parent Native parent 2,092 100.0% NativeForeign-born parent 593 50.0% Native593 50.0% Foreign-born
Place of birth for residents in Berkeley 14,488 Asia7,923 Eastern Asia5,647 China5,100 Americas5,023 Europe4,161 Latin America3,571 South Central Asia2,510 Central America2,052 South Eastern Asia1,855 Western Europe1,472 South America1,316 Northern Europe1,045 Eastern Europe938 Northern America904 Africa868 Western Asia791 Southern Europe550 Eastern Africa415 Oceania220 Australia and New Zealand Subregion178 Caribbean117 Southern Africa115 Northern Africa84 Western Africa29 Middle Africa4,360 China2,183 India1,890 Mexico1,469 Korea938 Canada816 Germany788 Japan777 Taiwan667 France663 Iran622 Philippines533 United Kingdom509 Hong Kong430 Brazil402 Vietnam351 Pakistan343 Italy323 England307 Turkey282 Indonesia267 Peru264 Malaysia264 Russia263 Guatemala260 Argentina252 Thailand235 Chile221 Greece219 Nepal207 Spain181 Israel177 Australia174 Colombia173 Ireland164 Ethiopia158 Kenya155 Netherlands153 Poland147 El Salvador131 Singapore118 Switzerland117 South Africa114 Zimbabwe111 Fiji103 Lebanon101 Sweden88 Ukraine88 Romania84 Hungary76 Belize63 Armenia62 Scotland58 Belarus51 Bangladesh49 Belgium48 Afghanistan43 Costa Rica43 New Zealand43 Saudi Arabia42 Cuba40 Norway40 Lithuania39 Egypt38 Austria38 Nigeria35 Venezuela34 Burma34 Czechoslovakia33 Uzbekistan32 Honduras31 Uganda31 Cambodia30 Laos30 Haiti29 Panama28 Jamaica28 Barbados28 Ecuador27 Croatia27 Nicaragua23 Morocco22 Eritrea19 Moldova19 Sri Lanka19 Kuwait19 Democratic Republic of Congo (Zaire)18 Bulgaria18 Portugal15 Dominican Republic13 Denmark13 Yemen12 Grenada12 Bolivia11 Bahamas10 Trinidad and Tobago10 Senegal10 Ghana10 Albania10 Latvia9 Serbia8 Bosnia and Herzegovina8 Uruguay7 Sierra Leone4 Iraq4 North Macedonia (Macedonia)
Grandparents responsible for own grandchildren in Berkeley
Grandparents (30 to 59 years) White / Caucasian 5 10.8% Responsible for grandchildren39 89.2% Not responsible for grandchildrenBlack or African American 18 32.9% Responsible for grandchildren37 67.1% Not responsible for grandchildrenOther race 4 27.0% Responsible for grandchildren11 73.0% Not responsible for grandchildrenTwo or more races 103 100.0% Not responsible for grandchildrenWhite alone, not Hispanic / Latino 4 12.6% Responsible for grandchildren25 87.4% Not responsible for grandchildrenHispanic or Latino 3 6.0% Responsible for grandchildren50 94.0% Not responsible for grandchildrenGrandparents (60 years and over) White / Caucasian 49 41.2% Responsible for grandchildren69 58.8% Not responsible for grandchildrenBlack or African American 152 55.7% Responsible for grandchildren121 44.3% Not responsible for grandchildrenOther race 53 37.4% Responsible for grandchildren88 62.6% Not responsible for grandchildrenTwo or more races 56 100.0% Responsible for grandchildrenWhite alone, not Hispanic / Latino 42 26.0% Responsible for grandchildren120 74.0% Not responsible for grandchildrenHispanic or Latino 59 48.8% Responsible for grandchildren62 51.2% Not responsible for grandchildren