Races in Bethany, Oklahoma (OK) Detailed Stats
Data:
Races - White alone (%)
Races - White alone (% change since 2000)
Races - Black alone (%)
Races - Black alone (% change since 2000)
Races - American Indian alone (%)
Races - American Indian alone (% change since 2000)
Races - Asian alone (%)
Races - Asian alone (% change since 2000)
Races - Hispanic (%)
Races - Hispanic (% change since 2000)
Races - Native Hawaiian and Other Pacific Islander alone (%)
Races - Native Hawaiian and Other Pacific Islander alone (% change since 2000)
Races - Two or more races(%)
Races - Two or more races(% change since 2000)
Races - Other race alone (%)
Races - Other race alone (% change since 2000)
Racial diversity
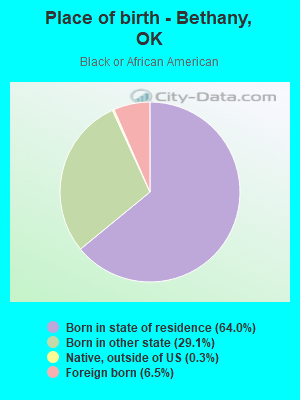
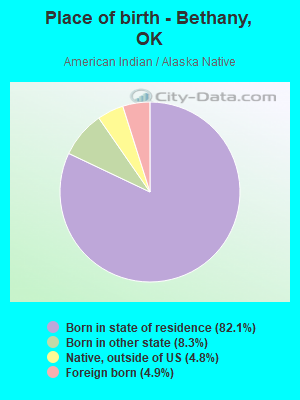
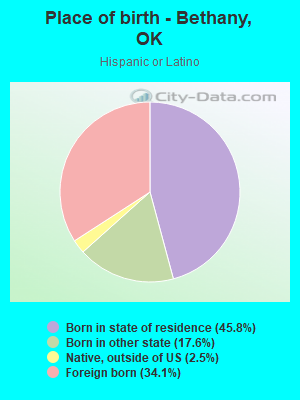
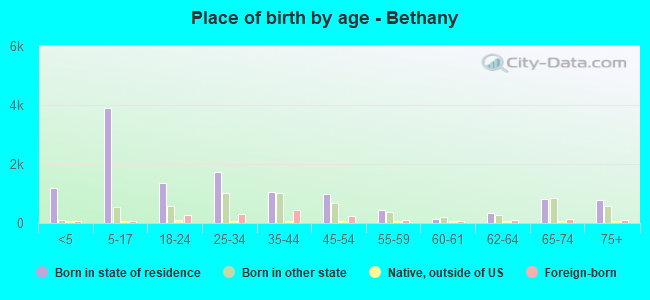
Place of birth - Born in state of residence (%)
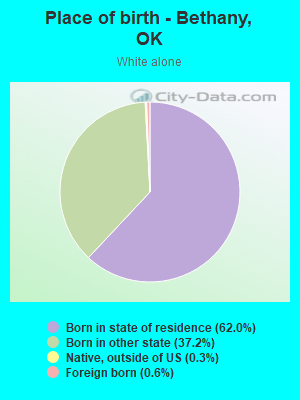
Place of birth - Born in state of residence (%) - White
Place of birth - Born in state of residence (%) - Black or African American
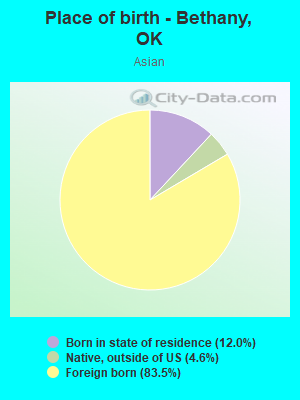
Place of birth - Born in state of residence (%) - Asian
Place of birth - Born in state of residence (%) - Hispanic or Latino
Place of birth - Born in state of residence (%) - American Indian and Alaska Native
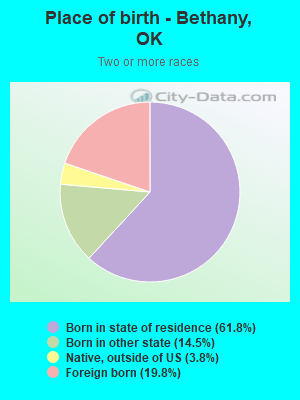
Place of birth - Born in state of residence (%) - Multirace
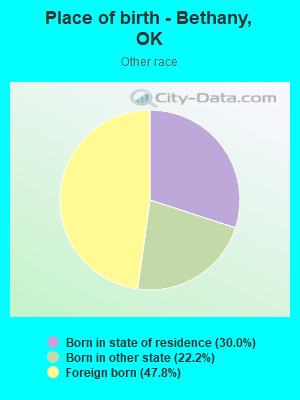
Place of birth - Born in state of residence (%) - Other Race
Place of birth - Born in other state (%)
Place of birth - Born in other state (%) - White
Place of birth - Born in other state (%) - Black or African American
Place of birth - Born in other state (%) - Asian
Place of birth - Born in other state (%) - Hispanic or Latino
Place of birth - Born in other state (%) - American Indian and Alaska Native
Place of birth - Born in other state (%) - Multirace
Place of birth - Born in other state (%) - Other Race
Place of birth - Native, outside of US (%)
Place of birth - Native, outside of US (%) - White
Place of birth - Native, outside of US (%) - Black or African American
Place of birth - Native, outside of US (%) - Asian
Place of birth - Native, outside of US (%) - Hispanic or Latino
Place of birth - Native, outside of US (%) - American Indian and Alaska Native
Place of birth - Native, outside of US (%) - Multirace
Place of birth - Native, outside of US (%) - Other Race
Place of birth - Foreign born (%)
Place of birth - Foreign born (%) - White
Place of birth - Foreign born (%) - Black or African American
Place of birth - Foreign born (%) - Asian
Place of birth - Foreign born (%) - Hispanic or Latino
Place of birth - Foreign born (%) - American Indian and Alaska Native
Place of birth - Foreign born (%) - Multirace
Place of birth - Foreign born (%) - Other Race
Residents speaking English at home (%)
Residents speaking English at home - Born in the United States (%)
Residents speaking English at home - Native, born elsewhere (%)
Residents speaking English at home - Foreign born (%)
Residents speaking Spanish at home (%)
Residents speaking Spanish at home - Born in the United States (%)
Residents speaking Spanish at home - Native, born elsewhere (%)
Residents speaking Spanish at home - Foreign born (%)
Residents speaking other language at home (%)
Residents speaking other language at home - Born in the United States (%)
Residents speaking other language at home - Native, born elsewhere (%)
Residents speaking other language at home - Foreign born (%)
Marital status - Never married (%)
Marital status - Now married (%)
Marital status - Separated (%)
Marital status - Widowed (%)
Marital status - Divorced (%)
Ancestries Reported - Arab (%)
Ancestries Reported - Czech (%)
Ancestries Reported - Danish (%)
Ancestries Reported - Dutch (%)
Ancestries Reported - English (%)
Ancestries Reported - French (%)
Ancestries Reported - French Canadian (%)
Ancestries Reported - German (%)
Ancestries Reported - Greek (%)
Ancestries Reported - Hungarian (%)
Ancestries Reported - Irish (%)
Ancestries Reported - Italian (%)
Ancestries Reported - Lithuanian (%)
Ancestries Reported - Norwegian (%)
Ancestries Reported - Polish (%)
Ancestries Reported - Portuguese (%)
Ancestries Reported - Russian (%)
Ancestries Reported - Scotch-Irish (%)
Ancestries Reported - Scottish (%)
Ancestries Reported - Slovak (%)
Ancestries Reported - Subsaharan African (%)
Ancestries Reported - Swedish (%)
Ancestries Reported - Swiss (%)
Ancestries Reported - Ukrainian (%)
Ancestries Reported - United States (%)
Ancestries Reported - Welsh (%)
Ancestries Reported - West Indian (%)
Ancestries Reported - Other (%)
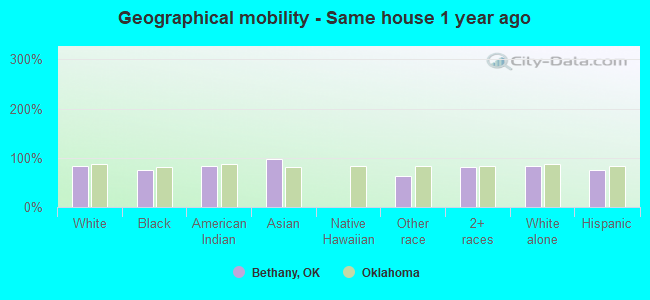
Geographical mobility - Same house 1 year ago (%)
Geographical mobility - Same house 1 year ago (%) - White
Geographical mobility - Same house 1 year ago (%) - Black or African American
Geographical mobility - Same house 1 year ago (%) - Asian
Geographical mobility - Same house 1 year ago (%) - Hispanic or Latino
Geographical mobility - Same house 1 year ago (%) - American Indian and Alaska Native
Geographical mobility - Same house 1 year ago (%) - Multirace
Geographical mobility - Same house 1 year ago (%) - Other Race
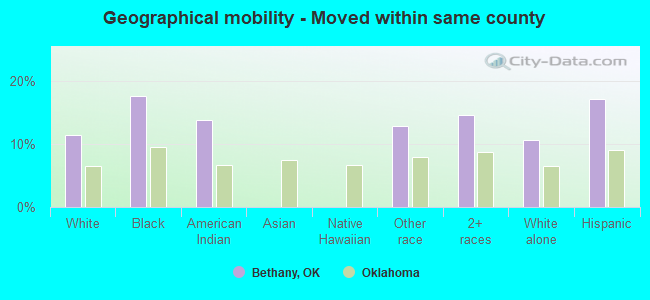
Geographical mobility - Moved within same county (%)
Geographical mobility - Moved within same county (%) - White
Geographical mobility - Moved within same county (%) - Black or African American
Geographical mobility - Moved within same county (%) - Asian
Geographical mobility - Moved within same county (%) - Hispanic or Latino
Geographical mobility - Moved within same county (%) - American Indian and Alaska Native
Geographical mobility - Moved within same county (%) - Multirace
Geographical mobility - Moved within same county (%) - Other Race
Geographical mobility - Moved from different county within same state (%)
Geographical mobility - Moved from different county within same state (%) - White
Geographical mobility - Moved from different county within same state (%) - Black or African American
Geographical mobility - Moved from different county within same state (%) - Asian
Geographical mobility - Moved from different county within same state (%) - Hispanic or Latino
Geographical mobility - Moved from different county within same state (%) - American Indian and Alaska Native
Geographical mobility - Moved from different county within same state (%) - Multirace
Geographical mobility - Moved from different county within same state (%) - Other Race
Geographical mobility - Moved from different state (%)
Geographical mobility - Moved from different state (%) - White
Geographical mobility - Moved from different state (%) - Black or African American
Geographical mobility - Moved from different state (%) - Asian
Geographical mobility - Moved from different state (%) - Hispanic or Latino
Geographical mobility - Moved from different state (%) - American Indian and Alaska Native
Geographical mobility - Moved from different state (%) - Multirace
Geographical mobility - Moved from different state (%) - Other Race
Geographical mobility - Moved from abroad (%)
Geographical mobility - Moved from abroad (%) - White
Geographical mobility - Moved from abroad (%) - Black or African American
Geographical mobility - Moved from abroad (%) - Asian
Geographical mobility - Moved from abroad (%) - Hispanic or Latino
Geographical mobility - Moved from abroad (%) - American Indian and Alaska Native
Geographical mobility - Moved from abroad (%) - Multirace
Geographical mobility - Moved from abroad (%) - Other Race
Place of birth for the foreign-born population - Ireland (%)
Place of birth for the foreign-born population - Denmark (%)
Place of birth for the foreign-born population - Norway (%)
Place of birth for the foreign-born population - Sweden (%)
Place of birth for the foreign-born population - United Kingdom (%)
Place of birth for the foreign-born population - England (%)
Place of birth for the foreign-born population - Scotland (%)
Place of birth for the foreign-born population - Other Northern Europe (%)
Place of birth for the foreign-born population - Austria (%)
Place of birth for the foreign-born population - Belgium (%)
Place of birth for the foreign-born population - France (%)
Place of birth for the foreign-born population - Germany (%)
Place of birth for the foreign-born population - Netherlands (%)
Place of birth for the foreign-born population - Switzerland (%)
Place of birth for the foreign-born population - Other Western Europe (%)
Place of birth for the foreign-born population - Greece (%)
Place of birth for the foreign-born population - Italy (%)
Place of birth for the foreign-born population - Portugal (%)
Place of birth for the foreign-born population - Spain (%)
Place of birth for the foreign-born population - Other Southern Europe (%)
Place of birth for the foreign-born population - Albania (%)
Place of birth for the foreign-born population - Belarus (%)
Place of birth for the foreign-born population - Bosnia and Herzegovina (%)
Place of birth for the foreign-born population - Bulgaria (%)
Place of birth for the foreign-born population - Croatia (%)
Place of birth for the foreign-born population - Czechoslovakia (%)
Place of birth for the foreign-born population - Hungary (%)
Place of birth for the foreign-born population - Latvia (%)
Place of birth for the foreign-born population - Lithuania (%)
Place of birth for the foreign-born population - North Macedonia (Macedonia) (%)
Place of birth for the foreign-born population - Moldova (%)
Place of birth for the foreign-born population - Poland (%)
Place of birth for the foreign-born population - Romania (%)
Place of birth for the foreign-born population - Russia (%)
Place of birth for the foreign-born population - Serbia (%)
Place of birth for the foreign-born population - Ukraine (%)
Place of birth for the foreign-born population - Other Eastern Europe (%)
Place of birth for the foreign-born population - China (%)
Place of birth for the foreign-born population - Hong Kong (%)
Place of birth for the foreign-born population - Taiwan (%)
Place of birth for the foreign-born population - Japan (%)
Place of birth for the foreign-born population - Korea (%)
Place of birth for the foreign-born population - Other Eastern Asia (%)
Place of birth for the foreign-born population - Afghanistan (%)
Place of birth for the foreign-born population - Bangladesh (%)
Place of birth for the foreign-born population - India (%)
Place of birth for the foreign-born population - Iran (%)
Place of birth for the foreign-born population - Kazakhstan (%)
Place of birth for the foreign-born population - Nepal (%)
Place of birth for the foreign-born population - Pakistan (%)
Place of birth for the foreign-born population - Sri Lanka (%)
Place of birth for the foreign-born population - Uzbekistan (%)
Place of birth for the foreign-born population - Other South Central Asia (%)
Place of birth for the foreign-born population - Burma (%)
Place of birth for the foreign-born population - Cambodia (%)
Place of birth for the foreign-born population - Indonesia (%)
Place of birth for the foreign-born population - Laos (%)
Place of birth for the foreign-born population - Malaysia (%)
Place of birth for the foreign-born population - Philippines (%)
Place of birth for the foreign-born population - Singapore (%)
Place of birth for the foreign-born population - Thailand (%)
Place of birth for the foreign-born population - Vietnam (%)
Place of birth for the foreign-born population - Other South Eastern Asia (%)
Place of birth for the foreign-born population - Armenia (%)
Place of birth for the foreign-born population - Iraq (%)
Place of birth for the foreign-born population - Israel (%)
Place of birth for the foreign-born population - Jordan (%)
Place of birth for the foreign-born population - Kuwait (%)
Place of birth for the foreign-born population - Lebanon (%)
Place of birth for the foreign-born population - Saudi Arabia (%)
Place of birth for the foreign-born population - Syria (%)
Place of birth for the foreign-born population - Turkey (%)
Place of birth for the foreign-born population - Yemen (%)
Place of birth for the foreign-born population - Other Western Asia (%)
Place of birth for the foreign-born population - Eritrea (%)
Place of birth for the foreign-born population - Ethiopia (%)
Place of birth for the foreign-born population - Kenya (%)
Place of birth for the foreign-born population - Somalia (%)
Place of birth for the foreign-born population - Uganda (%)
Place of birth for the foreign-born population - Zimbabwe (%)
Place of birth for the foreign-born population - Other Eastern Africa (%)
Place of birth for the foreign-born population - Cameroon (%)
Place of birth for the foreign-born population - Congo (%)
Place of birth for the foreign-born population - Democratic Republic of Congo (Zaire) (%)
Place of birth for the foreign-born population - Other Middle Africa (%)
Place of birth for the foreign-born population - Egypt (%)
Place of birth for the foreign-born population - Morocco (%)
Place of birth for the foreign-born population - Sudan (%)
Place of birth for the foreign-born population - Other Northern Africa (%)
Place of birth for the foreign-born population - South Africa (%)
Place of birth for the foreign-born population - Other Southern Africa (%)
Place of birth for the foreign-born population - Cabo Verde (%)
Place of birth for the foreign-born population - Ghana (%)
Place of birth for the foreign-born population - Liberia (%)
Place of birth for the foreign-born population - Nigeria (%)
Place of birth for the foreign-born population - Senegal (%)
Place of birth for the foreign-born population - Sierra Leone (%)
Place of birth for the foreign-born population - Other Western Africa (%)
Place of birth for the foreign-born population - Australia (%)
Place of birth for the foreign-born population - New Zealand (%)
Place of birth for the foreign-born population - Fiji (%)
Place of birth for the foreign-born population - Micronesia (%)
Place of birth for the foreign-born population - Bahamas (%)
Place of birth for the foreign-born population - Barbados (%)
Place of birth for the foreign-born population - Cuba (%)
Place of birth for the foreign-born population - Dominica (%)
Place of birth for the foreign-born population - Dominican Republic (%)
Place of birth for the foreign-born population - Grenada (%)
Place of birth for the foreign-born population - Haiti (%)
Place of birth for the foreign-born population - Jamaica (%)
Place of birth for the foreign-born population - St. Vincent and the Grenadines (%)
Place of birth for the foreign-born population - Trinidad and Tobago (%)
Place of birth for the foreign-born population - West Indies (%)
Place of birth for the foreign-born population - Other Caribbean (%)
Place of birth for the foreign-born population - Belize (%)
Place of birth for the foreign-born population - Costa Rica (%)
Place of birth for the foreign-born population - El Salvador (%)
Place of birth for the foreign-born population - Guatemala (%)
Place of birth for the foreign-born population - Honduras (%)
Place of birth for the foreign-born population - Mexico (%)
Place of birth for the foreign-born population - Nicaragua (%)
Place of birth for the foreign-born population - Panama (%)
Place of birth for the foreign-born population - Other Central America (%)
Place of birth for the foreign-born population - Argentina (%)
Place of birth for the foreign-born population - Bolivia (%)
Place of birth for the foreign-born population - Brazil (%)
Place of birth for the foreign-born population - Chile (%)
Place of birth for the foreign-born population - Colombia (%)
Place of birth for the foreign-born population - Ecuador (%)
Place of birth for the foreign-born population - Guyana (%)
Place of birth for the foreign-born population - Peru (%)
Place of birth for the foreign-born population - Uruguay (%)
Place of birth for the foreign-born population - Venezuela (%)
Place of birth for the foreign-born population - Other South America (%)
Place of birth for the foreign-born population - Canada (%)
Place of birth for the foreign-born population - Other Northern America (%)
Place of birth for the foreign-born population - Other (%)
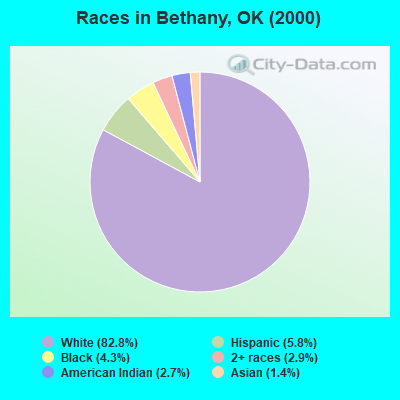
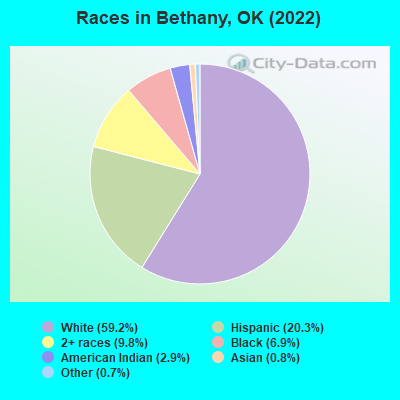
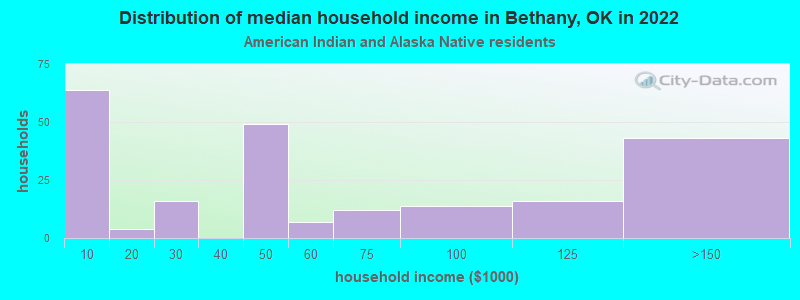
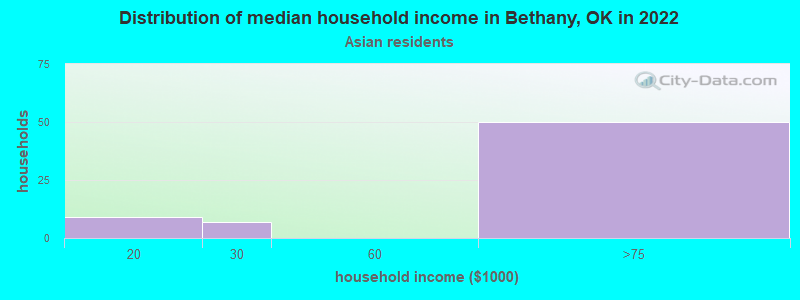
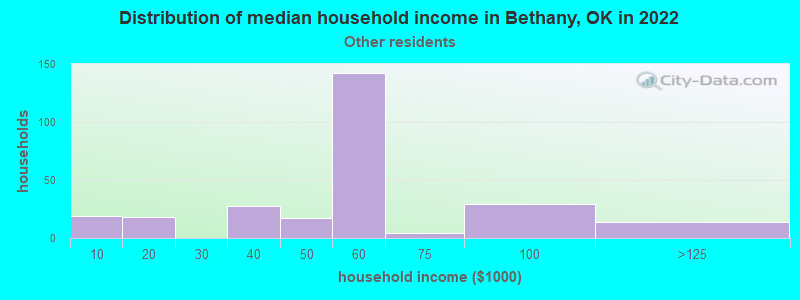
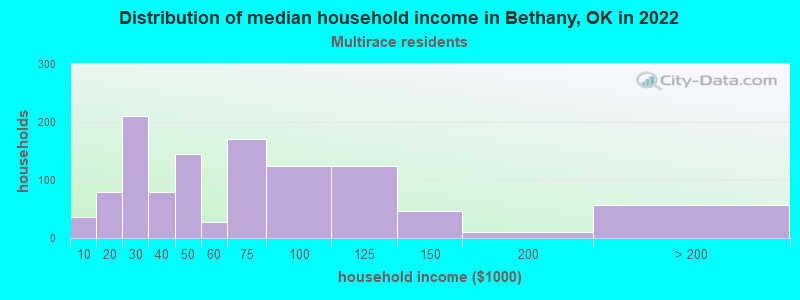
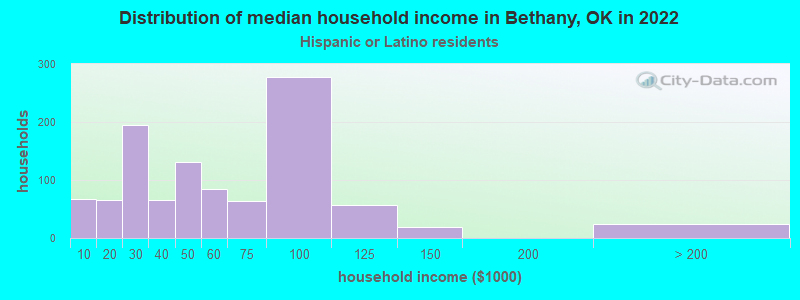
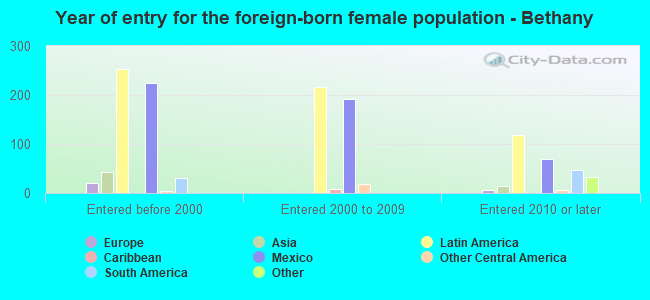
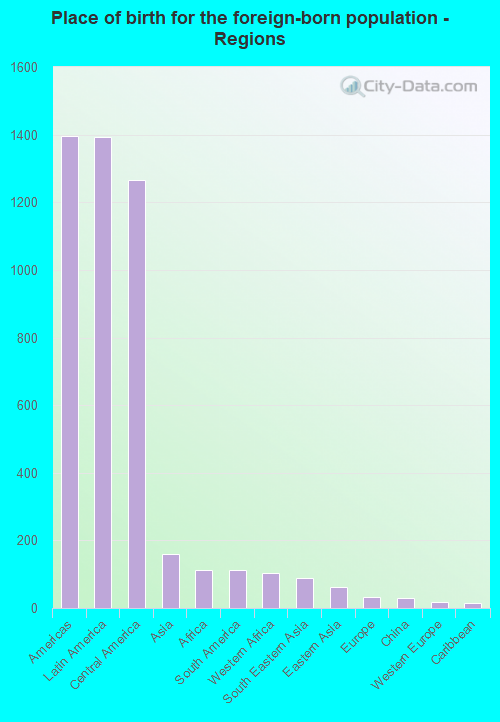
According to 2022 data, the most numerous races in Bethany, OK are White alone (12,305 residents), Hispanic (4,215 residents), and Two or more races (2,045 residents). 81.9% of Bethany residents speak English at home. 8.2% of Bethany, OK residents are foreign-born (6.8% born in Latin America), which is 26.7% greater than the foreign-born rate of 6.0% across the entire state of Oklahoma.
Race distribution in Bethany
2000 2022
2,556,368 74.1% White alone 266,158 7.7% American Indian alone 257,981 7.5% Black alone 179,304 5.2% Hispanic 140,249 4.1% Two or more races 46,172 1.3% Asian alone 2,322 0.07% Other race alone 2,100 0.06% Native Hawaiian and Other
2,517,403 62.6% White alone 486,692 12.1% Hispanic 364,453 9.1% Two or more races 273,650 6.8% American Indian alone 268,543 6.7% Black alone 92,672 2.3% Asian alone 10,786 0.3% Other race alone 5,601 0.1% Native Hawaiian and Other
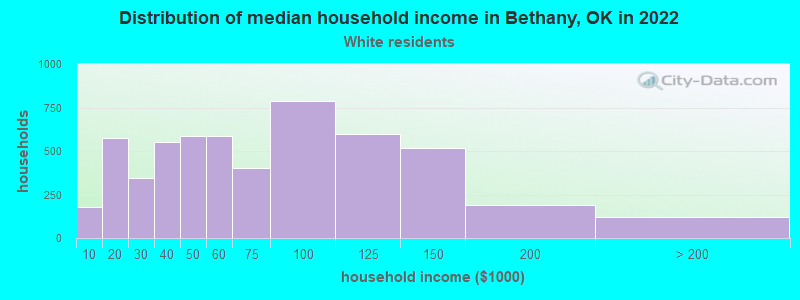
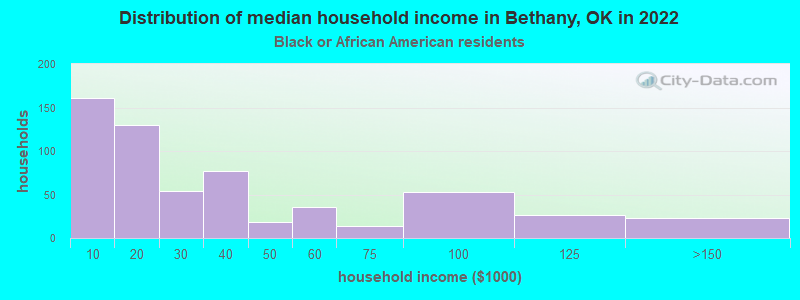
Income and house value in Bethany Median household income in 2022 $57,085 White non-Hispanic householders$24,825 Black householders$48,932 American Indian and Alaska Native householders$73,482 Asian householders$53,241 Some other race householders$59,539 Two or more races householders$50,977 Hispanic or Latino race householdersMedian 2022 house value $172,612 White Non-Hispanic householders$182,378 Black or African American householders$172,124 American Indian or Alaska Native householders $204,839 Asian householders$194,097 Some other race householders$167,973 Two or more races householders$162,358 Hispanic or Latino householders
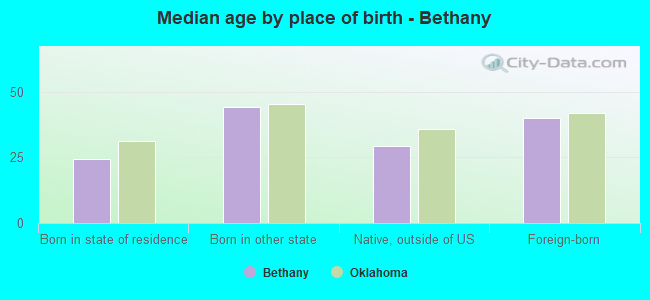
Median age by race in Bethany
36.2 Median age for White residents35.4 37.1 31.1 Median age for Black or African American residents32.8 30.1 34.8 Median age for American Indian / Alaska Native residents30.5 36.9 56.2 Median age for Asian residents52.9 67.9 -725,225,224.5 Median age for Native Hawaiian / Pacific Islander residents-675,324,674.6 -767,251,461.2 23.2 Median age for Other race residents22.7 33.4 22.6 Median age for Two or more races residents22.3 30.3 38.6 Median age for White alone residents37.9 39.0 21.2 Median age for Hispanic or Latino residents19.3 23.7
Owner/renter occupied households by race in Bethany
House owners and renters - White residents 3,380 62.1% Owner occupied2,067 37.9% Renter occupiedHouse owners and renters - Black or African American residents 46 6.8% Owner occupied628 93.2% Renter occupiedHouse owners and renters - American Indian / Alaska Native residents 48 19.5% Owner occupied197 80.5% Renter occupiedHouse owners and renters - Asian residents 52 100.0% Owner occupiedHouse owners and renters - Other race residents 106 34.6% Owner occupied201 65.4% Renter occupiedHouse owners and renters - Two or more races residents 444 40.8% Owner occupied645 59.2% Renter occupiedHouse owners and renters - White alone residents 3,251 61.3% Owner occupied2,053 38.7% Renter occupiedHouse owners and renters - Hispanic or Latino residents 470 45.7% Owner occupied557 54.3% Renter occupied
Language usage in Bethany
English speakers - Total 81.9% of residents of Bethany speak English at home.
16.2% of residents speak Spanish at home 2,139 67.7% Speak English very well1,022 32.3% Speak English less than very well1.8% of residents speak other language at home 189 54.0% Speak English very well161 46.0% Speak English less than very well
English speakers - Born in the United States 91.2% of residents of Bethany speak English at home.
8.5% of residents speak Spanish at home 441 84.5% Speak English very well81 15.5% Speak English less than very well0.1% of residents speak other language at home 3 33.3% Speak English very well6 66.7% Speak English less than very well
English speakers - Native, born elsewhere 50.2% of residents of Bethany speak English at home.
67.1% of residents speak Spanish at home 14 9.5% Speak English very well133 90.5% Speak English less than very well
English speakers - Foreign-born 7.9% of residents of Bethany speak English at home.
76.9% of residents speak Spanish at home 588 44.6% Speak English very well731 55.4% Speak English less than very well15.6% of residents speak other language at home 124 46.3% Speak English very well144 53.7% Speak English less than very well
White (Caucasian) - Speak only English Native:
94.4% (11,635)Foreign-born:
20.1% (47)
White (Caucasian) - Speak another language Native:
4.7% (585)Foreign-born:
97.1% (225)
Black or African American - Speak only English Native:
91.8% (1,186)Foreign-born:
7.4% (7)
Black or African American - Speak another language Native:
7.8% (100)Foreign-born:
99.8% (95)
American Indian / Alaska Native - Speak only English Native:
86.3% (624)Foreign-born:
100.0% (36)
Asian - Speak only English Native:
20.4% (5)Foreign-born:
5.4% (7)
Asian - Speak another language Native:
73.3% (18)Foreign-born:
96.4% (127)
Other race - Speak only English Native:
39.1% (243)Foreign-born:
6.4% (39)
Other race - Speak another language Native:
60.3% (375)Foreign-born:
93.8% (574)
Two or more races - Speak only English Native:
79.0% (2,320)Foreign-born:
1.6% (12)
Two or more races - Speak another language Native:
18.8% (552)Foreign-born:
100.0% (767)
White alone - Speak only English Native:
96.9% (11,318)Foreign-born:
55.0% (38)
White alone - Speak another language Native:
3.3% (384)Foreign-born:
45.5% (32)
Hispanic or Latino - Speak only English Native:
37.2% (833)Foreign-born:
8.8% (127)
Hispanic or Latino - Speak another language Native:
62.7% (1,403)Foreign-born:
92.0% (1,323)
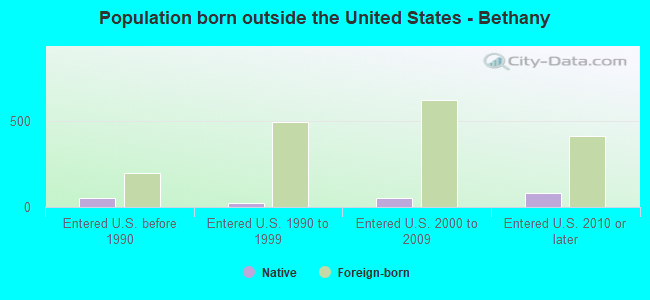
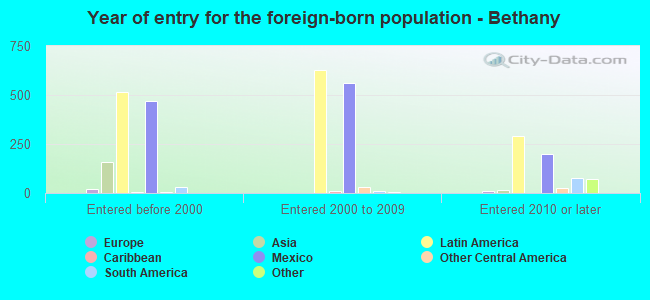
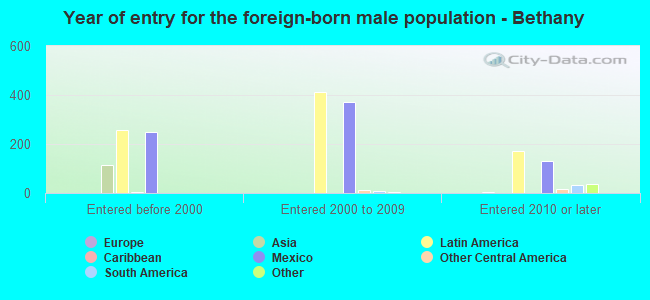
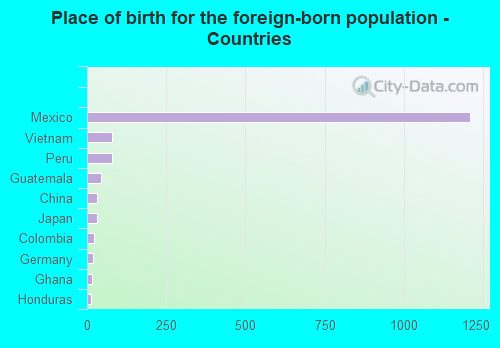
Foreign-born residents in Bethany 1,702 residents are foreign born (6.8% Latin America ).
This city:
8.2%Oklahoma:
6.1%
Marital status for residents in Bethany Marital status - White (Caucasian) population 15 years and over
Males 31.1% Never married47.6% Now married1.0% Separated3.9% Widowed16.5% DivorcedFemales 33.6% Never married42.3% Now married2.3% Separated7.6% Widowed14.2% DivorcedWomen who gave birth in the past 12 months Now married:
73.2% (124)Unmarried:
26.8% (45)
Women who did not give birth in the past 12 months Now married:
42.4% (1,334)Unmarried:
57.6% (1,809)
Marital status - Black or African American population 15 years and over
Males 34.9% Never married35.4% Now married1.2% Separated4.0% Widowed24.5% DivorcedFemales 43.4% Never married32.9% Now married2.9% Separated11.6% Widowed9.1% DivorcedWomen who gave birth in the past 12 months Now married:
0.0% (0)Unmarried:
100.0% (9)
Women who did not give birth in the past 12 months Now married:
38.2% (169)Unmarried:
61.8% (274)
Marital status - American Indian / Alaska Native population 15 years and over
Males 50.3% Never married26.7% Now married3.2% Separated0.0% Widowed19.8% DivorcedFemales 39.0% Never married28.7% Now married0.0% Separated13.4% Widowed18.9% DivorcedWomen who gave birth in the past 12 months Now married:
100.0% (9)Unmarried:
0.0% (0)
Women who did not give birth in the past 12 months Now married:
16.5% (26)Unmarried:
83.5% (132)
Marital status - Asian population 15 years and over
Males 91.1% Never married8.9% Now married0.0% Separated0.0% Widowed0.0% DivorcedFemales 0.0% Never married56.7% Now married0.0% Separated43.3% Widowed0.0% DivorcedWomen who did not give birth in the past 12 months Now married:
100.0% (17)Unmarried:
0.0% (0)
Marital status - Other race population 15 years and over
Males 14.3% Never married80.1% Now married0.0% Separated0.0% Widowed5.6% DivorcedFemales 19.8% Never married62.0% Now married0.0% Separated5.4% Widowed12.8% DivorcedWomen who gave birth in the past 12 months Now married:
100.0% (36)Unmarried:
0.0% (0)
Women who did not give birth in the past 12 months Now married:
48.1% (72)Unmarried:
51.9% (78)
Marital status - Two or more races population 15 years and over
Males 54.3% Never married30.4% Now married5.9% Separated0.0% Widowed9.3% DivorcedFemales 39.4% Never married37.8% Now married10.2% Separated1.5% Widowed11.2% DivorcedWomen who gave birth in the past 12 months Now married:
100.0% (20)Unmarried:
0.0% (0)
Women who did not give birth in the past 12 months Now married:
49.9% (454)Unmarried:
50.1% (456)
Marital status - White alone, not Hispanic / Latino population 15 years and over
Males 31.3% Never married46.8% Now married1.1% Separated2.9% Widowed17.9% DivorcedFemales 33.6% Never married41.0% Now married1.8% Separated8.2% Widowed15.5% DivorcedWomen who gave birth in the past 12 months Now married:
68.0% (66)Unmarried:
32.0% (31)
Women who did not give birth in the past 12 months Now married:
40.6% (1,223)Unmarried:
59.4% (1,793)
Marital status - Hispanic or Latino population 15 years and over
Males 35.0% Never married52.4% Now married4.1% Separated4.9% Widowed3.5% DivorcedFemales 30.3% Never married50.3% Now married9.4% Separated1.8% Widowed8.2% DivorcedWomen who gave birth in the past 12 months Now married:
78.0% (107)Unmarried:
22.0% (30)
Women who did not give birth in the past 12 months Now married:
55.6% (502)Unmarried:
44.4% (401)
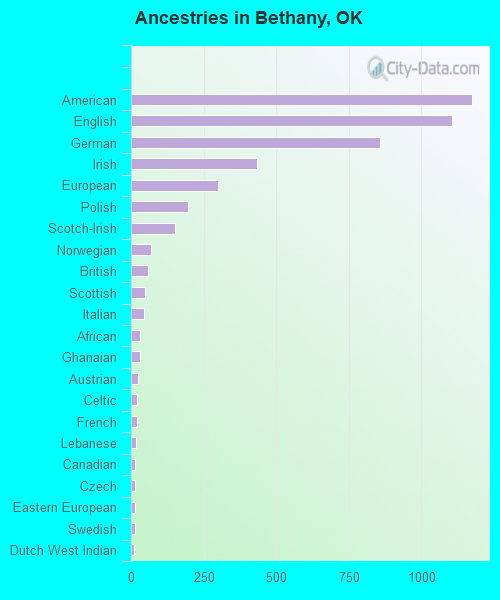
Ancestries in Bethany
1,174 11.8% American1,104 11.1% English859 8.6% German434 4.4% Irish301 3.0% European197 2.0% Polish153 1.5% Scotch-Irish68 0.7% Norwegian57 0.6% British49 0.5% Scottish46 0.5% Italian31 0.3% African30 0.3% Ghanaian24 0.2% Austrian22 0.2% Celtic22 0.2% French16 0.2% Lebanese14 0.1% Canadian13 0.1% Czech13 0.1% Eastern European13 0.1% Swedish11 0.1% Dutch West Indian9 0.09% Romanian5 0.05% Northern European5 0.05% Russian5 0.05% Nigerian5 0.05% Turkish4 0.04% Iranian4 0.04% Swiss3 0.03% Czechoslovakian3 0.03% Danish3 0.03% Slovak1 0.01% Dutch
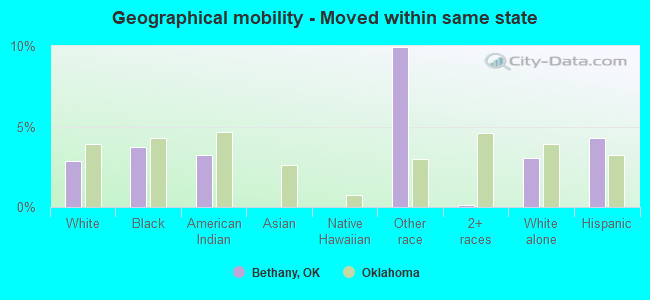
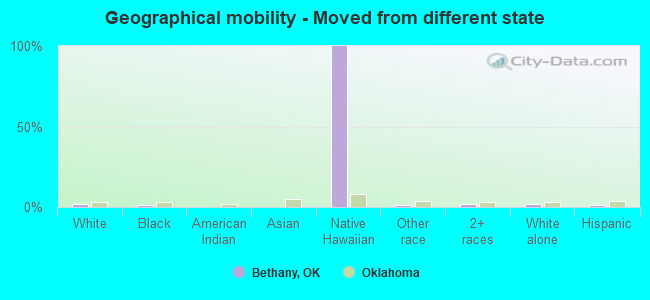
Geographical mobility in Bethany Same house 1 year ago 10,950 83.6% White (Caucasian)1,094 75.6% Black or African American633 82.6% American Indian / Alaska Native155 97.0% Asian799 63.5% Other race3,240 82.2% Two or more races10,310 84.3% White alone, not Hispanic / Latino3,079 74.9% Hispanic or LatinoMoved within same county 1,484 11.3% White / Caucasian253 17.5% Black or African American105 13.7% American Indian / Alaska Native161 12.8% Other race576 14.6% Two or more races1,291 10.6% White alone, not Hispanic / Latino700 17.0% Hispanic or LatinoMoved within same state 374 2.9% White / Caucasian54 3.7% Black or African American25 3.3% American Indian / Alaska Native125 10.0% Other race6 0.2% Two or more races371 3.0% White alone, not Hispanic / Latino176 4.3% Hispanic or LatinoMoved from different state 197 1.5% White / Caucasian15 1.0% Black or African American7 100.0% Native Hawaiian / Pacific Islander10 0.8% Other race73 1.8% Two or more races189 1.5% White alone, not Hispanic / Latino36 0.9% Hispanic or LatinoMoved from abroad 8 0.1% White67 5.3% Other race12 0.3% Two or more races15 0.1% White alone, not Hispanic / Latino45 1.1% Hispanic or Latino
Children Nativity (place of birth) in Bethany
Children under 6 years - Living with two parents Both parents native 713 100.0% NativeBoth parents foreign-born 76 100.0% NativeOne native, one foreign-born parent 253 100.0% NativeChildren under 6 years - Living with one parent Native parent 520 100.0% NativeForeign-born parent 36 100.0% NativeChildren 6 to 17 years - Living with two parents Both parents native 1,614 100.0% Native1 0.0% Foreign-bornBoth parents foreign-born 391 94.4% Native23 5.6% Foreign-bornOne native, one foreign-born parent 139 100.0% NativeChildren 6 to 17 years - Living with one parent Native parent 1,616 100.0% NativeForeign-born parent 213 59.8% Native143 40.2% Foreign-born
Grandparents responsible for own grandchildren in Bethany
Grandparents (30 to 59 years) White / Caucasian 35 33.7% Responsible for grandchildren69 66.3% Not responsible for grandchildrenOther race 23 66.5% Responsible for grandchildren12 33.5% Not responsible for grandchildrenTwo or more races 47 92.9% Responsible for grandchildren4 7.1% Not responsible for grandchildrenWhite alone, not Hispanic / Latino 42 31.0% Responsible for grandchildren94 69.0% Not responsible for grandchildrenHispanic or Latino 57 91.3% Responsible for grandchildren5 8.7% Not responsible for grandchildrenGrandparents (60 years and over) White / Caucasian 51 27.2% Responsible for grandchildren137 72.8% Not responsible for grandchildrenOther race 44 100.0% Not responsible for grandchildrenTwo or more races 11 100.0% Responsible for grandchildrenWhite alone, not Hispanic / Latino 49 24.9% Responsible for grandchildren149 75.1% Not responsible for grandchildrenHispanic or Latino 9 20.5% Responsible for grandchildren34 79.5% Not responsible for grandchildren