Races in Beverly Hills, California (CA) Detailed Stats
Data:
Races - White alone (%)
Races - White alone (% change since 2000)
Races - Black alone (%)
Races - Black alone (% change since 2000)
Races - American Indian alone (%)
Races - American Indian alone (% change since 2000)
Races - Asian alone (%)
Races - Asian alone (% change since 2000)
Races - Hispanic (%)
Races - Hispanic (% change since 2000)
Races - Native Hawaiian and Other Pacific Islander alone (%)
Races - Native Hawaiian and Other Pacific Islander alone (% change since 2000)
Races - Two or more races(%)
Races - Two or more races(% change since 2000)
Races - Other race alone (%)
Races - Other race alone (% change since 2000)
Racial diversity
Place of birth - Born in state of residence (%)
Place of birth - Born in state of residence (%) - White
Place of birth - Born in state of residence (%) - Black or African American
Place of birth - Born in state of residence (%) - Asian
Place of birth - Born in state of residence (%) - Hispanic or Latino
Place of birth - Born in state of residence (%) - American Indian and Alaska Native
Place of birth - Born in state of residence (%) - Multirace
Place of birth - Born in state of residence (%) - Other Race
Place of birth - Born in other state (%)
Place of birth - Born in other state (%) - White
Place of birth - Born in other state (%) - Black or African American
Place of birth - Born in other state (%) - Asian
Place of birth - Born in other state (%) - Hispanic or Latino
Place of birth - Born in other state (%) - American Indian and Alaska Native
Place of birth - Born in other state (%) - Multirace
Place of birth - Born in other state (%) - Other Race
Place of birth - Native, outside of US (%)
Place of birth - Native, outside of US (%) - White
Place of birth - Native, outside of US (%) - Black or African American
Place of birth - Native, outside of US (%) - Asian
Place of birth - Native, outside of US (%) - Hispanic or Latino
Place of birth - Native, outside of US (%) - American Indian and Alaska Native
Place of birth - Native, outside of US (%) - Multirace
Place of birth - Native, outside of US (%) - Other Race
Place of birth - Foreign born (%)
Place of birth - Foreign born (%) - White
Place of birth - Foreign born (%) - Black or African American
Place of birth - Foreign born (%) - Asian
Place of birth - Foreign born (%) - Hispanic or Latino
Place of birth - Foreign born (%) - American Indian and Alaska Native
Place of birth - Foreign born (%) - Multirace
Place of birth - Foreign born (%) - Other Race
Residents speaking English at home (%)
Residents speaking English at home - Born in the United States (%)
Residents speaking English at home - Native, born elsewhere (%)
Residents speaking English at home - Foreign born (%)
Residents speaking Spanish at home (%)
Residents speaking Spanish at home - Born in the United States (%)
Residents speaking Spanish at home - Native, born elsewhere (%)
Residents speaking Spanish at home - Foreign born (%)
Residents speaking other language at home (%)
Residents speaking other language at home - Born in the United States (%)
Residents speaking other language at home - Native, born elsewhere (%)
Residents speaking other language at home - Foreign born (%)
Marital status - Never married (%)
Marital status - Now married (%)
Marital status - Separated (%)
Marital status - Widowed (%)
Marital status - Divorced (%)
Ancestries Reported - Arab (%)
Ancestries Reported - Czech (%)
Ancestries Reported - Danish (%)
Ancestries Reported - Dutch (%)
Ancestries Reported - English (%)
Ancestries Reported - French (%)
Ancestries Reported - French Canadian (%)
Ancestries Reported - German (%)
Ancestries Reported - Greek (%)
Ancestries Reported - Hungarian (%)
Ancestries Reported - Irish (%)
Ancestries Reported - Italian (%)
Ancestries Reported - Lithuanian (%)
Ancestries Reported - Norwegian (%)
Ancestries Reported - Polish (%)
Ancestries Reported - Portuguese (%)
Ancestries Reported - Russian (%)
Ancestries Reported - Scotch-Irish (%)
Ancestries Reported - Scottish (%)
Ancestries Reported - Slovak (%)
Ancestries Reported - Subsaharan African (%)
Ancestries Reported - Swedish (%)
Ancestries Reported - Swiss (%)
Ancestries Reported - Ukrainian (%)
Ancestries Reported - United States (%)
Ancestries Reported - Welsh (%)
Ancestries Reported - West Indian (%)
Ancestries Reported - Other (%)
Geographical mobility - Same house 1 year ago (%)
Geographical mobility - Same house 1 year ago (%) - White
Geographical mobility - Same house 1 year ago (%) - Black or African American
Geographical mobility - Same house 1 year ago (%) - Asian
Geographical mobility - Same house 1 year ago (%) - Hispanic or Latino
Geographical mobility - Same house 1 year ago (%) - American Indian and Alaska Native
Geographical mobility - Same house 1 year ago (%) - Multirace
Geographical mobility - Same house 1 year ago (%) - Other Race
Geographical mobility - Moved within same county (%)
Geographical mobility - Moved within same county (%) - White
Geographical mobility - Moved within same county (%) - Black or African American
Geographical mobility - Moved within same county (%) - Asian
Geographical mobility - Moved within same county (%) - Hispanic or Latino
Geographical mobility - Moved within same county (%) - American Indian and Alaska Native
Geographical mobility - Moved within same county (%) - Multirace
Geographical mobility - Moved within same county (%) - Other Race
Geographical mobility - Moved from different county within same state (%)
Geographical mobility - Moved from different county within same state (%) - White
Geographical mobility - Moved from different county within same state (%) - Black or African American
Geographical mobility - Moved from different county within same state (%) - Asian
Geographical mobility - Moved from different county within same state (%) - Hispanic or Latino
Geographical mobility - Moved from different county within same state (%) - American Indian and Alaska Native
Geographical mobility - Moved from different county within same state (%) - Multirace
Geographical mobility - Moved from different county within same state (%) - Other Race
Geographical mobility - Moved from different state (%)
Geographical mobility - Moved from different state (%) - White
Geographical mobility - Moved from different state (%) - Black or African American
Geographical mobility - Moved from different state (%) - Asian
Geographical mobility - Moved from different state (%) - Hispanic or Latino
Geographical mobility - Moved from different state (%) - American Indian and Alaska Native
Geographical mobility - Moved from different state (%) - Multirace
Geographical mobility - Moved from different state (%) - Other Race
Geographical mobility - Moved from abroad (%)
Geographical mobility - Moved from abroad (%) - White
Geographical mobility - Moved from abroad (%) - Black or African American
Geographical mobility - Moved from abroad (%) - Asian
Geographical mobility - Moved from abroad (%) - Hispanic or Latino
Geographical mobility - Moved from abroad (%) - American Indian and Alaska Native
Geographical mobility - Moved from abroad (%) - Multirace
Geographical mobility - Moved from abroad (%) - Other Race
Place of birth for the foreign-born population - Ireland (%)
Place of birth for the foreign-born population - Denmark (%)
Place of birth for the foreign-born population - Norway (%)
Place of birth for the foreign-born population - Sweden (%)
Place of birth for the foreign-born population - United Kingdom (%)
Place of birth for the foreign-born population - England (%)
Place of birth for the foreign-born population - Scotland (%)
Place of birth for the foreign-born population - Other Northern Europe (%)
Place of birth for the foreign-born population - Austria (%)
Place of birth for the foreign-born population - Belgium (%)
Place of birth for the foreign-born population - France (%)
Place of birth for the foreign-born population - Germany (%)
Place of birth for the foreign-born population - Netherlands (%)
Place of birth for the foreign-born population - Switzerland (%)
Place of birth for the foreign-born population - Other Western Europe (%)
Place of birth for the foreign-born population - Greece (%)
Place of birth for the foreign-born population - Italy (%)
Place of birth for the foreign-born population - Portugal (%)
Place of birth for the foreign-born population - Spain (%)
Place of birth for the foreign-born population - Other Southern Europe (%)
Place of birth for the foreign-born population - Albania (%)
Place of birth for the foreign-born population - Belarus (%)
Place of birth for the foreign-born population - Bosnia and Herzegovina (%)
Place of birth for the foreign-born population - Bulgaria (%)
Place of birth for the foreign-born population - Croatia (%)
Place of birth for the foreign-born population - Czechoslovakia (%)
Place of birth for the foreign-born population - Hungary (%)
Place of birth for the foreign-born population - Latvia (%)
Place of birth for the foreign-born population - Lithuania (%)
Place of birth for the foreign-born population - North Macedonia (Macedonia) (%)
Place of birth for the foreign-born population - Moldova (%)
Place of birth for the foreign-born population - Poland (%)
Place of birth for the foreign-born population - Romania (%)
Place of birth for the foreign-born population - Russia (%)
Place of birth for the foreign-born population - Serbia (%)
Place of birth for the foreign-born population - Ukraine (%)
Place of birth for the foreign-born population - Other Eastern Europe (%)
Place of birth for the foreign-born population - China (%)
Place of birth for the foreign-born population - Hong Kong (%)
Place of birth for the foreign-born population - Taiwan (%)
Place of birth for the foreign-born population - Japan (%)
Place of birth for the foreign-born population - Korea (%)
Place of birth for the foreign-born population - Other Eastern Asia (%)
Place of birth for the foreign-born population - Afghanistan (%)
Place of birth for the foreign-born population - Bangladesh (%)
Place of birth for the foreign-born population - India (%)
Place of birth for the foreign-born population - Iran (%)
Place of birth for the foreign-born population - Kazakhstan (%)
Place of birth for the foreign-born population - Nepal (%)
Place of birth for the foreign-born population - Pakistan (%)
Place of birth for the foreign-born population - Sri Lanka (%)
Place of birth for the foreign-born population - Uzbekistan (%)
Place of birth for the foreign-born population - Other South Central Asia (%)
Place of birth for the foreign-born population - Burma (%)
Place of birth for the foreign-born population - Cambodia (%)
Place of birth for the foreign-born population - Indonesia (%)
Place of birth for the foreign-born population - Laos (%)
Place of birth for the foreign-born population - Malaysia (%)
Place of birth for the foreign-born population - Philippines (%)
Place of birth for the foreign-born population - Singapore (%)
Place of birth for the foreign-born population - Thailand (%)
Place of birth for the foreign-born population - Vietnam (%)
Place of birth for the foreign-born population - Other South Eastern Asia (%)
Place of birth for the foreign-born population - Armenia (%)
Place of birth for the foreign-born population - Iraq (%)
Place of birth for the foreign-born population - Israel (%)
Place of birth for the foreign-born population - Jordan (%)
Place of birth for the foreign-born population - Kuwait (%)
Place of birth for the foreign-born population - Lebanon (%)
Place of birth for the foreign-born population - Saudi Arabia (%)
Place of birth for the foreign-born population - Syria (%)
Place of birth for the foreign-born population - Turkey (%)
Place of birth for the foreign-born population - Yemen (%)
Place of birth for the foreign-born population - Other Western Asia (%)
Place of birth for the foreign-born population - Eritrea (%)
Place of birth for the foreign-born population - Ethiopia (%)
Place of birth for the foreign-born population - Kenya (%)
Place of birth for the foreign-born population - Somalia (%)
Place of birth for the foreign-born population - Uganda (%)
Place of birth for the foreign-born population - Zimbabwe (%)
Place of birth for the foreign-born population - Other Eastern Africa (%)
Place of birth for the foreign-born population - Cameroon (%)
Place of birth for the foreign-born population - Congo (%)
Place of birth for the foreign-born population - Democratic Republic of Congo (Zaire) (%)
Place of birth for the foreign-born population - Other Middle Africa (%)
Place of birth for the foreign-born population - Egypt (%)
Place of birth for the foreign-born population - Morocco (%)
Place of birth for the foreign-born population - Sudan (%)
Place of birth for the foreign-born population - Other Northern Africa (%)
Place of birth for the foreign-born population - South Africa (%)
Place of birth for the foreign-born population - Other Southern Africa (%)
Place of birth for the foreign-born population - Cabo Verde (%)
Place of birth for the foreign-born population - Ghana (%)
Place of birth for the foreign-born population - Liberia (%)
Place of birth for the foreign-born population - Nigeria (%)
Place of birth for the foreign-born population - Senegal (%)
Place of birth for the foreign-born population - Sierra Leone (%)
Place of birth for the foreign-born population - Other Western Africa (%)
Place of birth for the foreign-born population - Australia (%)
Place of birth for the foreign-born population - New Zealand (%)
Place of birth for the foreign-born population - Fiji (%)
Place of birth for the foreign-born population - Micronesia (%)
Place of birth for the foreign-born population - Bahamas (%)
Place of birth for the foreign-born population - Barbados (%)
Place of birth for the foreign-born population - Cuba (%)
Place of birth for the foreign-born population - Dominica (%)
Place of birth for the foreign-born population - Dominican Republic (%)
Place of birth for the foreign-born population - Grenada (%)
Place of birth for the foreign-born population - Haiti (%)
Place of birth for the foreign-born population - Jamaica (%)
Place of birth for the foreign-born population - St. Vincent and the Grenadines (%)
Place of birth for the foreign-born population - Trinidad and Tobago (%)
Place of birth for the foreign-born population - West Indies (%)
Place of birth for the foreign-born population - Other Caribbean (%)
Place of birth for the foreign-born population - Belize (%)
Place of birth for the foreign-born population - Costa Rica (%)
Place of birth for the foreign-born population - El Salvador (%)
Place of birth for the foreign-born population - Guatemala (%)
Place of birth for the foreign-born population - Honduras (%)
Place of birth for the foreign-born population - Mexico (%)
Place of birth for the foreign-born population - Nicaragua (%)
Place of birth for the foreign-born population - Panama (%)
Place of birth for the foreign-born population - Other Central America (%)
Place of birth for the foreign-born population - Argentina (%)
Place of birth for the foreign-born population - Bolivia (%)
Place of birth for the foreign-born population - Brazil (%)
Place of birth for the foreign-born population - Chile (%)
Place of birth for the foreign-born population - Colombia (%)
Place of birth for the foreign-born population - Ecuador (%)
Place of birth for the foreign-born population - Guyana (%)
Place of birth for the foreign-born population - Peru (%)
Place of birth for the foreign-born population - Uruguay (%)
Place of birth for the foreign-born population - Venezuela (%)
Place of birth for the foreign-born population - Other South America (%)
Place of birth for the foreign-born population - Canada (%)
Place of birth for the foreign-born population - Other Northern America (%)
Place of birth for the foreign-born population - Other (%)
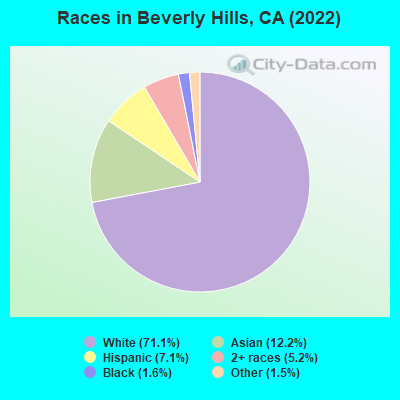
According to 2022 data, the most numerous races in Beverly Hills, CA are Hispanic (2,052 residents), White alone (24,794 residents), and Asian alone (3,239 residents). 58.3% of Beverly Hills residents speak English at home. 34.6% of Beverly Hills, CA residents are foreign-born (21.9% born in Asia, 5.7% born in Europe), which is 24.8% greater than the foreign-born rate of 26.0% across the entire state of California.
Race distribution in Beverly Hills
2000 2022
15,816,790 46.7% White alone 10,966,556 32.4% Hispanic 3,648,860 10.8% Asian alone 2,181,926 6.4% Black alone 903,115 2.7% Two or more races 178,984 0.5% American Indian alone 103,736 0.3% Native Hawaiian and Other 71,681 0.2% Other race alone
15,732,184 40.3% Hispanic 13,160,426 33.7% White alone 5,957,867 15.3% Asian alone 2,025,218 5.2% Black alone 1,663,222 4.3% Two or more races 251,618 0.6% Other race alone 135,777 0.3% Native Hawaiian and Other 103,030 0.3% American Indian alone
Income and house value in Beverly Hills Median household income in 2022 $142,689 White non-Hispanic householders$169,238 Black householdersover $200,000 American Indian and Alaska Native householders$136,128 Asian householders$39,832 Native Hawaiian and other Pacific Islander householders$93,942 Some other race householders$95,564 Two or more races householders$112,580 Hispanic or Latino race householdersMedian 2022 house value over $1,000,000 White Non-Hispanic householdersover $1,000,000 Black or African American householders$850,873 American Indian or Alaska Native householders over $1,000,000 Asian householdersover $1,000,000 Some other race householdersover $1,000,000 Two or more races householdersover $1,000,000 Hispanic or Latino householders
Median age by race in Beverly Hills
50.1 Median age for White residents48.6 51.2 36.5 Median age for Black or African American residents41.6 35.9 64.8 Median age for American Indian / Alaska Native residents39.1 Median age for Asian residents39.0 40.3 59.8 Median age for Native Hawaiian / Pacific Islander residents33.3 Median age for Other race residents34.1 29.1 35.4 Median age for Two or more races residents16.9 43.0 48.5 Median age for White alone residents47.0 49.6 32.8 Median age for Hispanic or Latino residents29.0 39.5
Owner/renter occupied households by race in Beverly Hills
House owners and renters - White residents 4,875 44.4% Owner occupied6,103 55.6% Renter occupiedHouse owners and renters - Black or African American residents 33 10.9% Owner occupied272 89.1% Renter occupiedHouse owners and renters - American Indian / Alaska Native residents 26 40.6% Owner occupied38 59.4% Renter occupiedHouse owners and renters - Asian residents 480 36.0% Owner occupied852 64.0% Renter occupiedHouse owners and renters - Other race residents 27 10.3% Owner occupied232 89.7% Renter occupiedHouse owners and renters - Two or more races residents 531 43.9% Owner occupied678 56.1% Renter occupiedHouse owners and renters - White alone residents 5,051 44.1% Owner occupied6,394 55.9% Renter occupiedHouse owners and renters - Hispanic or Latino residents 117 13.9% Owner occupied720 86.1% Renter occupied
Language usage in Beverly Hills
English speakers - Total 58.3% of residents of Beverly Hills speak English at home.
6.2% of residents speak Spanish at home 1,733 84.8% Speak English very well310 15.2% Speak English less than very well36.3% of residents speak other language at home 8,320 69.1% Speak English very well3,721 30.9% Speak English less than very well
English speakers - Born in the United States 85.7% of residents of Beverly Hills speak English at home.
4.1% of residents speak Spanish at home 297 96.1% Speak English very well12 3.9% Speak English less than very well10.7% of residents speak other language at home 711 88.8% Speak English very well90 11.2% Speak English less than very well
English speakers - Native, born elsewhere 46.1% of residents of Beverly Hills speak English at home.
18.0% of residents speak Spanish at home 152 100.0% Speak English very well34.8% of residents speak other language at home 188 64.2% Speak English very well105 35.8% Speak English less than very well
English speakers - Foreign-born 23.9% of residents of Beverly Hills speak English at home.
6.3% of residents speak Spanish at home 494 68.0% Speak English very well233 32.0% Speak English less than very well73.5% of residents speak other language at home 5,184 61.2% Speak English very well3,280 38.8% Speak English less than very well
White (Caucasian) - Speak only English Native:
85.2% (13,487)Foreign-born:
27.8% (1,632)
White (Caucasian) - Speak another language Native:
14.3% (2,270)Foreign-born:
74.7% (4,390)
Black or African American - Speak only English Native:
80.9% (349)Foreign-born:
19.6% (39)
Black or African American - Speak another language Native:
23.0% (99)Foreign-born:
83.9% (167)
Asian - Speak only English Native:
32.2% (432)Foreign-born:
27.0% (508)
Asian - Speak another language Native:
66.1% (888)Foreign-born:
74.7% (1,403)
Other race - Speak only English Native:
55.1% (199)Foreign-born:
17.4% (64)
Other race - Speak another language Native:
48.5% (175)Foreign-born:
85.8% (315)
Two or more races - Speak only English Native:
54.3% (1,447)Foreign-born:
12.1% (278)
Two or more races - Speak another language Native:
63.6% (1,693)Foreign-born:
85.5% (1,971)
White alone - Speak only English Native:
83.2% (13,395)Foreign-born:
21.1% (1,747)
White alone - Speak another language Native:
17.4% (2,802)Foreign-born:
79.1% (6,542)
Hispanic or Latino - Speak only English Native:
49.5% (666)Foreign-born:
12.8% (90)
Hispanic or Latino - Speak another language Native:
51.3% (690)Foreign-born:
88.8% (627)
Foreign-born residents in Beverly Hills 11,792 residents are foreign born (21.9% Asia , 5.7% Europe ).
This city:
34.6%California:
100.0%
Marital status for residents in Beverly Hills Marital status - White (Caucasian) population 15 years and over
Males 31.0% Never married57.1% Now married0.5% Separated2.0% Widowed9.5% DivorcedFemales 25.4% Never married47.1% Now married1.1% Separated12.9% Widowed13.5% DivorcedWomen who gave birth in the past 12 months Now married:
100.0% (84)Unmarried:
0.0% (0)
Women who did not give birth in the past 12 months Now married:
42.5% (1,977)Unmarried:
57.5% (2,676)
Marital status - Black or African American population 15 years and over
Males 42.7% Never married31.9% Now married6.1% Separated9.6% Widowed9.6% DivorcedFemales 40.0% Never married47.9% Now married0.0% Separated6.4% Widowed5.7% DivorcedWomen who gave birth in the past 12 months Now married:
100.0% (33)Unmarried:
0.0% (0)
Women who did not give birth in the past 12 months Now married:
45.8% (70)Unmarried:
54.2% (83)
Marital status - Asian population 15 years and over
Males 28.5% Never married61.4% Now married0.0% Separated2.3% Widowed7.9% DivorcedFemales 37.4% Never married37.0% Now married3.9% Separated9.9% Widowed11.9% DivorcedWomen who gave birth in the past 12 months Now married:
100.0% (14)Unmarried:
0.0% (0)
Women who did not give birth in the past 12 months Now married:
42.8% (428)Unmarried:
57.2% (571)
Marital status - Other race population 15 years and over
Males 46.9% Never married48.7% Now married0.0% Separated0.0% Widowed4.5% DivorcedFemales 66.9% Never married33.1% Now married0.0% Separated0.0% Widowed0.0% DivorcedWomen who gave birth in the past 12 months Now married:
0.0% (0)Unmarried:
100.0% (9)
Women who did not give birth in the past 12 months Now married:
34.0% (109)Unmarried:
66.0% (211)
Marital status - Two or more races population 15 years and over
Males 44.8% Never married44.8% Now married0.0% Separated0.0% Widowed10.5% DivorcedFemales 24.0% Never married71.1% Now married3.4% Separated0.0% Widowed1.5% DivorcedWomen who did not give birth in the past 12 months Now married:
71.8% (1,103)Unmarried:
28.2% (432)
Marital status - White alone, not Hispanic / Latino population 15 years and over
Males 29.5% Never married58.0% Now married0.6% Separated2.1% Widowed9.9% DivorcedFemales 24.2% Never married48.1% Now married1.0% Separated13.3% Widowed13.3% DivorcedWomen who gave birth in the past 12 months Now married:
100.0% (97)Unmarried:
0.0% (0)
Women who did not give birth in the past 12 months Now married:
44.5% (2,194)Unmarried:
55.5% (2,731)
Marital status - Hispanic or Latino population 15 years and over
Males 63.5% Never married35.0% Now married0.0% Separated0.0% Widowed1.5% DivorcedFemales 52.3% Never married31.0% Now married1.5% Separated3.7% Widowed11.5% DivorcedWomen who gave birth in the past 12 months Now married:
0.0% (0)Unmarried:
100.0% (8)
Women who did not give birth in the past 12 months Now married:
25.7% (216)Unmarried:
74.3% (624)
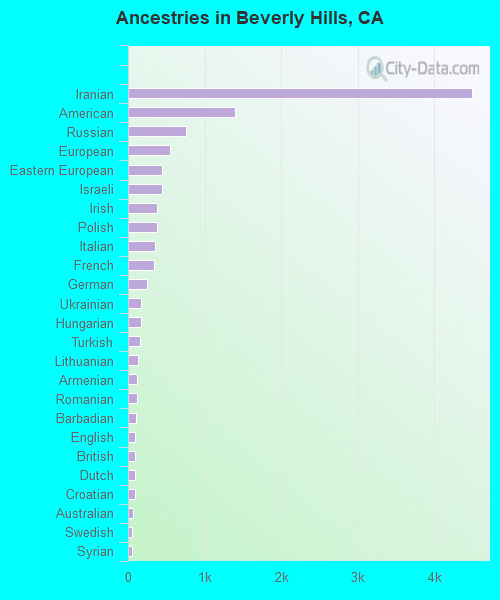
Ancestries in Beverly Hills
5,812 29.5% Iranian1,246 6.3% American904 4.6% Russian811 4.1% Eastern European614 3.1% European475 2.4% Italian445 2.3% Polish426 2.2% German321 1.6% English291 1.5% French259 1.3% Hungarian225 1.1% Lebanese205 1.0% Israeli181 0.9% Irish161 0.8% British140 0.7% Ukrainian130 0.7% Armenian108 0.5% Austrian86 0.4% Romanian85 0.4% Turkish76 0.4% Iraqi75 0.4% Jamaican73 0.4% Australian72 0.4% Swedish69 0.3% South African57 0.3% Czechoslovakian49 0.2% Greek45 0.2% French Canadian44 0.2% Brazilian43 0.2% Moroccan43 0.2% Canadian34 0.2% Norwegian33 0.2% Zimbabwean30 0.2% Belgian25 0.1% Dutch22 0.1% Scottish17 0.09% Syrian17 0.09% Danish13 0.07% Croatian11 0.06% Scandinavian10 0.05% Welsh9 0.05% Czech8 0.04% Lithuanian4 0.02% Latvian
Geographical mobility in Beverly Hills Same house 1 year ago 21,059 92.4% White (Caucasian)445 74.6% Black or African American94 100.0% American Indian / Alaska Native2,677 83.1% Asian393 52.7% Other race4,537 97.1% Two or more races23,096 92.1% White alone, not Hispanic / Latino1,626 79.3% Hispanic or LatinoMoved within same county 886 3.9% White / Caucasian86 14.5% Black or African American391 12.1% Asian157 21.1% Other race155 3.3% Two or more races997 4.0% White alone, not Hispanic / Latino238 11.6% Hispanic or LatinoMoved within same state 108 0.5% White / Caucasian10 0.3% Asian52 7.0% Other race60 1.3% Two or more races127 0.5% White alone, not Hispanic / Latino84 4.1% Hispanic or LatinoMoved from different state 514 2.3% White / Caucasian82 11.0% Other race24 0.5% Two or more races539 2.2% White alone, not Hispanic / Latino77 3.8% Hispanic or LatinoMoved from abroad 296 1.3% White66 11.1% Black or African American87 2.7% Asian30 0.6% Two or more races354 1.4% White alone, not Hispanic / Latino
Children Nativity (place of birth) in Beverly Hills
Children under 6 years - Living with two parents Both parents native 458 100.0% NativeBoth parents foreign-born 329 85.8% Native55 14.2% Foreign-bornOne native, one foreign-born parent 198 92.5% Native16 7.5% Foreign-bornChildren under 6 years - Living with one parent Native parent 82 100.0% NativeForeign-born parent 64 100.0% NativeChildren 6 to 17 years - Living with two parents Both parents native 1,327 100.0% NativeBoth parents foreign-born 1,542 78.0% Native435 22.0% Foreign-bornOne native, one foreign-born parent 750 93.4% Native53 6.6% Foreign-bornChildren 6 to 17 years - Living with one parent Native parent 799 100.0% NativeForeign-born parent 362 51.2% Native345 48.8% Foreign-born
Grandparents responsible for own grandchildren in Beverly Hills
Grandparents (30 to 59 years) White / Caucasian 52 100.0% Not responsible for grandchildrenOther race 23 100.0% Not responsible for grandchildrenWhite alone, not Hispanic / Latino 50 100.0% Not responsible for grandchildrenHispanic or Latino 22 100.0% Not responsible for grandchildrenGrandparents (60 years and over) White / Caucasian 8 20.0% Responsible for grandchildren33 80.0% Not responsible for grandchildrenWhite alone, not Hispanic / Latino 10 18.0% Responsible for grandchildren45 82.0% Not responsible for grandchildren