Races in Bozeman, Montana (MT) Detailed Stats
Data:
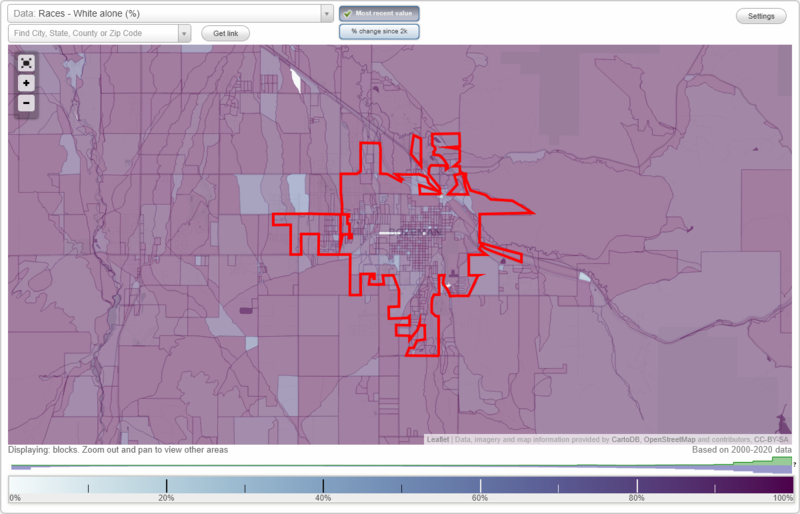
Races - White alone (%)
Races - White alone (% change since 2000)
Races - Black alone (%)
Races - Black alone (% change since 2000)
Races - American Indian alone (%)
Races - American Indian alone (% change since 2000)
Races - Asian alone (%)
Races - Asian alone (% change since 2000)
Races - Hispanic (%)
Races - Hispanic (% change since 2000)
Races - Native Hawaiian and Other Pacific Islander alone (%)
Races - Native Hawaiian and Other Pacific Islander alone (% change since 2000)
Races - Two or more races(%)
Races - Two or more races(% change since 2000)
Races - Other race alone (%)
Races - Other race alone (% change since 2000)
Racial diversity
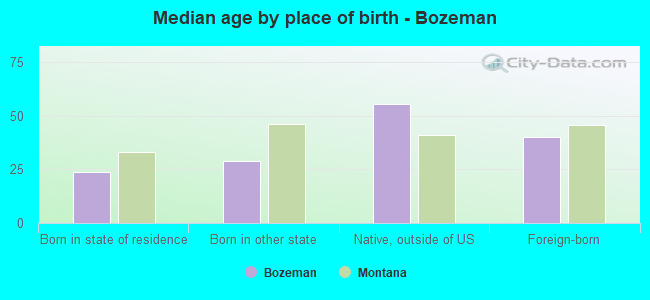
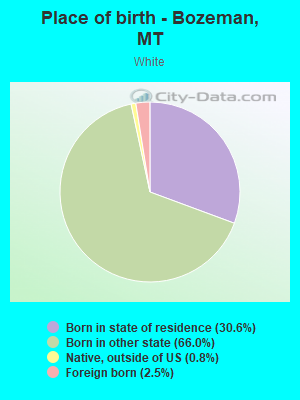
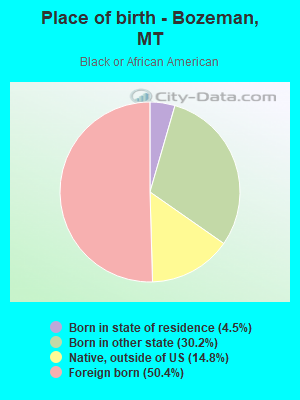
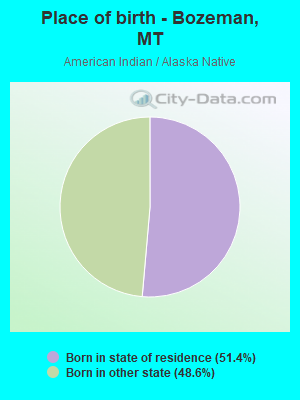
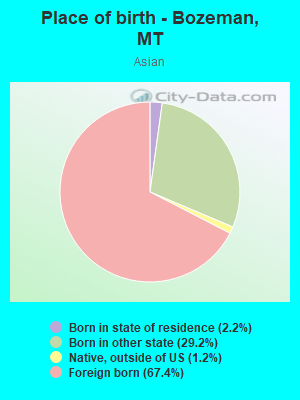
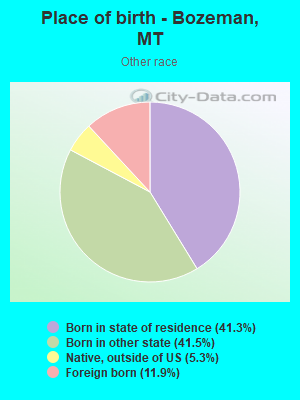
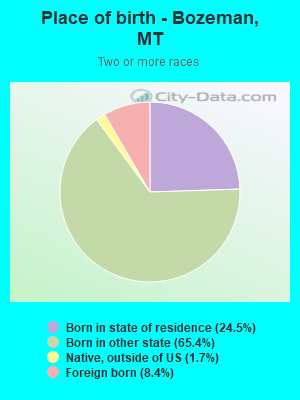
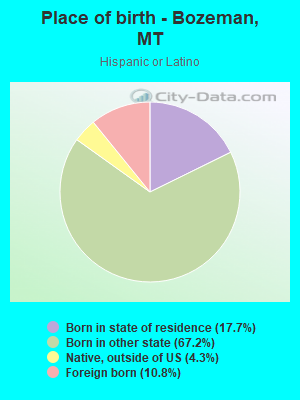
Place of birth - Born in state of residence (%)
Place of birth - Born in state of residence (%) - White
Place of birth - Born in state of residence (%) - Black or African American
Place of birth - Born in state of residence (%) - Asian
Place of birth - Born in state of residence (%) - Hispanic or Latino
Place of birth - Born in state of residence (%) - American Indian and Alaska Native
Place of birth - Born in state of residence (%) - Multirace
Place of birth - Born in state of residence (%) - Other Race
Place of birth - Born in other state (%)
Place of birth - Born in other state (%) - White
Place of birth - Born in other state (%) - Black or African American
Place of birth - Born in other state (%) - Asian
Place of birth - Born in other state (%) - Hispanic or Latino
Place of birth - Born in other state (%) - American Indian and Alaska Native
Place of birth - Born in other state (%) - Multirace
Place of birth - Born in other state (%) - Other Race
Place of birth - Native, outside of US (%)
Place of birth - Native, outside of US (%) - White
Place of birth - Native, outside of US (%) - Black or African American
Place of birth - Native, outside of US (%) - Asian
Place of birth - Native, outside of US (%) - Hispanic or Latino
Place of birth - Native, outside of US (%) - American Indian and Alaska Native
Place of birth - Native, outside of US (%) - Multirace
Place of birth - Native, outside of US (%) - Other Race
Place of birth - Foreign born (%)
Place of birth - Foreign born (%) - White
Place of birth - Foreign born (%) - Black or African American
Place of birth - Foreign born (%) - Asian
Place of birth - Foreign born (%) - Hispanic or Latino
Place of birth - Foreign born (%) - American Indian and Alaska Native
Place of birth - Foreign born (%) - Multirace
Place of birth - Foreign born (%) - Other Race
Residents speaking English at home (%)
Residents speaking English at home - Born in the United States (%)
Residents speaking English at home - Native, born elsewhere (%)
Residents speaking English at home - Foreign born (%)
Residents speaking Spanish at home (%)
Residents speaking Spanish at home - Born in the United States (%)
Residents speaking Spanish at home - Native, born elsewhere (%)
Residents speaking Spanish at home - Foreign born (%)
Residents speaking other language at home (%)
Residents speaking other language at home - Born in the United States (%)
Residents speaking other language at home - Native, born elsewhere (%)
Residents speaking other language at home - Foreign born (%)
Marital status - Never married (%)
Marital status - Now married (%)
Marital status - Separated (%)
Marital status - Widowed (%)
Marital status - Divorced (%)
Ancestries Reported - Arab (%)
Ancestries Reported - Czech (%)
Ancestries Reported - Danish (%)
Ancestries Reported - Dutch (%)
Ancestries Reported - English (%)
Ancestries Reported - French (%)
Ancestries Reported - French Canadian (%)
Ancestries Reported - German (%)
Ancestries Reported - Greek (%)
Ancestries Reported - Hungarian (%)
Ancestries Reported - Irish (%)
Ancestries Reported - Italian (%)
Ancestries Reported - Lithuanian (%)
Ancestries Reported - Norwegian (%)
Ancestries Reported - Polish (%)
Ancestries Reported - Portuguese (%)
Ancestries Reported - Russian (%)
Ancestries Reported - Scotch-Irish (%)
Ancestries Reported - Scottish (%)
Ancestries Reported - Slovak (%)
Ancestries Reported - Subsaharan African (%)
Ancestries Reported - Swedish (%)
Ancestries Reported - Swiss (%)
Ancestries Reported - Ukrainian (%)
Ancestries Reported - United States (%)
Ancestries Reported - Welsh (%)
Ancestries Reported - West Indian (%)
Ancestries Reported - Other (%)
Geographical mobility - Same house 1 year ago (%)
Geographical mobility - Same house 1 year ago (%) - White
Geographical mobility - Same house 1 year ago (%) - Black or African American
Geographical mobility - Same house 1 year ago (%) - Asian
Geographical mobility - Same house 1 year ago (%) - Hispanic or Latino
Geographical mobility - Same house 1 year ago (%) - American Indian and Alaska Native
Geographical mobility - Same house 1 year ago (%) - Multirace
Geographical mobility - Same house 1 year ago (%) - Other Race
Geographical mobility - Moved within same county (%)
Geographical mobility - Moved within same county (%) - White
Geographical mobility - Moved within same county (%) - Black or African American
Geographical mobility - Moved within same county (%) - Asian
Geographical mobility - Moved within same county (%) - Hispanic or Latino
Geographical mobility - Moved within same county (%) - American Indian and Alaska Native
Geographical mobility - Moved within same county (%) - Multirace
Geographical mobility - Moved within same county (%) - Other Race
Geographical mobility - Moved from different county within same state (%)
Geographical mobility - Moved from different county within same state (%) - White
Geographical mobility - Moved from different county within same state (%) - Black or African American
Geographical mobility - Moved from different county within same state (%) - Asian
Geographical mobility - Moved from different county within same state (%) - Hispanic or Latino
Geographical mobility - Moved from different county within same state (%) - American Indian and Alaska Native
Geographical mobility - Moved from different county within same state (%) - Multirace
Geographical mobility - Moved from different county within same state (%) - Other Race
Geographical mobility - Moved from different state (%)
Geographical mobility - Moved from different state (%) - White
Geographical mobility - Moved from different state (%) - Black or African American
Geographical mobility - Moved from different state (%) - Asian
Geographical mobility - Moved from different state (%) - Hispanic or Latino
Geographical mobility - Moved from different state (%) - American Indian and Alaska Native
Geographical mobility - Moved from different state (%) - Multirace
Geographical mobility - Moved from different state (%) - Other Race
Geographical mobility - Moved from abroad (%)
Geographical mobility - Moved from abroad (%) - White
Geographical mobility - Moved from abroad (%) - Black or African American
Geographical mobility - Moved from abroad (%) - Asian
Geographical mobility - Moved from abroad (%) - Hispanic or Latino
Geographical mobility - Moved from abroad (%) - American Indian and Alaska Native
Geographical mobility - Moved from abroad (%) - Multirace
Geographical mobility - Moved from abroad (%) - Other Race
Place of birth for the foreign-born population - Ireland (%)
Place of birth for the foreign-born population - Denmark (%)
Place of birth for the foreign-born population - Norway (%)
Place of birth for the foreign-born population - Sweden (%)
Place of birth for the foreign-born population - United Kingdom (%)
Place of birth for the foreign-born population - England (%)
Place of birth for the foreign-born population - Scotland (%)
Place of birth for the foreign-born population - Other Northern Europe (%)
Place of birth for the foreign-born population - Austria (%)
Place of birth for the foreign-born population - Belgium (%)
Place of birth for the foreign-born population - France (%)
Place of birth for the foreign-born population - Germany (%)
Place of birth for the foreign-born population - Netherlands (%)
Place of birth for the foreign-born population - Switzerland (%)
Place of birth for the foreign-born population - Other Western Europe (%)
Place of birth for the foreign-born population - Greece (%)
Place of birth for the foreign-born population - Italy (%)
Place of birth for the foreign-born population - Portugal (%)
Place of birth for the foreign-born population - Spain (%)
Place of birth for the foreign-born population - Other Southern Europe (%)
Place of birth for the foreign-born population - Albania (%)
Place of birth for the foreign-born population - Belarus (%)
Place of birth for the foreign-born population - Bosnia and Herzegovina (%)
Place of birth for the foreign-born population - Bulgaria (%)
Place of birth for the foreign-born population - Croatia (%)
Place of birth for the foreign-born population - Czechoslovakia (%)
Place of birth for the foreign-born population - Hungary (%)
Place of birth for the foreign-born population - Latvia (%)
Place of birth for the foreign-born population - Lithuania (%)
Place of birth for the foreign-born population - North Macedonia (Macedonia) (%)
Place of birth for the foreign-born population - Moldova (%)
Place of birth for the foreign-born population - Poland (%)
Place of birth for the foreign-born population - Romania (%)
Place of birth for the foreign-born population - Russia (%)
Place of birth for the foreign-born population - Serbia (%)
Place of birth for the foreign-born population - Ukraine (%)
Place of birth for the foreign-born population - Other Eastern Europe (%)
Place of birth for the foreign-born population - China (%)
Place of birth for the foreign-born population - Hong Kong (%)
Place of birth for the foreign-born population - Taiwan (%)
Place of birth for the foreign-born population - Japan (%)
Place of birth for the foreign-born population - Korea (%)
Place of birth for the foreign-born population - Other Eastern Asia (%)
Place of birth for the foreign-born population - Afghanistan (%)
Place of birth for the foreign-born population - Bangladesh (%)
Place of birth for the foreign-born population - India (%)
Place of birth for the foreign-born population - Iran (%)
Place of birth for the foreign-born population - Kazakhstan (%)
Place of birth for the foreign-born population - Nepal (%)
Place of birth for the foreign-born population - Pakistan (%)
Place of birth for the foreign-born population - Sri Lanka (%)
Place of birth for the foreign-born population - Uzbekistan (%)
Place of birth for the foreign-born population - Other South Central Asia (%)
Place of birth for the foreign-born population - Burma (%)
Place of birth for the foreign-born population - Cambodia (%)
Place of birth for the foreign-born population - Indonesia (%)
Place of birth for the foreign-born population - Laos (%)
Place of birth for the foreign-born population - Malaysia (%)
Place of birth for the foreign-born population - Philippines (%)
Place of birth for the foreign-born population - Singapore (%)
Place of birth for the foreign-born population - Thailand (%)
Place of birth for the foreign-born population - Vietnam (%)
Place of birth for the foreign-born population - Other South Eastern Asia (%)
Place of birth for the foreign-born population - Armenia (%)
Place of birth for the foreign-born population - Iraq (%)
Place of birth for the foreign-born population - Israel (%)
Place of birth for the foreign-born population - Jordan (%)
Place of birth for the foreign-born population - Kuwait (%)
Place of birth for the foreign-born population - Lebanon (%)
Place of birth for the foreign-born population - Saudi Arabia (%)
Place of birth for the foreign-born population - Syria (%)
Place of birth for the foreign-born population - Turkey (%)
Place of birth for the foreign-born population - Yemen (%)
Place of birth for the foreign-born population - Other Western Asia (%)
Place of birth for the foreign-born population - Eritrea (%)
Place of birth for the foreign-born population - Ethiopia (%)
Place of birth for the foreign-born population - Kenya (%)
Place of birth for the foreign-born population - Somalia (%)
Place of birth for the foreign-born population - Uganda (%)
Place of birth for the foreign-born population - Zimbabwe (%)
Place of birth for the foreign-born population - Other Eastern Africa (%)
Place of birth for the foreign-born population - Cameroon (%)
Place of birth for the foreign-born population - Congo (%)
Place of birth for the foreign-born population - Democratic Republic of Congo (Zaire) (%)
Place of birth for the foreign-born population - Other Middle Africa (%)
Place of birth for the foreign-born population - Egypt (%)
Place of birth for the foreign-born population - Morocco (%)
Place of birth for the foreign-born population - Sudan (%)
Place of birth for the foreign-born population - Other Northern Africa (%)
Place of birth for the foreign-born population - South Africa (%)
Place of birth for the foreign-born population - Other Southern Africa (%)
Place of birth for the foreign-born population - Cabo Verde (%)
Place of birth for the foreign-born population - Ghana (%)
Place of birth for the foreign-born population - Liberia (%)
Place of birth for the foreign-born population - Nigeria (%)
Place of birth for the foreign-born population - Senegal (%)
Place of birth for the foreign-born population - Sierra Leone (%)
Place of birth for the foreign-born population - Other Western Africa (%)
Place of birth for the foreign-born population - Australia (%)
Place of birth for the foreign-born population - New Zealand (%)
Place of birth for the foreign-born population - Fiji (%)
Place of birth for the foreign-born population - Micronesia (%)
Place of birth for the foreign-born population - Bahamas (%)
Place of birth for the foreign-born population - Barbados (%)
Place of birth for the foreign-born population - Cuba (%)
Place of birth for the foreign-born population - Dominica (%)
Place of birth for the foreign-born population - Dominican Republic (%)
Place of birth for the foreign-born population - Grenada (%)
Place of birth for the foreign-born population - Haiti (%)
Place of birth for the foreign-born population - Jamaica (%)
Place of birth for the foreign-born population - St. Vincent and the Grenadines (%)
Place of birth for the foreign-born population - Trinidad and Tobago (%)
Place of birth for the foreign-born population - West Indies (%)
Place of birth for the foreign-born population - Other Caribbean (%)
Place of birth for the foreign-born population - Belize (%)
Place of birth for the foreign-born population - Costa Rica (%)
Place of birth for the foreign-born population - El Salvador (%)
Place of birth for the foreign-born population - Guatemala (%)
Place of birth for the foreign-born population - Honduras (%)
Place of birth for the foreign-born population - Mexico (%)
Place of birth for the foreign-born population - Nicaragua (%)
Place of birth for the foreign-born population - Panama (%)
Place of birth for the foreign-born population - Other Central America (%)
Place of birth for the foreign-born population - Argentina (%)
Place of birth for the foreign-born population - Bolivia (%)
Place of birth for the foreign-born population - Brazil (%)
Place of birth for the foreign-born population - Chile (%)
Place of birth for the foreign-born population - Colombia (%)
Place of birth for the foreign-born population - Ecuador (%)
Place of birth for the foreign-born population - Guyana (%)
Place of birth for the foreign-born population - Peru (%)
Place of birth for the foreign-born population - Uruguay (%)
Place of birth for the foreign-born population - Venezuela (%)
Place of birth for the foreign-born population - Other South America (%)
Place of birth for the foreign-born population - Canada (%)
Place of birth for the foreign-born population - Other Northern America (%)
Place of birth for the foreign-born population - Other (%)
Latest news about races in Bozeman, MT collected exclusively by city-data.com from local newspapers, TV, and radio stations
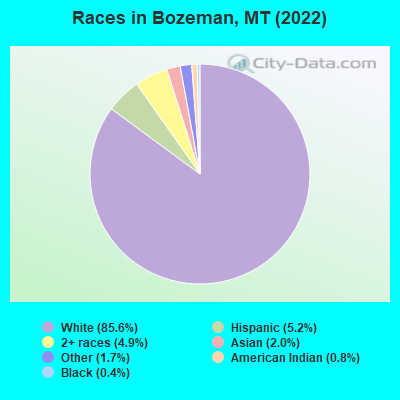
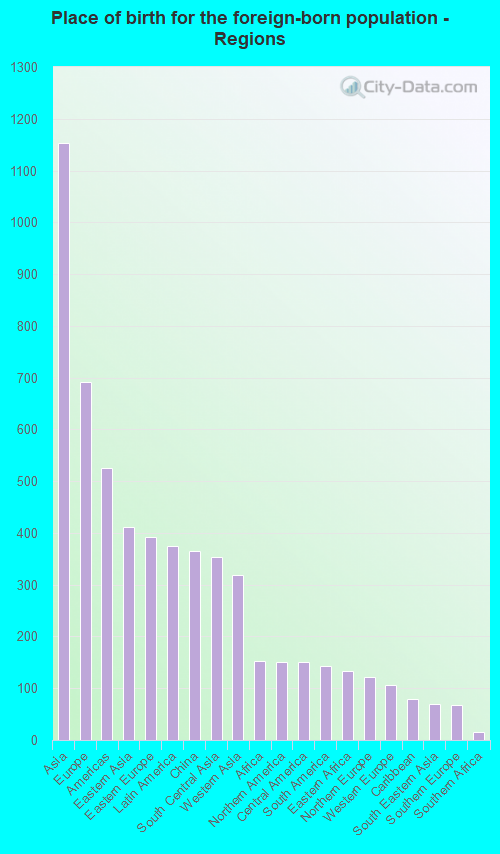
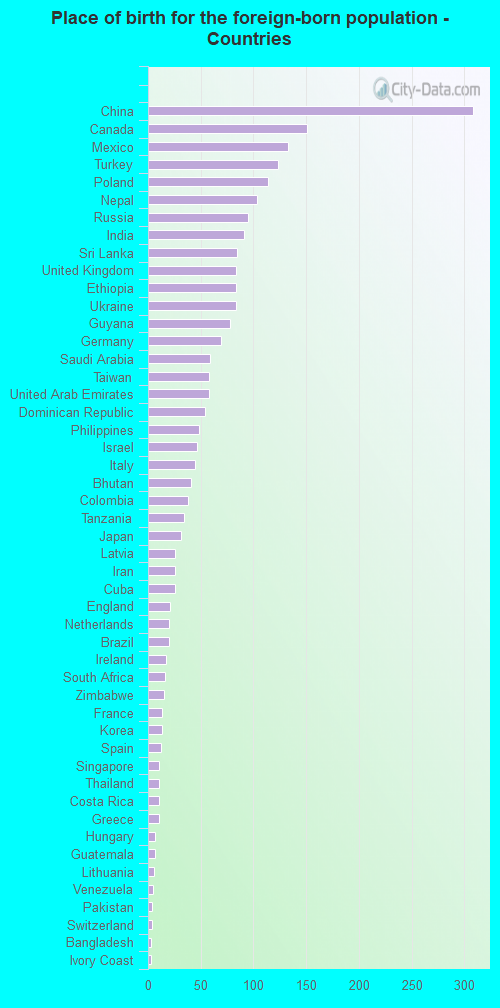
According to 2022 data, the most numerous races in Bozeman, MT are White alone (47,754 residents), American Indian alone (451 residents), and Two or more races (2,716 residents). 94.4% of Bozeman residents speak English at home. 4.5% of Bozeman, MT residents are foreign-born (2.1% born in Asia, 1.3% born in Europe, 0.7% born in Latin America), which is 55.8% greater than the foreign-born rate of 2.0% across the entire state of Montana.
Race distribution in Bozeman
2000 2022
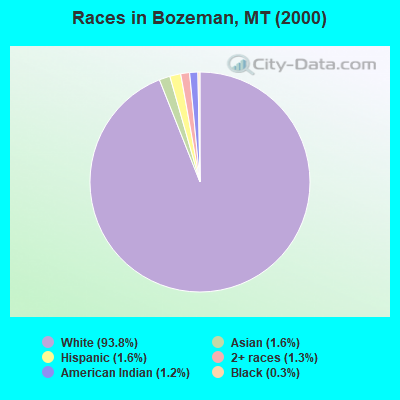
807,823 89.5% White alone 54,426 6.0% American Indian alone 18,081 2.0% Hispanic 13,768 1.5% Two or more races 4,569 0.5% Asian alone 2,534 0.3% Black alone 569 0.06% Other race alone 425 0.05% Native Hawaiian and Other
937,365 83.5% White alone 58,748 5.2% American Indian alone 55,172 4.9% Two or more races 49,830 4.4% Hispanic 9,012 0.8% Other race alone 7,700 0.7% Asian alone 3,428 0.3% Black alone 1,612 0.1% Native Hawaiian and Other
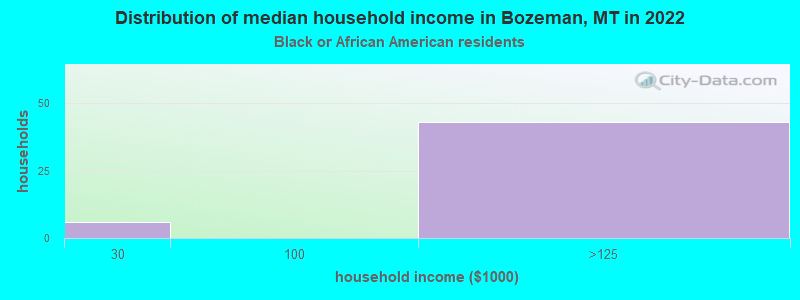
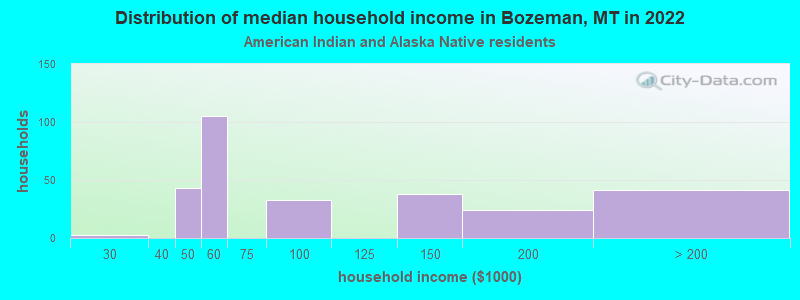
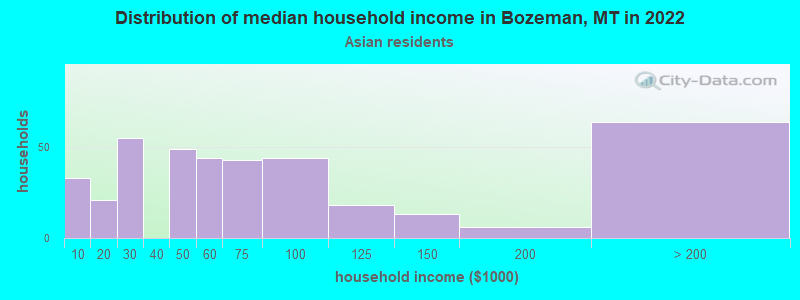
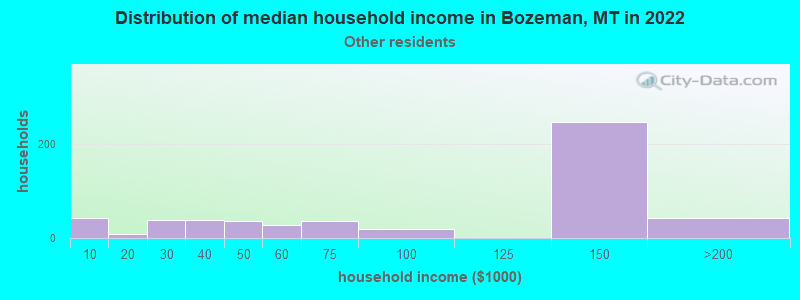
Income and house value in Bozeman Median household income in 2022 $74,997 White non-Hispanic householders$86,122 American Indian and Alaska Native householders$51,178 Asian householders$105,922 Some other race householders$66,909 Two or more races householders$53,918 Hispanic or Latino race householdersMedian 2022 house value $667,355 White Non-Hispanic householders$582,418 American Indian or Alaska Native householders $667,355 Asian householders$625,129 Two or more races householders$667,355 Hispanic or Latino householders
Median age by race in Bozeman
29.1 Median age for White residents28.0 29.8 31.7 Median age for Black or African American residents28.2 28.5 24.2 Median age for American Indian / Alaska Native residents23.7 22.4 34.2 Median age for Asian residents21.4 35.2 -666,666,666.0 Median age for Native Hawaiian / Pacific Islander residents-666,666,666.0 -666,666,666.0 23.9 Median age for Other race residents25.6 21.0 27.2 Median age for Two or more races residents21.6 30.5 29.2 Median age for White alone residents28.2 29.9 26.8 Median age for Hispanic or Latino residents25.7 29.2
Owner/renter occupied households by race in Bozeman
House owners and renters - White residents 10,076 46.4% Owner occupied11,622 53.6% Renter occupiedHouse owners and renters - Black or African American residents 43 100.0% Renter occupiedHouse owners and renters - American Indian / Alaska Native residents 50 31.8% Owner occupied107 68.2% Renter occupiedHouse owners and renters - Asian residents 122 32.6% Owner occupied253 67.4% Renter occupiedHouse owners and renters - Other race residents 103 18.4% Owner occupied459 81.6% Renter occupiedHouse owners and renters - Two or more races residents 404 32.3% Owner occupied847 67.7% Renter occupiedHouse owners and renters - White alone residents 9,926 46.5% Owner occupied11,438 53.5% Renter occupiedHouse owners and renters - Hispanic or Latino residents 343 39.4% Owner occupied527 60.6% Renter occupied
Language usage in Bozeman
English speakers - Total 94.4% of residents of Bozeman speak English at home.
2.1% of residents speak Spanish at home 911 79.5% Speak English very well235 20.5% Speak English less than very well3.1% of residents speak other language at home 1,502 88.0% Speak English very well204 12.0% Speak English less than very well
English speakers - Born in the United States 97.4% of residents of Bozeman speak English at home.
1.6% of residents speak Spanish at home 512 90.8% Speak English very well52 9.2% Speak English less than very well1.0% of residents speak other language at home 259 73.4% Speak English very well94 26.6% Speak English less than very well
English speakers - Native, born elsewhere 73.0% of residents of Bozeman speak English at home.
13.8% of residents speak Spanish at home 78 100.0% Speak English very well5.0% of residents speak other language at home 28 100.0% Speak English very well
English speakers - Foreign-born 47.8% of residents of Bozeman speak English at home.
12.9% of residents speak Spanish at home 174 52.9% Speak English very well155 47.1% Speak English less than very well40.8% of residents speak other language at home 696 66.9% Speak English very well345 33.1% Speak English less than very well
White (Caucasian) - Speak only English Native:
98.6% (45,643)Foreign-born:
68.4% (840)
White (Caucasian) - Speak another language Native:
1.4% (666)Foreign-born:
27.5% (337)
Black or African American - Speak only English Native:
100.0% (167)Foreign-born:
51.5% (81)
Asian - Speak only English Native:
80.0% (275)Foreign-born:
26.9% (200)
Asian - Speak another language Native:
15.8% (54)Foreign-born:
72.4% (539)
Other race - Speak only English Native:
75.5% (710)Foreign-born:
67.1% (139)
Other race - Speak another language Native:
24.8% (233)Foreign-born:
44.8% (93)
Two or more races - Speak only English Native:
85.3% (2,978)Foreign-born:
10.6% (38)
Two or more races - Speak another language Native:
13.9% (484)Foreign-born:
75.8% (274)
White alone - Speak only English Native:
98.7% (44,801)Foreign-born:
71.2% (908)
White alone - Speak another language Native:
1.3% (590)Foreign-born:
25.8% (330)
Hispanic or Latino - Speak only English Native:
77.7% (1,809)Foreign-born:
20.1% (64)
Hispanic or Latino - Speak another language Native:
19.0% (442)Foreign-born:
100.0% (318)
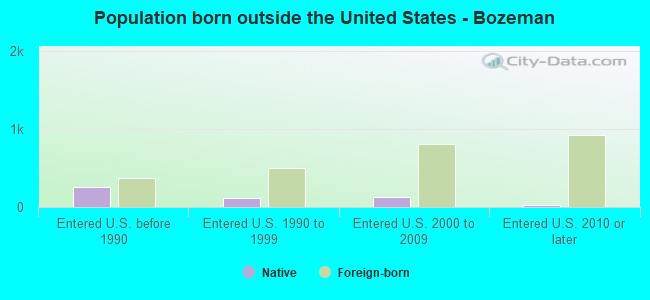
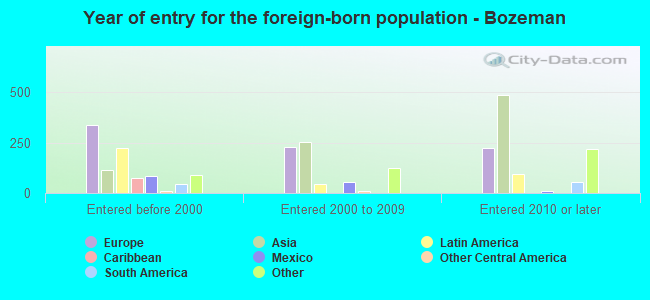
Foreign-born residents in Bozeman 2,524 residents are foreign born (2.1% Asia , 1.3% Europe , 0.7% Latin America ).
This city:
4.5%Montana:
2.3%
Marital status for residents in Bozeman Marital status - White (Caucasian) population 15 years and over
Males 58.3% Never married33.5% Now married0.7% Separated0.6% Widowed6.9% DivorcedFemales 46.1% Never married36.6% Now married0.9% Separated3.9% Widowed12.6% DivorcedWomen who gave birth in the past 12 months Now married:
100.0% (340)Unmarried:
0.0% (0)
Women who did not give birth in the past 12 months Now married:
29.6% (4,458)Unmarried:
70.4% (10,608)
Marital status - Black or African American population 15 years and over
Males 40.2% Never married56.7% Now married0.0% Separated0.0% Widowed3.1% DivorcedFemales 88.4% Never married11.6% Now married0.0% Separated0.0% Widowed0.0% DivorcedWomen who gave birth in the past 12 months Now married:
100.0% (9)Unmarried:
0.0% (0)
Women who did not give birth in the past 12 months Now married:
0.0% (0)Unmarried:
100.0% (69)
Marital status - American Indian / Alaska Native population 15 years and over
Males 53.1% Never married33.2% Now married2.0% Separated1.0% Widowed10.7% DivorcedFemales 69.4% Never married12.5% Now married0.0% Separated3.3% Widowed14.8% DivorcedWomen who did not give birth in the past 12 months Now married:
1.5% (4)Unmarried:
98.5% (258)
Marital status - Asian population 15 years and over
Males 70.7% Never married29.3% Now married0.0% Separated0.0% Widowed0.0% DivorcedFemales 53.2% Never married39.5% Now married3.2% Separated2.1% Widowed2.1% DivorcedWomen who did not give birth in the past 12 months Now married:
36.7% (161)Unmarried:
63.3% (277)
Marital status - Other race population 15 years and over
Males 27.1% Never married70.1% Now married0.0% Separated0.0% Widowed2.8% DivorcedFemales 52.4% Never married43.9% Now married3.7% Separated0.0% Widowed0.0% DivorcedWomen who did not give birth in the past 12 months Now married:
40.7% (150)Unmarried:
59.3% (218)
Marital status - Two or more races population 15 years and over
Males 56.2% Never married36.0% Now married0.4% Separated1.5% Widowed6.0% DivorcedFemales 43.9% Never married53.0% Now married0.0% Separated0.6% Widowed2.5% DivorcedWomen who gave birth in the past 12 months Now married:
89.9% (111)Unmarried:
10.1% (12)
Women who did not give birth in the past 12 months Now married:
34.3% (332)Unmarried:
65.7% (634)
Marital status - White alone, not Hispanic / Latino population 15 years and over
Males 58.0% Never married33.7% Now married0.7% Separated0.6% Widowed7.0% DivorcedFemales 46.1% Never married36.5% Now married0.9% Separated4.0% Widowed12.5% DivorcedWomen who gave birth in the past 12 months Now married:
100.0% (285)Unmarried:
0.0% (0)
Women who did not give birth in the past 12 months Now married:
29.7% (4,379)Unmarried:
70.3% (10,377)
Marital status - Hispanic or Latino population 15 years and over
Males 47.3% Never married48.9% Now married0.0% Separated0.7% Widowed3.0% DivorcedFemales 50.2% Never married39.8% Now married1.2% Separated0.0% Widowed8.8% DivorcedWomen who gave birth in the past 12 months Now married:
86.6% (76)Unmarried:
13.4% (12)
Women who did not give birth in the past 12 months Now married:
17.9% (140)Unmarried:
82.1% (645)
Ancestries in Bozeman
3,231 16.1% German2,048 10.2% Irish1,956 9.7% English1,672 8.3% European1,544 7.7% American962 4.8% Norwegian555 2.8% Italian505 2.5% Northern European447 2.2% Dutch350 1.7% Polish348 1.7% Scottish325 1.6% Swedish253 1.3% Scandinavian232 1.2% French165 0.8% Scotch-Irish163 0.8% Ethiopian143 0.7% Welsh131 0.7% Ukrainian128 0.6% Danish109 0.5% Eastern European102 0.5% Russian90 0.4% Austrian90 0.4% British90 0.4% Turkish84 0.4% French Canadian59 0.3% Canadian59 0.3% Greek57 0.3% Swiss56 0.3% Romanian56 0.3% Lithuanian55 0.3% Croatian53 0.3% Czech51 0.3% Finnish43 0.2% Czechoslovakian36 0.2% Cypriot32 0.2% Israeli31 0.2% Basque27 0.1% Hungarian24 0.1% Portuguese22 0.1% Slovene22 0.1% African21 0.1% Zimbabwean15 0.07% Iranian15 0.07% Arab14 0.07% Latvian13 0.06% Brazilian10 0.05% Serbian8 0.04% Armenian8 0.04% Slovak3 0.01% Australian
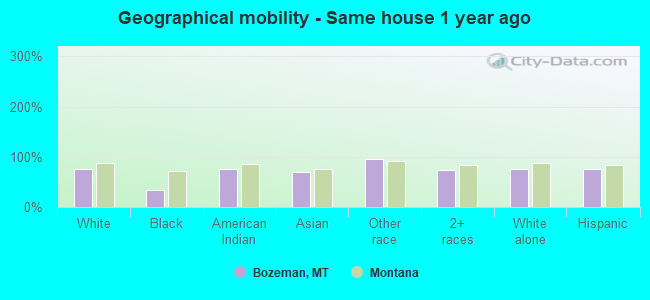
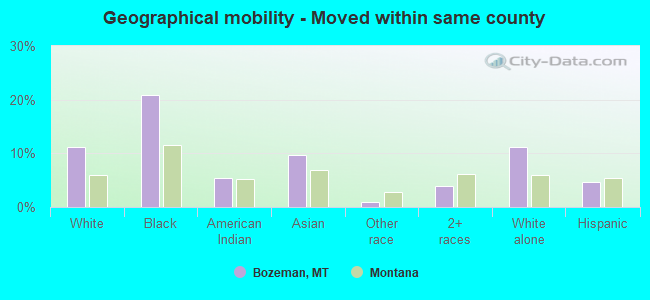
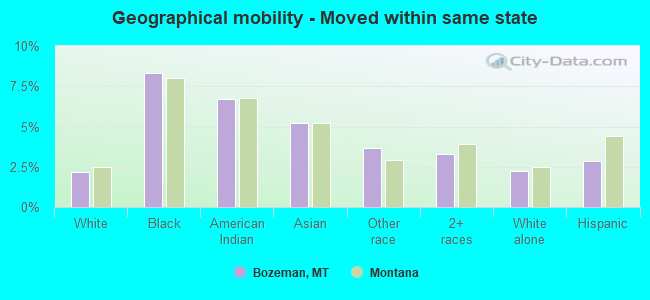
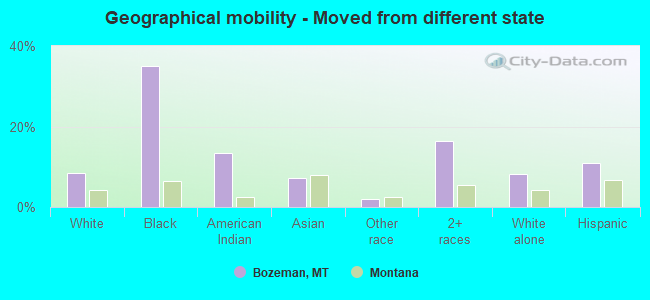
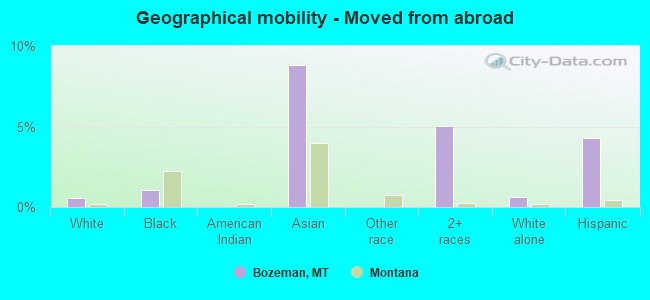
Geographical mobility in Bozeman Same house 1 year ago 36,352 75.3% White (Caucasian)111 34.0% Black or African American427 76.1% American Indian / Alaska Native928 69.9% Asian1,215 95.7% Other race2,947 73.6% Two or more races35,723 75.5% White alone, not Hispanic / Latino2,148 76.6% Hispanic or LatinoMoved within same county 5,365 11.1% White / Caucasian68 20.8% Black or African American30 5.4% American Indian / Alaska Native129 9.7% Asian13 1.0% Other race157 3.9% Two or more races5,268 11.1% White alone, not Hispanic / Latino131 4.7% Hispanic or LatinoMoved within same state 1,061 2.2% White / Caucasian27 8.3% Black or African American37 6.7% American Indian / Alaska Native69 5.2% Asian47 3.7% Other race131 3.3% Two or more races1,060 2.2% White alone, not Hispanic / Latino80 2.9% Hispanic or LatinoMoved from different state 4,043 8.4% White / Caucasian114 35.1% Black or African American76 13.5% American Indian / Alaska Native95 7.1% Asian24 1.9% Other race653 16.3% Two or more races3,917 8.3% White alone, not Hispanic / Latino308 11.0% Hispanic or LatinoMoved from abroad 272 0.6% White3 1.1% Black or African American117 8.8% Asian201 5.0% Two or more races293 0.6% White alone, not Hispanic / Latino120 4.3% Hispanic or Latino
Children Nativity (place of birth) in Bozeman
Children under 6 years - Living with two parents Both parents native 1,674 100.0% NativeBoth parents foreign-born 111 93.9% Native7 6.1% Foreign-bornOne native, one foreign-born parent 211 100.0% NativeChildren under 6 years - Living with one parent Native parent 201 100.0% NativeForeign-born parent 49 100.0% NativeChildren 6 to 17 years - Living with two parents Both parents native 2,849 96.6% Native100 3.4% Foreign-bornBoth parents foreign-born 105 52.6% Native95 47.4% Foreign-bornOne native, one foreign-born parent 233 92.5% Native19 7.5% Foreign-bornChildren 6 to 17 years - Living with one parent Native parent 1,277 100.0% NativeForeign-born parent 97 48.8% Native101 51.2% Foreign-born
Grandparents responsible for own grandchildren in Bozeman
Grandparents (30 to 59 years) Two or more races 20 56.7% Responsible for grandchildren15 43.3% Not responsible for grandchildrenHispanic or Latino 8 47.2% Responsible for grandchildren9 52.8% Not responsible for grandchildren
Grandparents (60 years and over) Two or more races 7 100.0% Not responsible for grandchildren