Races in Buford, Georgia (GA) Detailed Stats
Data:
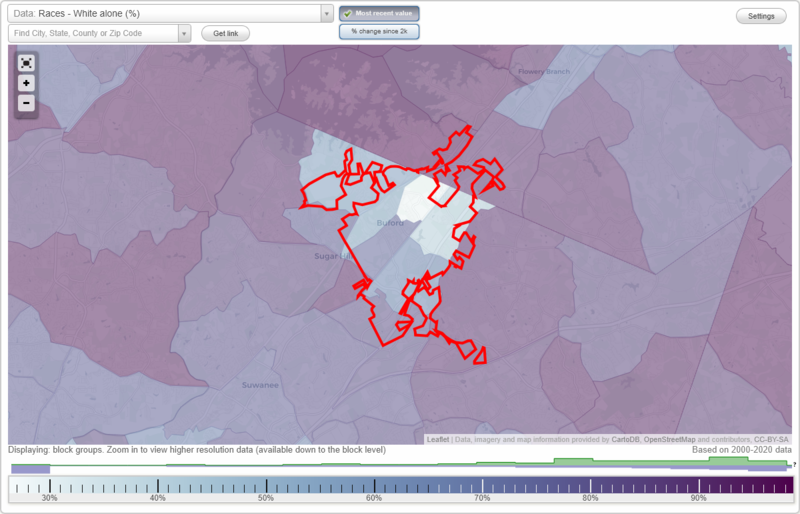
Races - White alone (%)
Races - White alone (% change since 2000)
Races - Black alone (%)
Races - Black alone (% change since 2000)
Races - American Indian alone (%)
Races - American Indian alone (% change since 2000)
Races - Asian alone (%)
Races - Asian alone (% change since 2000)
Races - Hispanic (%)
Races - Hispanic (% change since 2000)
Races - Native Hawaiian and Other Pacific Islander alone (%)
Races - Native Hawaiian and Other Pacific Islander alone (% change since 2000)
Races - Two or more races(%)
Races - Two or more races(% change since 2000)
Races - Other race alone (%)
Races - Other race alone (% change since 2000)
Racial diversity
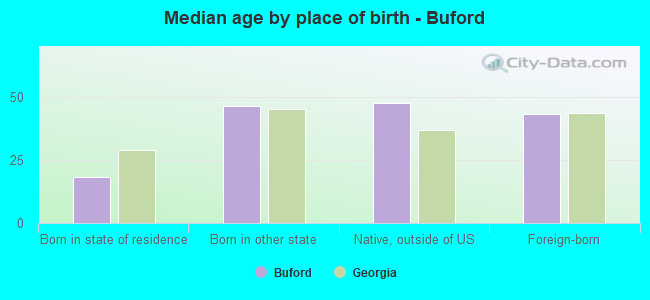
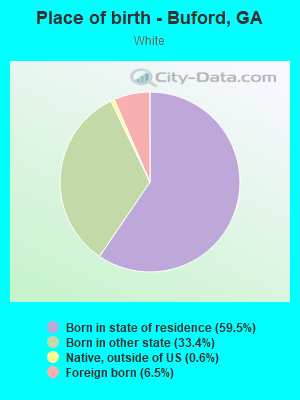
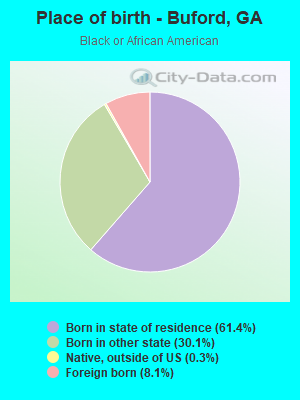
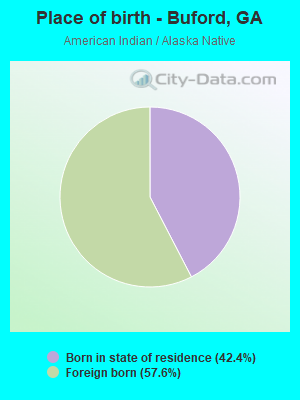
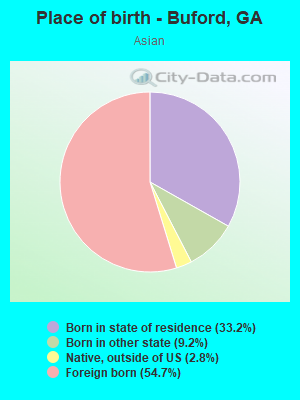
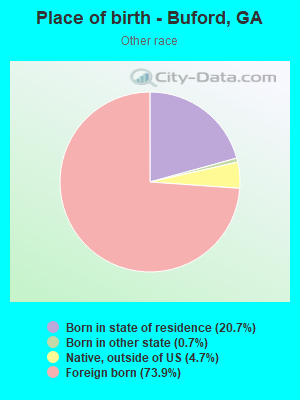
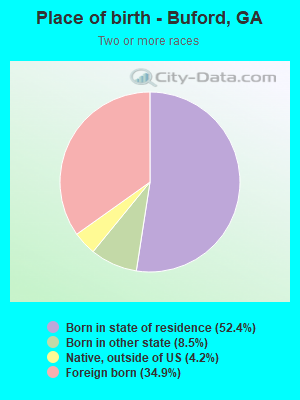
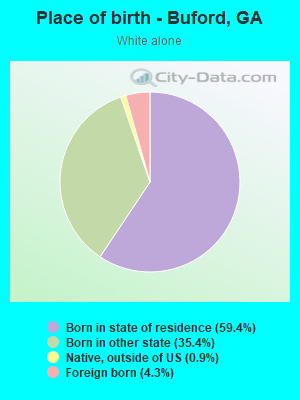
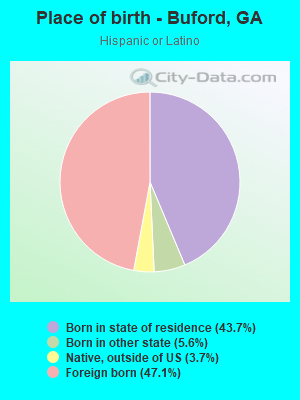
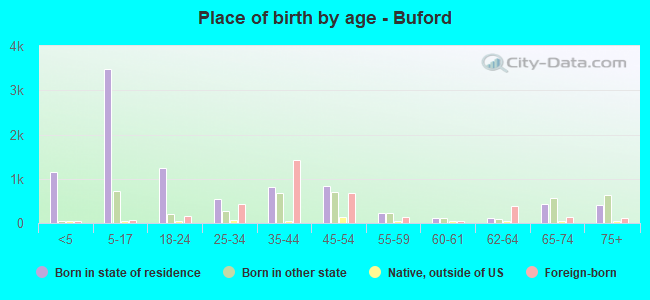
Place of birth - Born in state of residence (%)
Place of birth - Born in state of residence (%) - White
Place of birth - Born in state of residence (%) - Black or African American
Place of birth - Born in state of residence (%) - Asian
Place of birth - Born in state of residence (%) - Hispanic or Latino
Place of birth - Born in state of residence (%) - American Indian and Alaska Native
Place of birth - Born in state of residence (%) - Multirace
Place of birth - Born in state of residence (%) - Other Race
Place of birth - Born in other state (%)
Place of birth - Born in other state (%) - White
Place of birth - Born in other state (%) - Black or African American
Place of birth - Born in other state (%) - Asian
Place of birth - Born in other state (%) - Hispanic or Latino
Place of birth - Born in other state (%) - American Indian and Alaska Native
Place of birth - Born in other state (%) - Multirace
Place of birth - Born in other state (%) - Other Race
Place of birth - Native, outside of US (%)
Place of birth - Native, outside of US (%) - White
Place of birth - Native, outside of US (%) - Black or African American
Place of birth - Native, outside of US (%) - Asian
Place of birth - Native, outside of US (%) - Hispanic or Latino
Place of birth - Native, outside of US (%) - American Indian and Alaska Native
Place of birth - Native, outside of US (%) - Multirace
Place of birth - Native, outside of US (%) - Other Race
Place of birth - Foreign born (%)
Place of birth - Foreign born (%) - White
Place of birth - Foreign born (%) - Black or African American
Place of birth - Foreign born (%) - Asian
Place of birth - Foreign born (%) - Hispanic or Latino
Place of birth - Foreign born (%) - American Indian and Alaska Native
Place of birth - Foreign born (%) - Multirace
Place of birth - Foreign born (%) - Other Race
Residents speaking English at home (%)
Residents speaking English at home - Born in the United States (%)
Residents speaking English at home - Native, born elsewhere (%)
Residents speaking English at home - Foreign born (%)
Residents speaking Spanish at home (%)
Residents speaking Spanish at home - Born in the United States (%)
Residents speaking Spanish at home - Native, born elsewhere (%)
Residents speaking Spanish at home - Foreign born (%)
Residents speaking other language at home (%)
Residents speaking other language at home - Born in the United States (%)
Residents speaking other language at home - Native, born elsewhere (%)
Residents speaking other language at home - Foreign born (%)
Marital status - Never married (%)
Marital status - Now married (%)
Marital status - Separated (%)
Marital status - Widowed (%)
Marital status - Divorced (%)
Ancestries Reported - Arab (%)
Ancestries Reported - Czech (%)
Ancestries Reported - Danish (%)
Ancestries Reported - Dutch (%)
Ancestries Reported - English (%)
Ancestries Reported - French (%)
Ancestries Reported - French Canadian (%)
Ancestries Reported - German (%)
Ancestries Reported - Greek (%)
Ancestries Reported - Hungarian (%)
Ancestries Reported - Irish (%)
Ancestries Reported - Italian (%)
Ancestries Reported - Lithuanian (%)
Ancestries Reported - Norwegian (%)
Ancestries Reported - Polish (%)
Ancestries Reported - Portuguese (%)
Ancestries Reported - Russian (%)
Ancestries Reported - Scotch-Irish (%)
Ancestries Reported - Scottish (%)
Ancestries Reported - Slovak (%)
Ancestries Reported - Subsaharan African (%)
Ancestries Reported - Swedish (%)
Ancestries Reported - Swiss (%)
Ancestries Reported - Ukrainian (%)
Ancestries Reported - United States (%)
Ancestries Reported - Welsh (%)
Ancestries Reported - West Indian (%)
Ancestries Reported - Other (%)
Geographical mobility - Same house 1 year ago (%)
Geographical mobility - Same house 1 year ago (%) - White
Geographical mobility - Same house 1 year ago (%) - Black or African American
Geographical mobility - Same house 1 year ago (%) - Asian
Geographical mobility - Same house 1 year ago (%) - Hispanic or Latino
Geographical mobility - Same house 1 year ago (%) - American Indian and Alaska Native
Geographical mobility - Same house 1 year ago (%) - Multirace
Geographical mobility - Same house 1 year ago (%) - Other Race
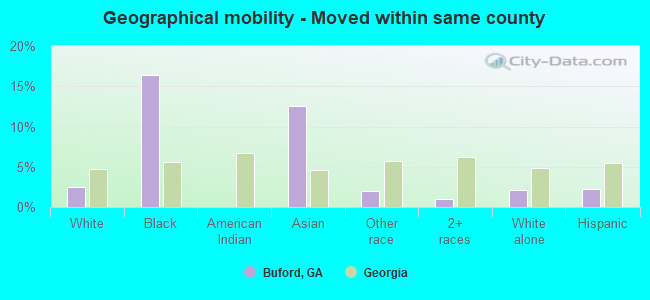
Geographical mobility - Moved within same county (%)
Geographical mobility - Moved within same county (%) - White
Geographical mobility - Moved within same county (%) - Black or African American
Geographical mobility - Moved within same county (%) - Asian
Geographical mobility - Moved within same county (%) - Hispanic or Latino
Geographical mobility - Moved within same county (%) - American Indian and Alaska Native
Geographical mobility - Moved within same county (%) - Multirace
Geographical mobility - Moved within same county (%) - Other Race
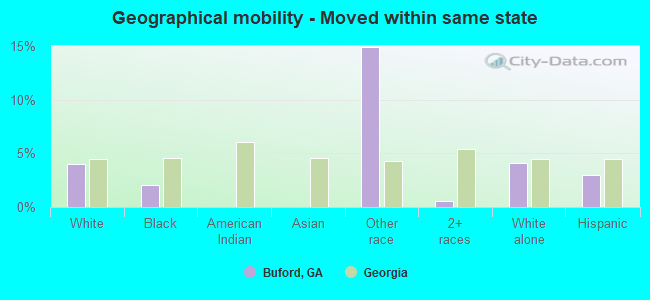
Geographical mobility - Moved from different county within same state (%)
Geographical mobility - Moved from different county within same state (%) - White
Geographical mobility - Moved from different county within same state (%) - Black or African American
Geographical mobility - Moved from different county within same state (%) - Asian
Geographical mobility - Moved from different county within same state (%) - Hispanic or Latino
Geographical mobility - Moved from different county within same state (%) - American Indian and Alaska Native
Geographical mobility - Moved from different county within same state (%) - Multirace
Geographical mobility - Moved from different county within same state (%) - Other Race
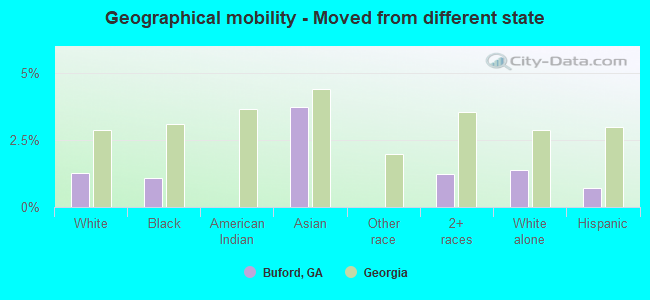
Geographical mobility - Moved from different state (%)
Geographical mobility - Moved from different state (%) - White
Geographical mobility - Moved from different state (%) - Black or African American
Geographical mobility - Moved from different state (%) - Asian
Geographical mobility - Moved from different state (%) - Hispanic or Latino
Geographical mobility - Moved from different state (%) - American Indian and Alaska Native
Geographical mobility - Moved from different state (%) - Multirace
Geographical mobility - Moved from different state (%) - Other Race
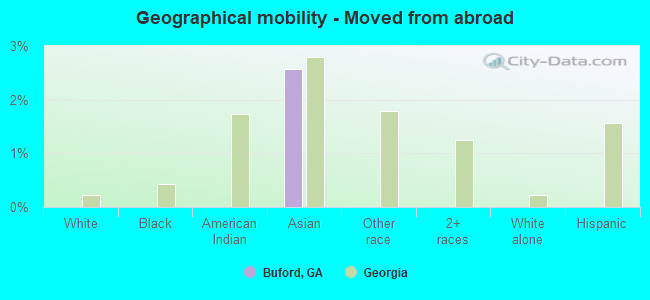
Geographical mobility - Moved from abroad (%)
Geographical mobility - Moved from abroad (%) - White
Geographical mobility - Moved from abroad (%) - Black or African American
Geographical mobility - Moved from abroad (%) - Asian
Geographical mobility - Moved from abroad (%) - Hispanic or Latino
Geographical mobility - Moved from abroad (%) - American Indian and Alaska Native
Geographical mobility - Moved from abroad (%) - Multirace
Geographical mobility - Moved from abroad (%) - Other Race
Place of birth for the foreign-born population - Ireland (%)
Place of birth for the foreign-born population - Denmark (%)
Place of birth for the foreign-born population - Norway (%)
Place of birth for the foreign-born population - Sweden (%)
Place of birth for the foreign-born population - United Kingdom (%)
Place of birth for the foreign-born population - England (%)
Place of birth for the foreign-born population - Scotland (%)
Place of birth for the foreign-born population - Other Northern Europe (%)
Place of birth for the foreign-born population - Austria (%)
Place of birth for the foreign-born population - Belgium (%)
Place of birth for the foreign-born population - France (%)
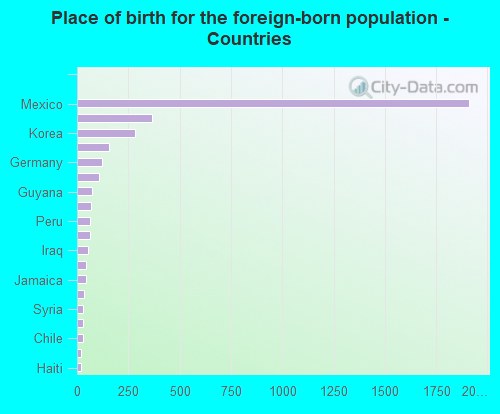
Place of birth for the foreign-born population - Germany (%)
Place of birth for the foreign-born population - Netherlands (%)
Place of birth for the foreign-born population - Switzerland (%)
Place of birth for the foreign-born population - Other Western Europe (%)
Place of birth for the foreign-born population - Greece (%)
Place of birth for the foreign-born population - Italy (%)
Place of birth for the foreign-born population - Portugal (%)
Place of birth for the foreign-born population - Spain (%)
Place of birth for the foreign-born population - Other Southern Europe (%)
Place of birth for the foreign-born population - Albania (%)
Place of birth for the foreign-born population - Belarus (%)
Place of birth for the foreign-born population - Bosnia and Herzegovina (%)
Place of birth for the foreign-born population - Bulgaria (%)
Place of birth for the foreign-born population - Croatia (%)
Place of birth for the foreign-born population - Czechoslovakia (%)
Place of birth for the foreign-born population - Hungary (%)
Place of birth for the foreign-born population - Latvia (%)
Place of birth for the foreign-born population - Lithuania (%)
Place of birth for the foreign-born population - North Macedonia (Macedonia) (%)
Place of birth for the foreign-born population - Moldova (%)
Place of birth for the foreign-born population - Poland (%)
Place of birth for the foreign-born population - Romania (%)
Place of birth for the foreign-born population - Russia (%)
Place of birth for the foreign-born population - Serbia (%)
Place of birth for the foreign-born population - Ukraine (%)
Place of birth for the foreign-born population - Other Eastern Europe (%)
Place of birth for the foreign-born population - China (%)
Place of birth for the foreign-born population - Hong Kong (%)
Place of birth for the foreign-born population - Taiwan (%)
Place of birth for the foreign-born population - Japan (%)
Place of birth for the foreign-born population - Korea (%)
Place of birth for the foreign-born population - Other Eastern Asia (%)
Place of birth for the foreign-born population - Afghanistan (%)
Place of birth for the foreign-born population - Bangladesh (%)
Place of birth for the foreign-born population - India (%)
Place of birth for the foreign-born population - Iran (%)
Place of birth for the foreign-born population - Kazakhstan (%)
Place of birth for the foreign-born population - Nepal (%)
Place of birth for the foreign-born population - Pakistan (%)
Place of birth for the foreign-born population - Sri Lanka (%)
Place of birth for the foreign-born population - Uzbekistan (%)
Place of birth for the foreign-born population - Other South Central Asia (%)
Place of birth for the foreign-born population - Burma (%)
Place of birth for the foreign-born population - Cambodia (%)
Place of birth for the foreign-born population - Indonesia (%)
Place of birth for the foreign-born population - Laos (%)
Place of birth for the foreign-born population - Malaysia (%)
Place of birth for the foreign-born population - Philippines (%)
Place of birth for the foreign-born population - Singapore (%)
Place of birth for the foreign-born population - Thailand (%)
Place of birth for the foreign-born population - Vietnam (%)
Place of birth for the foreign-born population - Other South Eastern Asia (%)
Place of birth for the foreign-born population - Armenia (%)
Place of birth for the foreign-born population - Iraq (%)
Place of birth for the foreign-born population - Israel (%)
Place of birth for the foreign-born population - Jordan (%)
Place of birth for the foreign-born population - Kuwait (%)
Place of birth for the foreign-born population - Lebanon (%)
Place of birth for the foreign-born population - Saudi Arabia (%)
Place of birth for the foreign-born population - Syria (%)
Place of birth for the foreign-born population - Turkey (%)
Place of birth for the foreign-born population - Yemen (%)
Place of birth for the foreign-born population - Other Western Asia (%)
Place of birth for the foreign-born population - Eritrea (%)
Place of birth for the foreign-born population - Ethiopia (%)
Place of birth for the foreign-born population - Kenya (%)
Place of birth for the foreign-born population - Somalia (%)
Place of birth for the foreign-born population - Uganda (%)
Place of birth for the foreign-born population - Zimbabwe (%)
Place of birth for the foreign-born population - Other Eastern Africa (%)
Place of birth for the foreign-born population - Cameroon (%)
Place of birth for the foreign-born population - Congo (%)
Place of birth for the foreign-born population - Democratic Republic of Congo (Zaire) (%)
Place of birth for the foreign-born population - Other Middle Africa (%)
Place of birth for the foreign-born population - Egypt (%)
Place of birth for the foreign-born population - Morocco (%)
Place of birth for the foreign-born population - Sudan (%)
Place of birth for the foreign-born population - Other Northern Africa (%)
Place of birth for the foreign-born population - South Africa (%)
Place of birth for the foreign-born population - Other Southern Africa (%)
Place of birth for the foreign-born population - Cabo Verde (%)
Place of birth for the foreign-born population - Ghana (%)
Place of birth for the foreign-born population - Liberia (%)
Place of birth for the foreign-born population - Nigeria (%)
Place of birth for the foreign-born population - Senegal (%)
Place of birth for the foreign-born population - Sierra Leone (%)
Place of birth for the foreign-born population - Other Western Africa (%)
Place of birth for the foreign-born population - Australia (%)
Place of birth for the foreign-born population - New Zealand (%)
Place of birth for the foreign-born population - Fiji (%)
Place of birth for the foreign-born population - Micronesia (%)
Place of birth for the foreign-born population - Bahamas (%)
Place of birth for the foreign-born population - Barbados (%)
Place of birth for the foreign-born population - Cuba (%)
Place of birth for the foreign-born population - Dominica (%)
Place of birth for the foreign-born population - Dominican Republic (%)
Place of birth for the foreign-born population - Grenada (%)
Place of birth for the foreign-born population - Haiti (%)
Place of birth for the foreign-born population - Jamaica (%)
Place of birth for the foreign-born population - St. Vincent and the Grenadines (%)
Place of birth for the foreign-born population - Trinidad and Tobago (%)
Place of birth for the foreign-born population - West Indies (%)
Place of birth for the foreign-born population - Other Caribbean (%)
Place of birth for the foreign-born population - Belize (%)
Place of birth for the foreign-born population - Costa Rica (%)
Place of birth for the foreign-born population - El Salvador (%)
Place of birth for the foreign-born population - Guatemala (%)
Place of birth for the foreign-born population - Honduras (%)
Place of birth for the foreign-born population - Mexico (%)
Place of birth for the foreign-born population - Nicaragua (%)
Place of birth for the foreign-born population - Panama (%)
Place of birth for the foreign-born population - Other Central America (%)
Place of birth for the foreign-born population - Argentina (%)
Place of birth for the foreign-born population - Bolivia (%)
Place of birth for the foreign-born population - Brazil (%)
Place of birth for the foreign-born population - Chile (%)
Place of birth for the foreign-born population - Colombia (%)
Place of birth for the foreign-born population - Ecuador (%)
Place of birth for the foreign-born population - Guyana (%)
Place of birth for the foreign-born population - Peru (%)
Place of birth for the foreign-born population - Uruguay (%)
Place of birth for the foreign-born population - Venezuela (%)
Place of birth for the foreign-born population - Other South America (%)
Place of birth for the foreign-born population - Canada (%)
Place of birth for the foreign-born population - Other Northern America (%)
Place of birth for the foreign-born population - Other (%)
Latest news about races in Buford, GA collected exclusively by city-data.com from local newspapers, TV, and radio stations
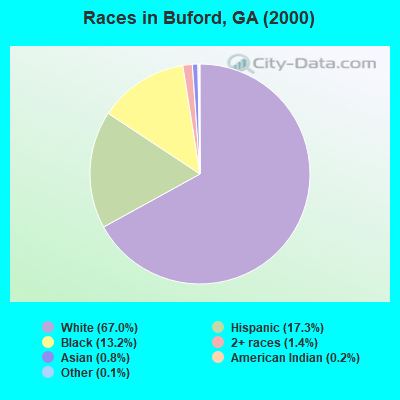
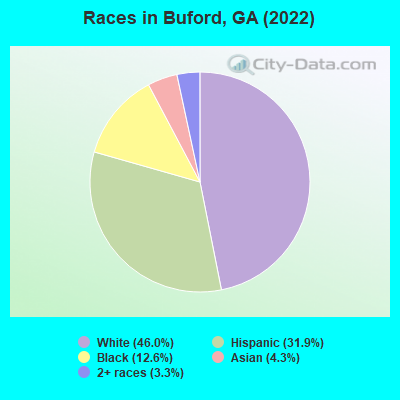
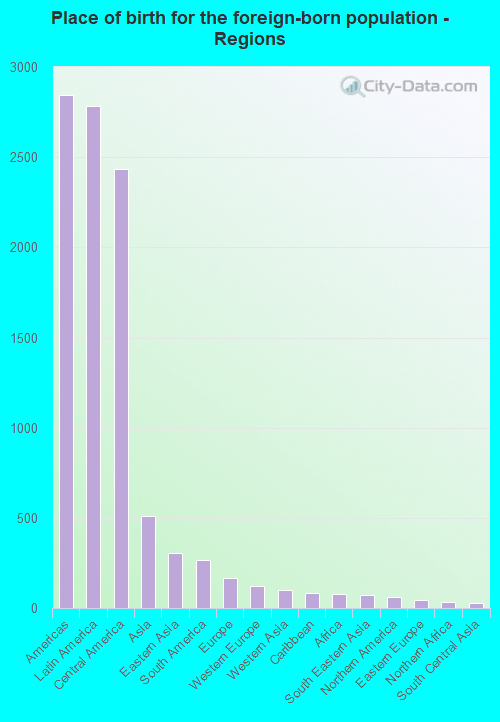
According to 2022 data, the most numerous races in Buford, GA are White alone (8,074 residents), Black alone (2,211 residents), and Hispanic (5,596 residents). 67.0% of Buford residents speak English at home. 20.5% of Buford, GA residents are foreign-born (15.5% born in Latin America, 2.8% born in Asia), which is 51.3% greater than the foreign-born rate of 10.0% across the entire state of Georgia.
Race distribution in Buford
2000 2022
5,128,661 62.6% White alone 2,331,465 28.5% Black alone 435,227 5.3% Hispanic 171,513 2.1% Asian alone 87,364 1.1% Two or more races 17,670 0.2% American Indian alone 11,275 0.1% Other race alone 3,278 0.04% Native Hawaiian and Other
5,415,657 49.6% White alone 3,349,240 30.7% Black alone 1,132,604 10.4% Hispanic 479,156 4.4% Asian alone 462,923 4.2% Two or more races 54,416 0.5% Other race alone 11,923 0.1% American Indian alone 6,957 0.06% Native Hawaiian and Other
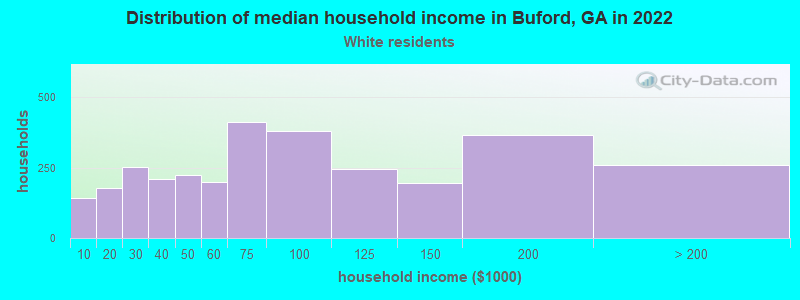
Income and house value in Buford Median household income in 2022 $63,847 White non-Hispanic householders$108,744 Black householders$90,668 Asian householders$45,722 Some other race householders$57,874 Two or more races householders$58,409 Hispanic or Latino race householdersMedian 2022 house value $423,199 White Non-Hispanic householders$291,900 Black or African American householders $428,146 Asian householders$364,971 Some other race householders$291,900 Two or more races householders$311,690 Hispanic or Latino householders
Median age by race in Buford
39.2 Median age for White residents36.2 43.5 38.8 Median age for Black or African American residents42.2 36.1 14.9 Median age for American Indian / Alaska Native residents13.3 20.3 37.9 Median age for Asian residents35.7 40.1 -1,080,291,969.7 Median age for Native Hawaiian / Pacific Islander residents-1,248,062,014.3 -776,776,776.0 37.2 Median age for Other race residents38.6 35.3 22.7 Median age for Two or more races residents15.6 35.6 41.5 Median age for White alone residents37.0 47.4 27.9 Median age for Hispanic or Latino residents27.2 32.3
Owner/renter occupied households by race in Buford
House owners and renters - White residents 2,345 78.0% Owner occupied662 22.0% Renter occupiedHouse owners and renters - Black or African American residents 360 55.9% Owner occupied283 44.1% Renter occupiedHouse owners and renters - American Indian / Alaska Native residents 10 100.0% Renter occupiedHouse owners and renters - Asian residents 166 93.1% Owner occupied12 6.9% Renter occupiedHouse owners and renters - Other race residents 290 71.0% Owner occupied119 29.0% Renter occupiedHouse owners and renters - Two or more races residents 474 62.0% Owner occupied291 38.0% Renter occupiedHouse owners and renters - White alone residents 2,236 77.1% Owner occupied665 22.9% Renter occupiedHouse owners and renters - Hispanic or Latino residents 786 66.8% Owner occupied391 33.2% Renter occupied
Language usage in Buford
English speakers - Total 67.0% of residents of Buford speak English at home.
26.4% of residents speak Spanish at home 1,597 37.0% Speak English very well2,715 63.0% Speak English less than very well5.7% of residents speak other language at home 617 65.7% Speak English very well322 34.3% Speak English less than very well
English speakers - Born in the United States 94.1% of residents of Buford speak English at home.
4.3% of residents speak Spanish at home 156 87.2% Speak English very well23 12.8% Speak English less than very well1.4% of residents speak other language at home 54 91.5% Speak English very well5 8.5% Speak English less than very well
English speakers - Native, born elsewhere 43.8% of residents of Buford speak English at home.
56.8% of residents speak Spanish at home 55 30.6% Speak English very well125 69.4% Speak English less than very well6.3% of residents speak other language at home 11 55.0% Speak English very well9 45.0% Speak English less than very well
English speakers - Foreign-born 6.1% of residents of Buford speak English at home.
72.3% of residents speak Spanish at home 300 11.5% Speak English very well2,318 88.5% Speak English less than very well20.9% of residents speak other language at home 466 61.6% Speak English very well290 38.4% Speak English less than very well
White (Caucasian) - Speak only English Native:
93.4% (7,235)Foreign-born:
8.5% (46)
White (Caucasian) - Speak another language Native:
6.8% (527)Foreign-born:
89.8% (491)
Black or African American - Speak only English Native:
100.0% (1,997)Foreign-born:
73.9% (135)
Black or African American - Speak another language Native:
0.3% (6)Foreign-born:
30.1% (55)
American Indian / Alaska Native - Speak another language Native:
100.0% (27)Foreign-born:
100.0% (54)
Asian - Speak only English Native:
74.5% (214)Foreign-born:
7.7% (32)
Asian - Speak another language Native:
20.7% (59)Foreign-born:
92.3% (379)
Other race - Speak another language Native:
90.0% (164)Foreign-born:
99.6% (1,275)
Two or more races - Speak another language Native:
49.7% (1,115)Foreign-born:
100.0% (1,359)
White alone - Speak only English Native:
98.6% (7,174)Foreign-born:
14.2% (48)
White alone - Speak another language Native:
1.4% (102)Foreign-born:
87.1% (294)
Hispanic or Latino - Speak another language Native:
68.7% (1,742)Foreign-born:
99.2% (2,635)
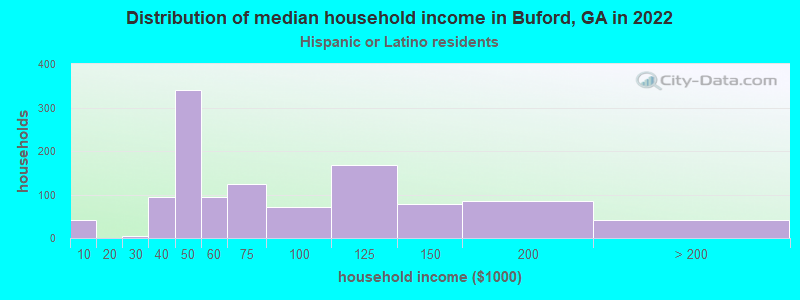
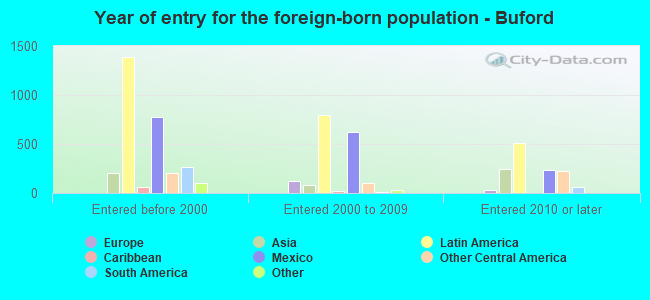
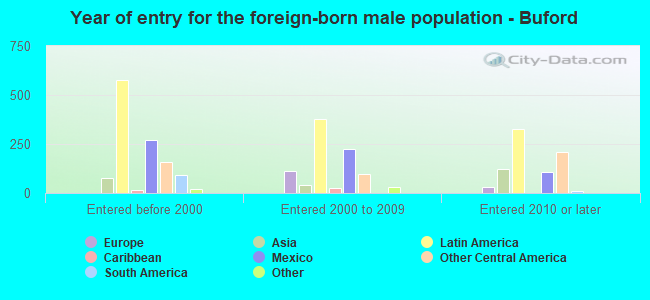
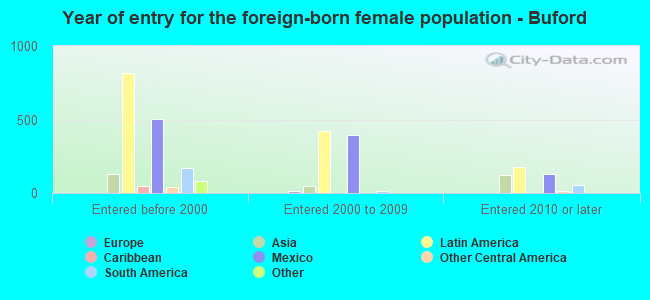
Foreign-born residents in Buford 3,601 residents are foreign born (15.5% Latin America , 2.8% Asia ).
This city:
20.5%Georgia:
10.4%
Marital status for residents in Buford Marital status - White (Caucasian) population 15 years and over
Males 33.1% Never married51.3% Now married0.0% Separated1.6% Widowed14.0% DivorcedFemales 27.9% Never married44.9% Now married0.4% Separated15.9% Widowed11.0% DivorcedWomen who gave birth in the past 12 months Now married:
54.5% (93)Unmarried:
45.5% (78)
Women who did not give birth in the past 12 months Now married:
47.6% (724)Unmarried:
52.4% (797)
Marital status - Black or African American population 15 years and over
Males 38.4% Never married48.6% Now married0.0% Separated2.2% Widowed10.8% DivorcedFemales 41.5% Never married39.0% Now married8.3% Separated3.4% Widowed7.9% DivorcedWomen who gave birth in the past 12 months Now married:
0.0% (0)Unmarried:
100.0% (64)
Women who did not give birth in the past 12 months Now married:
39.6% (197)Unmarried:
60.4% (301)
Marital status - American Indian / Alaska Native population 15 years and over
Males 54.5% Never married45.5% Now married0.0% Separated0.0% Widowed0.0% DivorcedFemales 55.0% Never married45.0% Now married0.0% Separated0.0% Widowed0.0% DivorcedWomen who did not give birth in the past 12 months Now married:
45.0% (14)Unmarried:
55.0% (17)
Marital status - Asian population 15 years and over
Males 9.9% Never married84.3% Now married0.0% Separated0.0% Widowed5.8% DivorcedFemales 20.4% Never married54.5% Now married6.7% Separated7.4% Widowed11.0% DivorcedWomen who gave birth in the past 12 months Now married:
100.0% (41)Unmarried:
0.0% (0)
Women who did not give birth in the past 12 months Now married:
64.9% (135)Unmarried:
35.1% (73)
Marital status - Other race population 15 years and over
Males 36.9% Never married43.9% Now married0.0% Separated9.4% Widowed9.9% DivorcedFemales 12.8% Never married72.0% Now married8.1% Separated2.0% Widowed5.1% DivorcedWomen who did not give birth in the past 12 months Now married:
78.2% (297)Unmarried:
21.8% (83)
Marital status - Two or more races population 15 years and over
Males 39.8% Never married60.2% Now married0.0% Separated0.0% Widowed0.0% DivorcedFemales 37.6% Never married40.0% Now married18.7% Separated3.7% Widowed0.0% DivorcedWomen who did not give birth in the past 12 months Now married:
50.5% (678)Unmarried:
49.5% (664)
Marital status - White alone, not Hispanic / Latino population 15 years and over
Males 33.1% Never married50.2% Now married0.0% Separated1.0% Widowed15.8% DivorcedFemales 26.1% Never married44.0% Now married0.4% Separated17.8% Widowed11.7% DivorcedWomen who gave birth in the past 12 months Now married:
47.4% (78)Unmarried:
52.6% (86)
Women who did not give birth in the past 12 months Now married:
48.3% (624)Unmarried:
51.7% (669)
Marital status - Hispanic or Latino population 15 years and over
Males 37.5% Never married53.9% Now married0.0% Separated5.1% Widowed3.6% DivorcedFemales 33.1% Never married49.1% Now married12.5% Separated2.9% Widowed2.4% DivorcedWomen who gave birth in the past 12 months Now married:
100.0% (28)Unmarried:
0.0% (0)
Women who did not give birth in the past 12 months Now married:
53.9% (956)Unmarried:
46.1% (818)
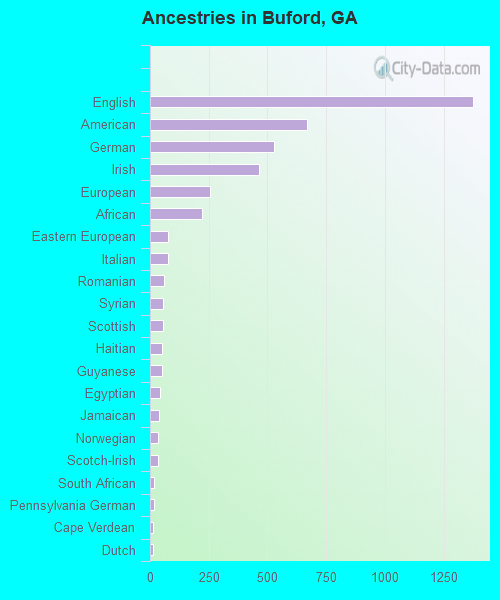
Ancestries in Buford
1,374 14.8% English669 7.2% American528 5.7% German464 5.0% Irish257 2.8% European220 2.4% African77 0.8% Eastern European77 0.8% Italian58 0.6% Romanian57 0.6% Syrian55 0.6% Scottish53 0.6% Haitian50 0.5% Guyanese43 0.5% Egyptian40 0.4% Jamaican35 0.4% Norwegian32 0.3% Scotch-Irish17 0.2% South African16 0.2% Pennsylvania German14 0.2% Cape Verdean13 0.1% Dutch12 0.1% Trinidadian and Tobagonian11 0.1% Basque10 0.1% French9 0.10% Greek
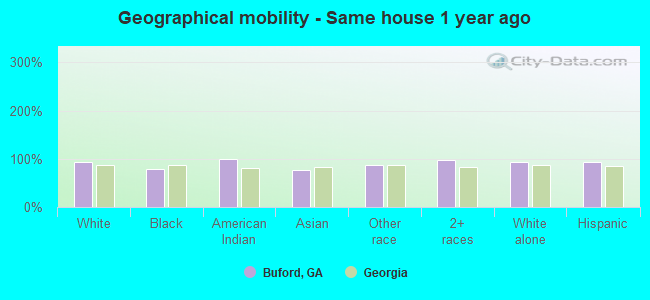
Geographical mobility in Buford Same house 1 year ago 7,894 92.8% White (Caucasian)1,719 79.8% Black or African American92 99.5% American Indian / Alaska Native562 77.3% Asian1,401 86.5% Other race3,733 97.0% Two or more races7,300 92.5% White alone, not Hispanic / Latino5,139 92.9% Hispanic or LatinoMoved within same county 209 2.5% White / Caucasian353 16.4% Black or African American92 12.6% Asian32 2.0% Other race38 1.0% Two or more races172 2.2% White alone, not Hispanic / Latino121 2.2% Hispanic or LatinoMoved within same state 338 4.0% White / Caucasian44 2.0% Black or African American241 14.9% Other race21 0.5% Two or more races323 4.1% White alone, not Hispanic / Latino163 2.9% Hispanic or LatinoMoved from different state 106 1.2% White / Caucasian23 1.1% Black or African American27 3.7% Asian48 1.2% Two or more races108 1.4% White alone, not Hispanic / Latino39 0.7% Hispanic or LatinoMoved from abroad 19 2.6% Asian
Children Nativity (place of birth) in Buford
Children under 6 years - Living with two parents Both parents native 453 100.0% Native0 0.0% Foreign-bornBoth parents foreign-born 206 96.0% Native8 4.0% Foreign-bornOne native, one foreign-born parent 136 100.0% NativeChildren under 6 years - Living with one parent Native parent 299 100.0% NativeForeign-born parent 189 100.0% NativeChildren 6 to 17 years - Living with two parents Both parents native 1,201 100.0% NativeBoth parents foreign-born 924 94.9% Native50 5.1% Foreign-bornOne native, one foreign-born parent 610 100.0% NativeChildren 6 to 17 years - Living with one parent Native parent 603 100.0% NativeForeign-born parent 336 51.7% Native313 48.3% Foreign-born
Grandparents responsible for own grandchildren in Buford
Grandparents (30 to 59 years) White / Caucasian 11 10.8% Responsible for grandchildren95 89.2% Not responsible for grandchildrenBlack or African American 121 100.0% Not responsible for grandchildrenWhite alone, not Hispanic / Latino 15 17.3% Responsible for grandchildren74 82.7% Not responsible for grandchildrenHispanic or Latino 37 100.0% Not responsible for grandchildrenGrandparents (60 years and over) White / Caucasian 23 24.6% Responsible for grandchildren70 75.4% Not responsible for grandchildrenBlack or African American 76 100.0% Not responsible for grandchildrenWhite alone, not Hispanic / Latino 23 23.1% Responsible for grandchildren76 76.9% Not responsible for grandchildrenHispanic or Latino 196 99.5% Responsible for grandchildren1 0.5% Not responsible for grandchildren