Races in Butler, New Jersey (NJ) Detailed Stats
Ancestries, Foreign-born residents, place of birth
Settings
X


Recent posts about races in Butler, New Jersey on our local forum with over 2,400,000 registered users:
 | Butler Area - House (11 replies) |
| Morganville - House (1 reply) |
| Moving From Bama to New Jersey (seriously) - Please Help With Buying Locations! (54 replies) |
| Anyone familiar with Butler, NJ? (6 replies) |
| Commuting to Morristown (24 replies) |
| Best Restaurants NJ (88 replies) |
Latest news about races in Butler, NJ collected exclusively by city-data.com from local newspapers, TV, and radio stations
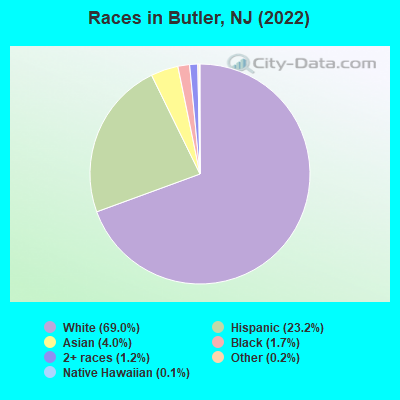
According to 2022 data, the most numerous races in Butler, NJ are White alone (5,573 residents), Hispanic (1,877 residents), and Black alone (140 residents). 74.4% of Butler residents speak English at home. 15.1% of Butler, NJ residents are foreign-born (7.0% born in Latin America, 4.2% born in Europe, 3.6% born in Asia), which is 52.0% less than the foreign-born rate of 23.0% across the entire state of New Jersey.
Race distribution in Butler
2000
2022

- 6,79291.5%White alone
- 3795.1%Hispanic
- 1371.8%Asian alone
- 550.7%Two or more races
- 420.6%Black alone
- 100.1%American Indian alone
- 50.07%Other race alone

-
- 5,57369.0%White alone
- 1,87723.2%Hispanic
- 3244.0%Asian alone
- 1401.7%Black alone
- 951.2%Two or more races
- 200.2%Other race alone
- 90.1%Native Hawaiian and Other
Pacific Islander alone
2000
2022
-
- 5,557,20966.0%White alone
- 1,117,19113.3%Hispanic
- 1,096,17113.0%Black alone
- 477,0125.7%Asian alone
- 133,6891.6%Two or more races
- 19,5650.2%Other race alone
- 11,3380.1%American Indian alone
- 2,1750.03%Native Hawaiian and Other
Pacific Islander alone

-
- 4,766,47651.5%White alone
- 2,028,47021.9%Hispanic
- 1,111,63212.0%Black alone
- 923,54610.0%Asian alone
- 332,2373.6%Two or more races
- 89,8471.0%Other race alone
- 8,5570.09%American Indian alone
- 9340.01%Native Hawaiian and Other
Pacific Islander alone

Income and house value in Butler
- Median household income in 2022
- $98,311White non-Hispanic householders
- $138,477Asian householders
- $123,804Some other race householders
- $131,872Two or more races householders
- $118,840Hispanic or Latino race householders
- Median 2022 house value
- $406,440White Non-Hispanic householders
- $406,223Asian householders
- $212,969Some other race householders
- $374,592Two or more races householders
- $400,157Hispanic or Latino householders
Household income for White non-Hispanic householders

Household income for Black householders

Household income for Asian householders

Household income for Some other race householders

Household income for Two or more races householders

Household income for Hispanic or Latino race householders

Median age by race in Butler
- 48.6Median age for White residents
- 45.0Males
- 50.6Females
- 41.2Median age for Black or African American residents
- 43.9Males
- 13.4Females
- -847,710,329.3Median age for American Indian / Alaska Native residents
- -707,246,376.1Males
- -671,264,367.1Females
- 33.9Median age for Asian residents
- 34.4Males
- 32.0Females
- -804,177,544.9Median age for Native Hawaiian / Pacific Islander residents
- -666,666,666.0Males
- -713,070,378.3Females
- 35.7Median age for Other race residents
- 28.7Males
- 34.3Females
- 35.9Median age for Two or more races residents
- 35.8Males
- 36.2Females
- 48.7Median age for White alone residents
- 44.4Males
- 52.2Females
- 38.1Median age for Hispanic or Latino residents
- 35.6Males
- 38.4Females
Owner/renter occupied households by race in Butler
- House owners and renters - White residents
- 1,96469.5%Owner occupied
- 86330.5%Renter occupied
- House owners and renters - Black or African American residents
- 31100.0%Owner occupied
- House owners and renters - Asian residents
- 14690.7%Owner occupied
- 159.3%Renter occupied
- House owners and renters - Native Hawaiian / Pacific Islander residents
- 11100.0%Owner occupied
- House owners and renters - Other race residents
- 13951.8%Owner occupied
- 12948.2%Renter occupied
- House owners and renters - Two or more races residents
- 15568.3%Owner occupied
- 7231.7%Renter occupied
- House owners and renters - White alone residents
- 1,85770.2%Owner occupied
- 78929.8%Renter occupied
- House owners and renters - Hispanic or Latino residents
- 40558.7%Owner occupied
- 28541.3%Renter occupied
Language usage in Butler
- English speakers - Total
- 74.4% of residents of Butler speak English at home.
- 14.8% of residents speak Spanish at home
- 79368.4%Speak English very well
- 36731.6%Speak English less than very well
- 10.2% of residents speak other language at home
- 58172.5%Speak English very well
- 22027.5%Speak English less than very well
- English speakers - Born in the United States
- 81.8% of residents of Butler speak English at home.
- 17.2% of residents speak Spanish at home
- 25492.0%Speak English very well
- 228.0%Speak English less than very well
- 2.7% of residents speak other language at home
- 44100.0%Speak English very well
- English speakers - Native, born elsewhere
- 0.0% of residents of Butler speak English at home.
- 130.0% of residents speak Spanish at home
- 26100.0%Speak English less than very well
- English speakers - Foreign-born
- 12.1% of residents of Butler speak English at home.
- 43.1% of residents speak Spanish at home
- 23646.4%Speak English very well
- 27353.6%Speak English less than very well
- 45.1% of residents speak other language at home
- 33763.2%Speak English very well
- 19636.8%Speak English less than very well
White (Caucasian) - Speak only English
| Native: | 91.4% (5,162) |
| Foreign-born: | 31.6% (114) |
White (Caucasian) - Speak another language
| Native: | 7.8% (443) |
| Foreign-born: | 68.3% (247) |
Asian - Speak only English
| Native: | 100.0% (37) |
| Foreign-born: | 1.8% (5) |
Other race - Speak only English
| Native: | 9.8% (32) |
| Foreign-born: | 4.4% (17) |
Other race - Speak another language
| Native: | 93.9% (305) |
| Foreign-born: | 95.5% (369) |
Two or more races - Speak another language
| Native: | 47.4% (173) |
| Foreign-born: | 97.9% (204) |
White alone - Speak only English
| Native: | 95.0% (4,850) |
| Foreign-born: | 25.4% (97) |
White alone - Speak another language
| Native: | 5.1% (259) |
| Foreign-born: | 75.5% (287) |
Hispanic or Latino - Speak only English
| Native: | 41.9% (501) |
| Foreign-born: | 9.7% (54) |
Hispanic or Latino - Speak another language
| Native: | 57.4% (687) |
| Foreign-born: | 90.4% (510) |
Foreign-born residents in Butler
1,223 residents are foreign born (7.0% Latin America, 4.2% Europe, 3.6% Asia).
| This city: | 15.1% |
| New Jersey: | 23.2% |


Marital status for residents in Butler
Marital status - White (Caucasian) population 15 years and over
- Males
- 40.5%Never married
- 44.9%Now married
- 0.7%Separated
- 3.6%Widowed
- 10.3%Divorced
- Females
- 30.0%Never married
- 42.3%Now married
- 0.9%Separated
- 14.4%Widowed
- 12.3%Divorced
Women who gave birth in the past 12 months
| Now married: | 58.6% (52) |
| Unmarried: | 41.4% (37) |
Women who did not give birth in the past 12 months
| Now married: | 41.7% (532) |
| Unmarried: | 58.3% (743) |
Marital status - Black or African American population 15 years and over
- Males
- 31.0%Never married
- 69.0%Now married
- 0.0%Separated
- 0.0%Widowed
- 0.0%Divorced
- Females
- 0.0%Never married
- 91.9%Now married
- 0.0%Separated
- 0.0%Widowed
- 8.1%Divorced
Women who did not give birth in the past 12 months
| Now married: | 100.0% (28) |
| Unmarried: | 0.0% (0) |
Marital status - Asian population 15 years and over
- Males
- 6.5%Never married
- 93.5%Now married
- 0.0%Separated
- 0.0%Widowed
- 0.0%Divorced
- Females
- 10.1%Never married
- 89.9%Now married
- 0.0%Separated
- 0.0%Widowed
- 0.0%Divorced
Women who did not give birth in the past 12 months
| Now married: | 86.7% (91) |
| Unmarried: | 13.3% (14) |
Marital status - Other race population 15 years and over
- Males
- 40.5%Never married
- 50.3%Now married
- 0.0%Separated
- 9.2%Widowed
- 0.0%Divorced
- Females
- 23.3%Never married
- 58.3%Now married
- 0.0%Separated
- 0.0%Widowed
- 18.3%Divorced
Women who did not give birth in the past 12 months
| Now married: | 51.0% (104) |
| Unmarried: | 49.0% (100) |
Marital status - Two or more races population 15 years and over
- Males
- 33.2%Never married
- 41.2%Now married
- 0.5%Separated
- 0.0%Widowed
- 25.1%Divorced
- Females
- 55.9%Never married
- 36.4%Now married
- 7.6%Separated
- 0.0%Widowed
- 0.0%Divorced
Women who did not give birth in the past 12 months
| Now married: | 53.1% (59) |
| Unmarried: | 46.9% (53) |
Marital status - White alone, not Hispanic / Latino population 15 years and over
- Males
- 40.4%Never married
- 46.0%Now married
- 0.4%Separated
- 3.6%Widowed
- 9.5%Divorced
- Females
- 29.2%Never married
- 40.7%Now married
- 1.0%Separated
- 16.3%Widowed
- 12.8%Divorced
Women who gave birth in the past 12 months
| Now married: | 100.0% (55) |
| Unmarried: | 0.0% (0) |
Women who did not give birth in the past 12 months
| Now married: | 39.1% (452) |
| Unmarried: | 60.9% (704) |
Marital status - Hispanic or Latino population 15 years and over
- Males
- 38.9%Never married
- 41.7%Now married
- 1.4%Separated
- 4.3%Widowed
- 13.7%Divorced
- Females
- 35.2%Never married
- 52.5%Now married
- 1.5%Separated
- 0.0%Widowed
- 10.8%Divorced
Women who gave birth in the past 12 months
| Now married: | 0.0% (0) |
| Unmarried: | 100.0% (43) |
Women who did not give birth in the past 12 months
| Now married: | 55.0% (228) |
| Unmarried: | 45.0% (186) |
Ancestries in Butler

- 49013.7%Italian
- 47113.2%Irish
- 2326.5%German
- 1634.6%Polish
- 1624.5%American
- 1253.5%Serbian
- 621.7%Romanian
- 521.5%Slavic
- 511.4%English
- 250.7%Dutch
- 240.7%Eastern European
- 220.6%British
- 210.6%Scotch-Irish
- 190.5%Brazilian
- 180.5%Greek
- 180.5%Slovak
- 160.4%Russian
- 140.4%Turkish
- 130.4%Croatian
- 130.4%Hungarian
- 120.3%Norwegian
- 110.3%Cypriot
- 110.3%Macedonian
- 110.3%Yugoslavian
- 100.3%European
- 90.3%Lithuanian
- 90.3%Ukrainian
- 80.2%Scottish
- 50.1%French Canadian
- 30.08%Jamaican

Geographical mobility in Butler

- Same house 1 year ago
- 5,60792.8%White (Caucasian)
- 8757.2%Black or African American
- 24673.4%Asian
- 67887.3%Other race
- 607100.0%Two or more races
- 5,16993.3%White alone, not Hispanic / Latino
- 1,70592.9%Hispanic or Latino

-
- Moved within same county
- 1151.9%White / Caucasian
- 7448.9%Black or African American
- 7221.6%Asian
- 961.7%White alone, not Hispanic / Latino
- 311.7%Hispanic or Latino

-
- Moved within same state
- 3085.1%White / Caucasian
- 21.2%Black or African American
- 236.9%Asian
- 10100.0%Native Hawaiian / Pacific Islander
- 253.3%Other race
- 81.3%Two or more races
- 2524.6%White alone, not Hispanic / Latino
- 1186.4%Hispanic or Latino

-
- Moved from abroad
- 236.9%Asian

Children Nativity (place of birth) in Butler
Place of birth for residents in Butler
![Place of birth for the foreign-born population - Regions]()
- 578Americas
- 572Latin America
- 347Europe
- 296Asia
- 254Central America
- 240Eastern Europe
- 179South Central Asia
- 173Caribbean
- 144South America
- 55Northern Europe
- 48Western Asia
- 39Southern Europe
- 37Eastern Asia
- 30South Eastern Asia
- 11Western Europe
- 6Northern America

![Place of birth for the foreign-born population - Countries]()
- 179India
- 166Dominican Republic
- 150Mexico
- 90Guatemala
- 79Poland
- 63Peru
- 45Romania
- 35Serbia
- 31Ecuador
- 30Philippines
- 28United Kingdom
- 23Italy
- 23Colombia
- 21Japan
- 20Syria
- 19Turkey
- 18Croatia
- 18Brazil
- 16Greece
- 16Korea
- 15Norway
- 14North Macedonia (Macedonia)
- 13Costa Rica
- 12Ireland
- 11Germany
- 9Bosnia and Herzegovina
- 9Lithuania
- 8Uruguay
- 7Cuba
- 6Canada

Zip codes: 07405.