Races in Cape Elizabeth, Maine (ME) Detailed Stats
Ancestries, Foreign-born residents, place of birth

Recent posts about races in Cape Elizabeth, Maine on our local forum with over 2,400,000 registered users:
 | looking to move: Comparing the surrounding towns (7 replies) |
| How quick does rental market move for a house? (4 replies) |
| Trying to decide between Falmouth and Cape Elizabeth, Maine (16 replies) |
| Why is the coastal Maine housing market so hot right now? (6 replies) |
| Cape Elizabeth neighborhoods? (25 replies) |
| Considering moving to Maine, but Gov. LePage scares me..... (166 replies) |
3.0% of Cape Elizabeth, ME residents are foreign-born (1.8% born in Europe, 0.6% born in Asia, 0.4% born in North America), which is about the same as the foreign-born rate of 3.0% across the entire state of Maine.
Race distribution in Cape Elizabeth

- 8,84997.6%White alone
- 901.0%Asian alone
- 430.5%Two or more races
- 450.5%Hispanic
- 270.3%Black alone
- 50.06%American Indian alone
- 50.06%Native Hawaiian and Other
Pacific Islander alone - 40.04%Other race alone

2000
2022
-
- 1,230,29796.5%White alone
- 11,7310.9%Two or more races
- 9,3600.7%Hispanic
- 9,0140.7%Asian alone
- 6,4400.5%Black alone
- 6,9110.5%American Indian alone
- 8360.07%Other race alone
- 3340.03%Native Hawaiian and Other
Pacific Islander alone

-
- 1,249,23390.2%White alone
- 58,3574.2%Two or more races
- 28,7172.1%Hispanic
- 21,5831.6%Black alone
- 16,1511.2%Asian alone
- 5,8730.4%Other race alone
- 5,2050.4%American Indian alone
- 2210.02%Native Hawaiian and Other
Pacific Islander alone

Income and house value in Cape Elizabeth
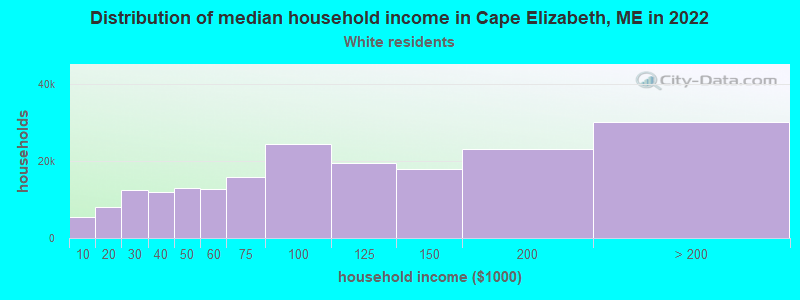
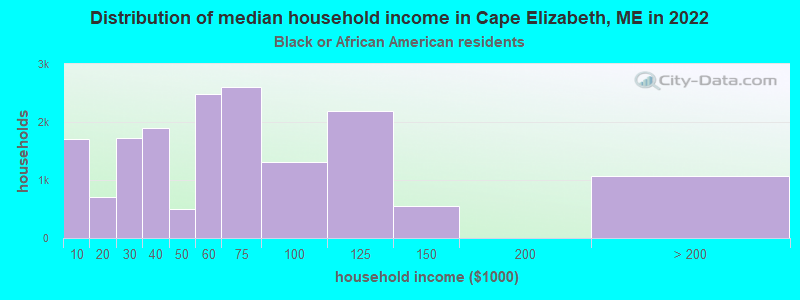
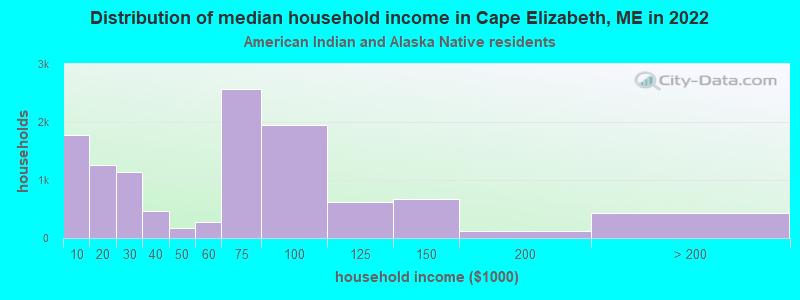
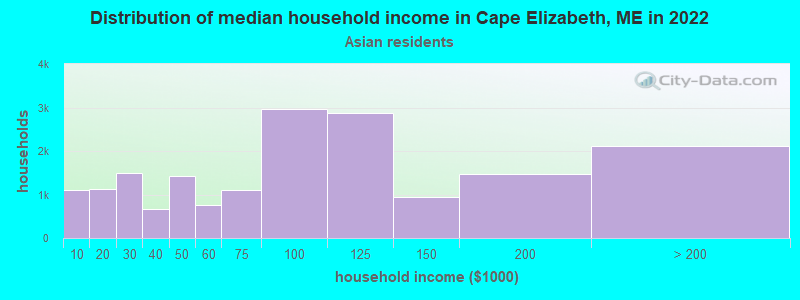
- Median household income in 2022
- $150,396White non-Hispanic householders
- $131,578Black householders
- over $200,000American Indian and Alaska Native householders
- over $200,000Asian householders
- $102,503Two or more races householders
- Median 2022 house value
- $632,441White Non-Hispanic householders
- $406,179Black or African American householders
- $468,538American Indian or Alaska Native householders
- over $1,000,000Asian householders
- $183,326Two or more races householders
Household income for White non-Hispanic householders
Household income for Black householders
Household income for American Indian and Alaska Native householders
Household income for Asian householders
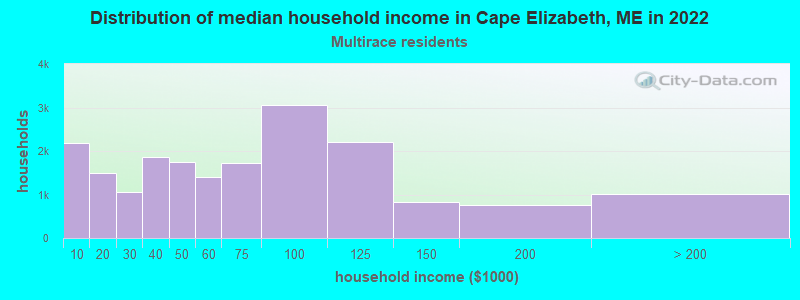
Household income for Two or more races householders
Foreign-born residents in Cape Elizabeth
271 residents are foreign born (1.8% Europe, 0.6% Asia, 0.4% North America).
| This city: | 3.0% |
| Maine: | 2.9% |
Ancestries in Cape Elizabeth

- 2,45021.3%English
- 2,31120.1%Irish
- 9998.7%Other
- 9318.1%Italian
- 8847.7%German
- 6595.7%French
- 5885.1%Scottish
- 4523.9%United States
- 3423.0%Polish
- 3092.7%Scotch-Irish
- 2642.3%Swedish
- 2622.3%French Canadian
- 2031.8%Dutch
- 1761.5%Russian
- 1040.9%Czech
- 980.9%Danish
- 940.8%Norwegian
- 630.5%Hungarian
- 520.5%Portuguese
- 510.4%Welsh
- 500.4%Greek
- 440.4%Lithuanian
- 310.3%Slovak
- 310.3%Ukrainian
- 270.2%Arab
- 200.2%Swiss
- 60.05%West Indian

Zip codes: 04107.