Races in Cape May Court House, New Jersey (NJ) Detailed Stats
Data:
Races - White alone (%)
Races - White alone (% change since 2000)
Races - Black alone (%)
Races - Black alone (% change since 2000)
Races - American Indian alone (%)
Races - American Indian alone (% change since 2000)
Races - Asian alone (%)
Races - Asian alone (% change since 2000)
Races - Hispanic (%)
Races - Hispanic (% change since 2000)
Races - Native Hawaiian and Other Pacific Islander alone (%)
Races - Native Hawaiian and Other Pacific Islander alone (% change since 2000)
Races - Two or more races(%)
Races - Two or more races(% change since 2000)
Races - Other race alone (%)
Races - Other race alone (% change since 2000)
Racial diversity
Place of birth - Born in state of residence (%)
Place of birth - Born in state of residence (%) - White
Place of birth - Born in state of residence (%) - Black or African American
Place of birth - Born in state of residence (%) - Asian
Place of birth - Born in state of residence (%) - Hispanic or Latino
Place of birth - Born in state of residence (%) - American Indian and Alaska Native
Place of birth - Born in state of residence (%) - Multirace
Place of birth - Born in state of residence (%) - Other Race
Place of birth - Born in other state (%)
Place of birth - Born in other state (%) - White
Place of birth - Born in other state (%) - Black or African American
Place of birth - Born in other state (%) - Asian
Place of birth - Born in other state (%) - Hispanic or Latino
Place of birth - Born in other state (%) - American Indian and Alaska Native
Place of birth - Born in other state (%) - Multirace
Place of birth - Born in other state (%) - Other Race
Place of birth - Native, outside of US (%)
Place of birth - Native, outside of US (%) - White
Place of birth - Native, outside of US (%) - Black or African American
Place of birth - Native, outside of US (%) - Asian
Place of birth - Native, outside of US (%) - Hispanic or Latino
Place of birth - Native, outside of US (%) - American Indian and Alaska Native
Place of birth - Native, outside of US (%) - Multirace
Place of birth - Native, outside of US (%) - Other Race
Place of birth - Foreign born (%)
Place of birth - Foreign born (%) - White
Place of birth - Foreign born (%) - Black or African American
Place of birth - Foreign born (%) - Asian
Place of birth - Foreign born (%) - Hispanic or Latino
Place of birth - Foreign born (%) - American Indian and Alaska Native
Place of birth - Foreign born (%) - Multirace
Place of birth - Foreign born (%) - Other Race
Residents speaking English at home (%)
Residents speaking English at home - Born in the United States (%)
Residents speaking English at home - Native, born elsewhere (%)
Residents speaking English at home - Foreign born (%)
Residents speaking Spanish at home (%)
Residents speaking Spanish at home - Born in the United States (%)
Residents speaking Spanish at home - Native, born elsewhere (%)
Residents speaking Spanish at home - Foreign born (%)
Residents speaking other language at home (%)
Residents speaking other language at home - Born in the United States (%)
Residents speaking other language at home - Native, born elsewhere (%)
Residents speaking other language at home - Foreign born (%)
Marital status - Never married (%)
Marital status - Now married (%)
Marital status - Separated (%)
Marital status - Widowed (%)
Marital status - Divorced (%)
Ancestries Reported - Arab (%)
Ancestries Reported - Czech (%)
Ancestries Reported - Danish (%)
Ancestries Reported - Dutch (%)
Ancestries Reported - English (%)
Ancestries Reported - French (%)
Ancestries Reported - French Canadian (%)
Ancestries Reported - German (%)
Ancestries Reported - Greek (%)
Ancestries Reported - Hungarian (%)
Ancestries Reported - Irish (%)
Ancestries Reported - Italian (%)
Ancestries Reported - Lithuanian (%)
Ancestries Reported - Norwegian (%)
Ancestries Reported - Polish (%)
Ancestries Reported - Portuguese (%)
Ancestries Reported - Russian (%)
Ancestries Reported - Scotch-Irish (%)
Ancestries Reported - Scottish (%)
Ancestries Reported - Slovak (%)
Ancestries Reported - Subsaharan African (%)
Ancestries Reported - Swedish (%)
Ancestries Reported - Swiss (%)
Ancestries Reported - Ukrainian (%)
Ancestries Reported - United States (%)
Ancestries Reported - Welsh (%)
Ancestries Reported - West Indian (%)
Ancestries Reported - Other (%)
Geographical mobility - Same house 1 year ago (%)
Geographical mobility - Same house 1 year ago (%) - White
Geographical mobility - Same house 1 year ago (%) - Black or African American
Geographical mobility - Same house 1 year ago (%) - Asian
Geographical mobility - Same house 1 year ago (%) - Hispanic or Latino
Geographical mobility - Same house 1 year ago (%) - American Indian and Alaska Native
Geographical mobility - Same house 1 year ago (%) - Multirace
Geographical mobility - Same house 1 year ago (%) - Other Race
Geographical mobility - Moved within same county (%)
Geographical mobility - Moved within same county (%) - White
Geographical mobility - Moved within same county (%) - Black or African American
Geographical mobility - Moved within same county (%) - Asian
Geographical mobility - Moved within same county (%) - Hispanic or Latino
Geographical mobility - Moved within same county (%) - American Indian and Alaska Native
Geographical mobility - Moved within same county (%) - Multirace
Geographical mobility - Moved within same county (%) - Other Race
Geographical mobility - Moved from different county within same state (%)
Geographical mobility - Moved from different county within same state (%) - White
Geographical mobility - Moved from different county within same state (%) - Black or African American
Geographical mobility - Moved from different county within same state (%) - Asian
Geographical mobility - Moved from different county within same state (%) - Hispanic or Latino
Geographical mobility - Moved from different county within same state (%) - American Indian and Alaska Native
Geographical mobility - Moved from different county within same state (%) - Multirace
Geographical mobility - Moved from different county within same state (%) - Other Race
Geographical mobility - Moved from different state (%)
Geographical mobility - Moved from different state (%) - White
Geographical mobility - Moved from different state (%) - Black or African American
Geographical mobility - Moved from different state (%) - Asian
Geographical mobility - Moved from different state (%) - Hispanic or Latino
Geographical mobility - Moved from different state (%) - American Indian and Alaska Native
Geographical mobility - Moved from different state (%) - Multirace
Geographical mobility - Moved from different state (%) - Other Race
Geographical mobility - Moved from abroad (%)
Geographical mobility - Moved from abroad (%) - White
Geographical mobility - Moved from abroad (%) - Black or African American
Geographical mobility - Moved from abroad (%) - Asian
Geographical mobility - Moved from abroad (%) - Hispanic or Latino
Geographical mobility - Moved from abroad (%) - American Indian and Alaska Native
Geographical mobility - Moved from abroad (%) - Multirace
Geographical mobility - Moved from abroad (%) - Other Race
Place of birth for the foreign-born population - Ireland (%)
Place of birth for the foreign-born population - Denmark (%)
Place of birth for the foreign-born population - Norway (%)
Place of birth for the foreign-born population - Sweden (%)
Place of birth for the foreign-born population - United Kingdom (%)
Place of birth for the foreign-born population - England (%)
Place of birth for the foreign-born population - Scotland (%)
Place of birth for the foreign-born population - Other Northern Europe (%)
Place of birth for the foreign-born population - Austria (%)
Place of birth for the foreign-born population - Belgium (%)
Place of birth for the foreign-born population - France (%)
Place of birth for the foreign-born population - Germany (%)
Place of birth for the foreign-born population - Netherlands (%)
Place of birth for the foreign-born population - Switzerland (%)
Place of birth for the foreign-born population - Other Western Europe (%)
Place of birth for the foreign-born population - Greece (%)
Place of birth for the foreign-born population - Italy (%)
Place of birth for the foreign-born population - Portugal (%)
Place of birth for the foreign-born population - Spain (%)
Place of birth for the foreign-born population - Other Southern Europe (%)
Place of birth for the foreign-born population - Albania (%)
Place of birth for the foreign-born population - Belarus (%)
Place of birth for the foreign-born population - Bosnia and Herzegovina (%)
Place of birth for the foreign-born population - Bulgaria (%)
Place of birth for the foreign-born population - Croatia (%)
Place of birth for the foreign-born population - Czechoslovakia (%)
Place of birth for the foreign-born population - Hungary (%)
Place of birth for the foreign-born population - Latvia (%)
Place of birth for the foreign-born population - Lithuania (%)
Place of birth for the foreign-born population - North Macedonia (Macedonia) (%)
Place of birth for the foreign-born population - Moldova (%)
Place of birth for the foreign-born population - Poland (%)
Place of birth for the foreign-born population - Romania (%)
Place of birth for the foreign-born population - Russia (%)
Place of birth for the foreign-born population - Serbia (%)
Place of birth for the foreign-born population - Ukraine (%)
Place of birth for the foreign-born population - Other Eastern Europe (%)
Place of birth for the foreign-born population - China (%)
Place of birth for the foreign-born population - Hong Kong (%)
Place of birth for the foreign-born population - Taiwan (%)
Place of birth for the foreign-born population - Japan (%)
Place of birth for the foreign-born population - Korea (%)
Place of birth for the foreign-born population - Other Eastern Asia (%)
Place of birth for the foreign-born population - Afghanistan (%)
Place of birth for the foreign-born population - Bangladesh (%)
Place of birth for the foreign-born population - India (%)
Place of birth for the foreign-born population - Iran (%)
Place of birth for the foreign-born population - Kazakhstan (%)
Place of birth for the foreign-born population - Nepal (%)
Place of birth for the foreign-born population - Pakistan (%)
Place of birth for the foreign-born population - Sri Lanka (%)
Place of birth for the foreign-born population - Uzbekistan (%)
Place of birth for the foreign-born population - Other South Central Asia (%)
Place of birth for the foreign-born population - Burma (%)
Place of birth for the foreign-born population - Cambodia (%)
Place of birth for the foreign-born population - Indonesia (%)
Place of birth for the foreign-born population - Laos (%)
Place of birth for the foreign-born population - Malaysia (%)
Place of birth for the foreign-born population - Philippines (%)
Place of birth for the foreign-born population - Singapore (%)
Place of birth for the foreign-born population - Thailand (%)
Place of birth for the foreign-born population - Vietnam (%)
Place of birth for the foreign-born population - Other South Eastern Asia (%)
Place of birth for the foreign-born population - Armenia (%)
Place of birth for the foreign-born population - Iraq (%)
Place of birth for the foreign-born population - Israel (%)
Place of birth for the foreign-born population - Jordan (%)
Place of birth for the foreign-born population - Kuwait (%)
Place of birth for the foreign-born population - Lebanon (%)
Place of birth for the foreign-born population - Saudi Arabia (%)
Place of birth for the foreign-born population - Syria (%)
Place of birth for the foreign-born population - Turkey (%)
Place of birth for the foreign-born population - Yemen (%)
Place of birth for the foreign-born population - Other Western Asia (%)
Place of birth for the foreign-born population - Eritrea (%)
Place of birth for the foreign-born population - Ethiopia (%)
Place of birth for the foreign-born population - Kenya (%)
Place of birth for the foreign-born population - Somalia (%)
Place of birth for the foreign-born population - Uganda (%)
Place of birth for the foreign-born population - Zimbabwe (%)
Place of birth for the foreign-born population - Other Eastern Africa (%)
Place of birth for the foreign-born population - Cameroon (%)
Place of birth for the foreign-born population - Congo (%)
Place of birth for the foreign-born population - Democratic Republic of Congo (Zaire) (%)
Place of birth for the foreign-born population - Other Middle Africa (%)
Place of birth for the foreign-born population - Egypt (%)
Place of birth for the foreign-born population - Morocco (%)
Place of birth for the foreign-born population - Sudan (%)
Place of birth for the foreign-born population - Other Northern Africa (%)
Place of birth for the foreign-born population - South Africa (%)
Place of birth for the foreign-born population - Other Southern Africa (%)
Place of birth for the foreign-born population - Cabo Verde (%)
Place of birth for the foreign-born population - Ghana (%)
Place of birth for the foreign-born population - Liberia (%)
Place of birth for the foreign-born population - Nigeria (%)
Place of birth for the foreign-born population - Senegal (%)
Place of birth for the foreign-born population - Sierra Leone (%)
Place of birth for the foreign-born population - Other Western Africa (%)
Place of birth for the foreign-born population - Australia (%)
Place of birth for the foreign-born population - New Zealand (%)
Place of birth for the foreign-born population - Fiji (%)
Place of birth for the foreign-born population - Micronesia (%)
Place of birth for the foreign-born population - Bahamas (%)
Place of birth for the foreign-born population - Barbados (%)
Place of birth for the foreign-born population - Cuba (%)
Place of birth for the foreign-born population - Dominica (%)
Place of birth for the foreign-born population - Dominican Republic (%)
Place of birth for the foreign-born population - Grenada (%)
Place of birth for the foreign-born population - Haiti (%)
Place of birth for the foreign-born population - Jamaica (%)
Place of birth for the foreign-born population - St. Vincent and the Grenadines (%)
Place of birth for the foreign-born population - Trinidad and Tobago (%)
Place of birth for the foreign-born population - West Indies (%)
Place of birth for the foreign-born population - Other Caribbean (%)
Place of birth for the foreign-born population - Belize (%)
Place of birth for the foreign-born population - Costa Rica (%)
Place of birth for the foreign-born population - El Salvador (%)
Place of birth for the foreign-born population - Guatemala (%)
Place of birth for the foreign-born population - Honduras (%)
Place of birth for the foreign-born population - Mexico (%)
Place of birth for the foreign-born population - Nicaragua (%)
Place of birth for the foreign-born population - Panama (%)
Place of birth for the foreign-born population - Other Central America (%)
Place of birth for the foreign-born population - Argentina (%)
Place of birth for the foreign-born population - Bolivia (%)
Place of birth for the foreign-born population - Brazil (%)
Place of birth for the foreign-born population - Chile (%)
Place of birth for the foreign-born population - Colombia (%)
Place of birth for the foreign-born population - Ecuador (%)
Place of birth for the foreign-born population - Guyana (%)
Place of birth for the foreign-born population - Peru (%)
Place of birth for the foreign-born population - Uruguay (%)
Place of birth for the foreign-born population - Venezuela (%)
Place of birth for the foreign-born population - Other South America (%)
Place of birth for the foreign-born population - Canada (%)
Place of birth for the foreign-born population - Other Northern America (%)
Place of birth for the foreign-born population - Other (%)
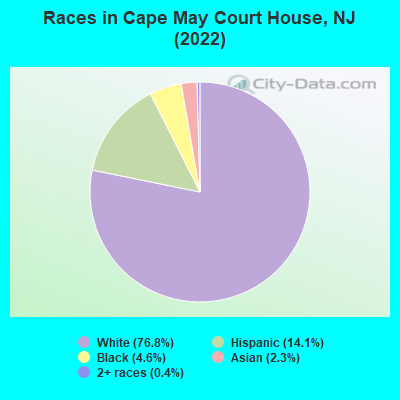
According to 2022 data, the most numerous races in Cape May Court House, NJ are White alone (4,271 residents), Hispanic (784 residents), and Black alone (255 residents). 84.2% of Cape May Court House residents speak English at home. 4.8% of Cape May Court House, NJ residents are foreign-born (1.9% born in Asia, 1.8% born in Latin America, 1.0% born in Europe), which is 379.6% less than the foreign-born rate of 23.0% across the entire state of New Jersey.
Race distribution in Cape May Court House
2000 2022
5,557,209 66.0% White alone 1,117,191 13.3% Hispanic 1,096,171 13.0% Black alone 477,012 5.7% Asian alone 133,689 1.6% Two or more races 19,565 0.2% Other race alone 11,338 0.1% American Indian alone 2,175 0.03% Native Hawaiian and Other
4,766,476 51.5% White alone 2,028,470 21.9% Hispanic 1,111,632 12.0% Black alone 923,546 10.0% Asian alone 332,237 3.6% Two or more races 89,847 1.0% Other race alone 8,557 0.09% American Indian alone 934 0.01% Native Hawaiian and Other
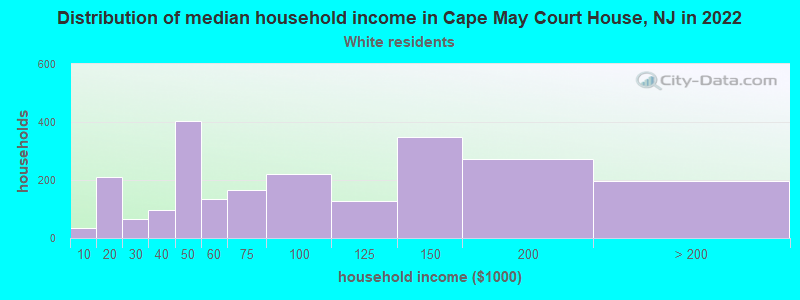
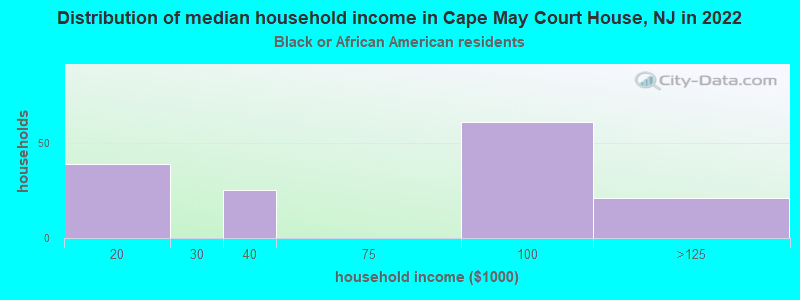
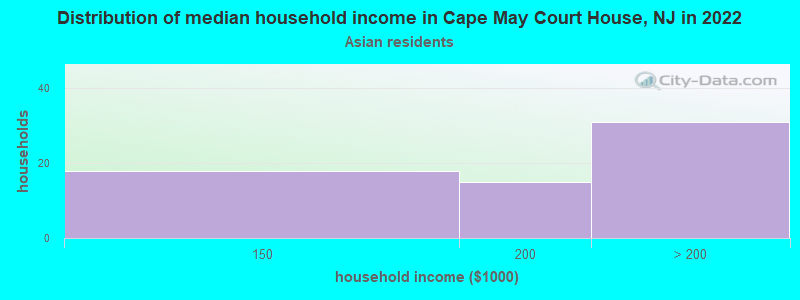
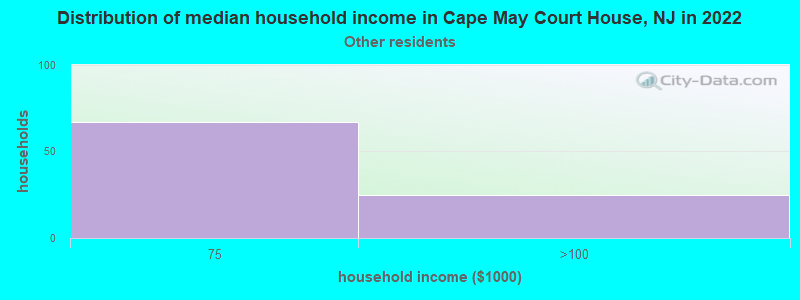
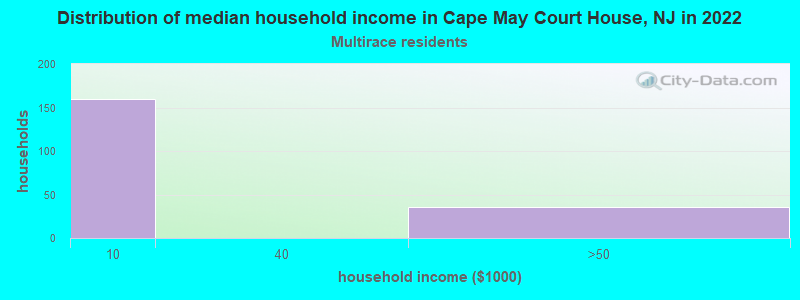
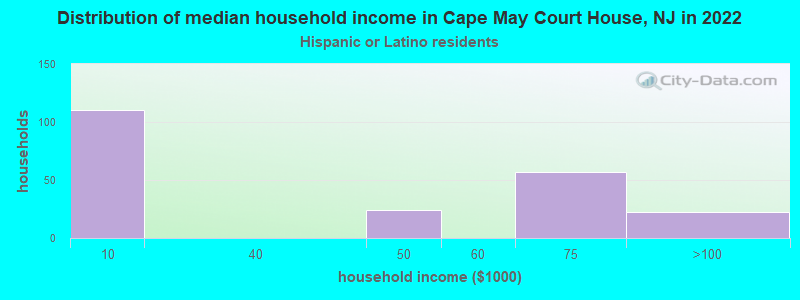
Income and house value in Cape May Court House Median household income in 2022 $70,891 White non-Hispanic householdersMedian 2022 house value $433,159 White Non-Hispanic householders$301,342 Black or African American householders $693,734 Asian householders$441,652 Two or more races householders$382,199 Hispanic or Latino householders
Median age by race in Cape May Court House
51.7 Median age for White residents48.6 56.8 59.7 Median age for Black or African American residents28.8 55.7 -676,272,813.9 Median age for American Indian / Alaska Native residents-666,666,666.0 -688,298,917.7 47.0 Median age for Asian residents-365,805,168.6 55.4 -666,666,666.0 Median age for Native Hawaiian / Pacific Islander residents-666,666,666.0 -666,666,666.0 45.3 Median age for Other race residents29.5 44.3 26.7 Median age for Two or more races residents6.3 -1,369,817,577.4 53.4 Median age for White alone residents49.3 57.5 26.0 Median age for Hispanic or Latino residents14.7 30.3
Owner/renter occupied households by race in Cape May Court House
House owners and renters - White residents 1,510 63.2% Owner occupied880 36.8% Renter occupiedHouse owners and renters - Black or African American residents 73 49.3% Owner occupied75 50.7% Renter occupiedHouse owners and renters - Asian residents 68 100.0% Owner occupiedHouse owners and renters - Other race residents 178 100.0% Owner occupiedHouse owners and renters - Two or more races residents 335 100.0% Renter occupiedHouse owners and renters - White alone residents 1,523 62.5% Owner occupied915 37.5% Renter occupiedHouse owners and renters - Hispanic or Latino residents 124 49.4% Owner occupied127 50.6% Renter occupied
Language usage in Cape May Court House
English speakers - Total 84.2% of residents of Cape May Court House speak English at home.
9.6% of residents speak Spanish at home 135 26.1% Speak English very well383 73.9% Speak English less than very well8.6% of residents speak other language at home 300 64.8% Speak English very well163 35.2% Speak English less than very well
English speakers - Born in the United States 85.4% of residents of Cape May Court House speak English at home.
15.8% of residents speak Spanish at home 111 31.3% Speak English very well244 68.7% Speak English less than very well2.7% of residents speak other language at home 61 100.0% Speak English very well
English speakers - Native, born elsewhere 13.2% of residents of Cape May Court House speak English at home.
104.1% of residents speak Spanish at home 23 18.3% Speak English very well103 81.7% Speak English less than very well
English speakers - Foreign-born 16.1% of residents of Cape May Court House speak English at home.
19.2% of residents speak Spanish at home 56 100.0% Speak English very well65.1% of residents speak other language at home 118 62.1% Speak English very well72 37.9% Speak English less than very well
White (Caucasian) - Speak only English Native:
94.9% (3,976)Foreign-born:
52.3% (45)
White (Caucasian) - Speak another language Native:
5.3% (222)Foreign-born:
35.9% (31)
Asian - Speak only English Native:
100.0% (20)Foreign-born:
16.7% (18)
Other race - Speak another language Native:
96.9% (252)Foreign-born:
98.1% (75)
White alone - Speak only English Native:
95.6% (3,943)Foreign-born:
40.9% (45)
White alone - Speak another language Native:
5.0% (204)Foreign-born:
40.3% (45)
Hispanic or Latino - Speak another language Native:
68.8% (459)Foreign-born:
100.0% (53)
Foreign-born residents in Cape May Court House 267 residents are foreign born (1.9% Asia , 1.8% Latin America , 1.0% Europe ).
This city:
4.8%New Jersey:
23.2%
Marital status for residents in Cape May Court House Marital status - White (Caucasian) population 15 years and over
Males 27.7% Never married57.0% Now married0.0% Separated5.2% Widowed10.1% DivorcedFemales 20.4% Never married48.4% Now married0.2% Separated9.7% Widowed21.4% DivorcedWomen who gave birth in the past 12 months Now married:
46.7% (63)Unmarried:
53.3% (72)
Women who did not give birth in the past 12 months Now married:
27.8% (195)Unmarried:
72.2% (507)
Marital status - Black or African American population 15 years and over
Males 0.0% Never married90.1% Now married4.9% Separated0.0% Widowed4.9% DivorcedFemales 27.3% Never married50.9% Now married0.0% Separated2.5% Widowed19.3% DivorcedWomen who did not give birth in the past 12 months Now married:
100.0% (60)Unmarried:
0.0% (0)
Marital status - Asian population 15 years and over
Males 0.0% Never married100.0% Now married0.0% Separated0.0% Widowed0.0% DivorcedFemales 36.4% Never married55.5% Now married0.0% Separated8.2% Widowed0.0% DivorcedWomen who did not give birth in the past 12 months Now married:
48.1% (37)Unmarried:
51.9% (40)
Marital status - Other race population 15 years and over
Males 42.9% Never married57.1% Now married0.0% Separated0.0% Widowed0.0% DivorcedFemales 31.0% Never married23.9% Now married0.0% Separated0.0% Widowed45.1% DivorcedWomen who did not give birth in the past 12 months Now married:
23.9% (34)Unmarried:
76.1% (109)
Marital status - Two or more races population 15 years and over
Males 19.2% Never married32.7% Now married0.0% Separated0.0% Widowed48.1% DivorcedFemales 100.0% Never married0.0% Now married0.0% Separated0.0% Widowed0.0% DivorcedWomen who did not give birth in the past 12 months Now married:
0.0% (0)Unmarried:
100.0% (189)
Marital status - White alone, not Hispanic / Latino population 15 years and over
Males 28.2% Never married56.3% Now married0.0% Separated5.2% Widowed10.3% DivorcedFemales 20.6% Never married48.6% Now married0.2% Separated9.8% Widowed20.8% DivorcedWomen who gave birth in the past 12 months Now married:
46.7% (64)Unmarried:
53.3% (73)
Women who did not give birth in the past 12 months Now married:
27.1% (194)Unmarried:
72.9% (520)
Marital status - Hispanic or Latino population 15 years and over
Males 30.5% Never married57.0% Now married0.0% Separated0.0% Widowed12.5% DivorcedFemales 59.2% Never married13.3% Now married0.0% Separated0.0% Widowed27.5% DivorcedWomen who did not give birth in the past 12 months Now married:
14.4% (35)Unmarried:
85.6% (208)
Ancestries in Cape May Court House
301 16.3% Irish293 15.9% Italian225 12.2% English153 8.3% German88 4.8% Polish49 2.7% Greek48 2.6% American28 1.5% Ukrainian27 1.5% Swedish25 1.4% Scottish17 0.9% British11 0.6% Brazilian7 0.4% French7 0.4% Russian4 0.2% Welsh
Children Nativity (place of birth) in Cape May Court House
Children under 6 years - Living with two parents Both parents native 96 100.0% NativeOne native, one foreign-born parent 34 100.0% NativeChildren under 6 years - Living with one parent Native parent 131 100.0% NativeChildren 6 to 17 years - Living with two parents Both parents native 533 100.0% NativeOne native, one foreign-born parent 51 100.0% NativeChildren 6 to 17 years - Living with one parent Native parent 121 100.0% NativeForeign-born parent 73 50.5% Native72 49.5% Foreign-born
Grandparents responsible for own grandchildren in Cape May Court House
Grandparents (30 to 59 years) White / Caucasian 19 100.0% Not responsible for grandchildrenWhite alone, not Hispanic / Latino 20 100.0% Not responsible for grandchildrenHispanic or Latino 6 100.0% Not responsible for grandchildren
Grandparents (60 years and over) White / Caucasian 15 100.0% Not responsible for grandchildrenHispanic or Latino 23 100.0% Not responsible for grandchildren