Races in Carpentersville, Illinois (IL) Detailed Stats
Data:
Races - White alone (%)
Races - White alone (% change since 2000)
Races - Black alone (%)
Races - Black alone (% change since 2000)
Races - American Indian alone (%)
Races - American Indian alone (% change since 2000)
Races - Asian alone (%)
Races - Asian alone (% change since 2000)
Races - Hispanic (%)
Races - Hispanic (% change since 2000)
Races - Native Hawaiian and Other Pacific Islander alone (%)
Races - Native Hawaiian and Other Pacific Islander alone (% change since 2000)
Races - Two or more races(%)
Races - Two or more races(% change since 2000)
Races - Other race alone (%)
Races - Other race alone (% change since 2000)
Racial diversity
Place of birth - Born in state of residence (%)
Place of birth - Born in state of residence (%) - White
Place of birth - Born in state of residence (%) - Black or African American
Place of birth - Born in state of residence (%) - Asian
Place of birth - Born in state of residence (%) - Hispanic or Latino
Place of birth - Born in state of residence (%) - American Indian and Alaska Native
Place of birth - Born in state of residence (%) - Multirace
Place of birth - Born in state of residence (%) - Other Race
Place of birth - Born in other state (%)
Place of birth - Born in other state (%) - White
Place of birth - Born in other state (%) - Black or African American
Place of birth - Born in other state (%) - Asian
Place of birth - Born in other state (%) - Hispanic or Latino
Place of birth - Born in other state (%) - American Indian and Alaska Native
Place of birth - Born in other state (%) - Multirace
Place of birth - Born in other state (%) - Other Race
Place of birth - Native, outside of US (%)
Place of birth - Native, outside of US (%) - White
Place of birth - Native, outside of US (%) - Black or African American
Place of birth - Native, outside of US (%) - Asian
Place of birth - Native, outside of US (%) - Hispanic or Latino
Place of birth - Native, outside of US (%) - American Indian and Alaska Native
Place of birth - Native, outside of US (%) - Multirace
Place of birth - Native, outside of US (%) - Other Race
Place of birth - Foreign born (%)
Place of birth - Foreign born (%) - White
Place of birth - Foreign born (%) - Black or African American
Place of birth - Foreign born (%) - Asian
Place of birth - Foreign born (%) - Hispanic or Latino
Place of birth - Foreign born (%) - American Indian and Alaska Native
Place of birth - Foreign born (%) - Multirace
Place of birth - Foreign born (%) - Other Race
Residents speaking English at home (%)
Residents speaking English at home - Born in the United States (%)
Residents speaking English at home - Native, born elsewhere (%)
Residents speaking English at home - Foreign born (%)
Residents speaking Spanish at home (%)
Residents speaking Spanish at home - Born in the United States (%)
Residents speaking Spanish at home - Native, born elsewhere (%)
Residents speaking Spanish at home - Foreign born (%)
Residents speaking other language at home (%)
Residents speaking other language at home - Born in the United States (%)
Residents speaking other language at home - Native, born elsewhere (%)
Residents speaking other language at home - Foreign born (%)
Marital status - Never married (%)
Marital status - Now married (%)
Marital status - Separated (%)
Marital status - Widowed (%)
Marital status - Divorced (%)
Ancestries Reported - Arab (%)
Ancestries Reported - Czech (%)
Ancestries Reported - Danish (%)
Ancestries Reported - Dutch (%)
Ancestries Reported - English (%)
Ancestries Reported - French (%)
Ancestries Reported - French Canadian (%)
Ancestries Reported - German (%)
Ancestries Reported - Greek (%)
Ancestries Reported - Hungarian (%)
Ancestries Reported - Irish (%)
Ancestries Reported - Italian (%)
Ancestries Reported - Lithuanian (%)
Ancestries Reported - Norwegian (%)
Ancestries Reported - Polish (%)
Ancestries Reported - Portuguese (%)
Ancestries Reported - Russian (%)
Ancestries Reported - Scotch-Irish (%)
Ancestries Reported - Scottish (%)
Ancestries Reported - Slovak (%)
Ancestries Reported - Subsaharan African (%)
Ancestries Reported - Swedish (%)
Ancestries Reported - Swiss (%)
Ancestries Reported - Ukrainian (%)
Ancestries Reported - United States (%)
Ancestries Reported - Welsh (%)
Ancestries Reported - West Indian (%)
Ancestries Reported - Other (%)
Geographical mobility - Same house 1 year ago (%)
Geographical mobility - Same house 1 year ago (%) - White
Geographical mobility - Same house 1 year ago (%) - Black or African American
Geographical mobility - Same house 1 year ago (%) - Asian
Geographical mobility - Same house 1 year ago (%) - Hispanic or Latino
Geographical mobility - Same house 1 year ago (%) - American Indian and Alaska Native
Geographical mobility - Same house 1 year ago (%) - Multirace
Geographical mobility - Same house 1 year ago (%) - Other Race
Geographical mobility - Moved within same county (%)
Geographical mobility - Moved within same county (%) - White
Geographical mobility - Moved within same county (%) - Black or African American
Geographical mobility - Moved within same county (%) - Asian
Geographical mobility - Moved within same county (%) - Hispanic or Latino
Geographical mobility - Moved within same county (%) - American Indian and Alaska Native
Geographical mobility - Moved within same county (%) - Multirace
Geographical mobility - Moved within same county (%) - Other Race
Geographical mobility - Moved from different county within same state (%)
Geographical mobility - Moved from different county within same state (%) - White
Geographical mobility - Moved from different county within same state (%) - Black or African American
Geographical mobility - Moved from different county within same state (%) - Asian
Geographical mobility - Moved from different county within same state (%) - Hispanic or Latino
Geographical mobility - Moved from different county within same state (%) - American Indian and Alaska Native
Geographical mobility - Moved from different county within same state (%) - Multirace
Geographical mobility - Moved from different county within same state (%) - Other Race
Geographical mobility - Moved from different state (%)
Geographical mobility - Moved from different state (%) - White
Geographical mobility - Moved from different state (%) - Black or African American
Geographical mobility - Moved from different state (%) - Asian
Geographical mobility - Moved from different state (%) - Hispanic or Latino
Geographical mobility - Moved from different state (%) - American Indian and Alaska Native
Geographical mobility - Moved from different state (%) - Multirace
Geographical mobility - Moved from different state (%) - Other Race
Geographical mobility - Moved from abroad (%)
Geographical mobility - Moved from abroad (%) - White
Geographical mobility - Moved from abroad (%) - Black or African American
Geographical mobility - Moved from abroad (%) - Asian
Geographical mobility - Moved from abroad (%) - Hispanic or Latino
Geographical mobility - Moved from abroad (%) - American Indian and Alaska Native
Geographical mobility - Moved from abroad (%) - Multirace
Geographical mobility - Moved from abroad (%) - Other Race
Place of birth for the foreign-born population - Ireland (%)
Place of birth for the foreign-born population - Denmark (%)
Place of birth for the foreign-born population - Norway (%)
Place of birth for the foreign-born population - Sweden (%)
Place of birth for the foreign-born population - United Kingdom (%)
Place of birth for the foreign-born population - England (%)
Place of birth for the foreign-born population - Scotland (%)
Place of birth for the foreign-born population - Other Northern Europe (%)
Place of birth for the foreign-born population - Austria (%)
Place of birth for the foreign-born population - Belgium (%)
Place of birth for the foreign-born population - France (%)
Place of birth for the foreign-born population - Germany (%)
Place of birth for the foreign-born population - Netherlands (%)
Place of birth for the foreign-born population - Switzerland (%)
Place of birth for the foreign-born population - Other Western Europe (%)
Place of birth for the foreign-born population - Greece (%)
Place of birth for the foreign-born population - Italy (%)
Place of birth for the foreign-born population - Portugal (%)
Place of birth for the foreign-born population - Spain (%)
Place of birth for the foreign-born population - Other Southern Europe (%)
Place of birth for the foreign-born population - Albania (%)
Place of birth for the foreign-born population - Belarus (%)
Place of birth for the foreign-born population - Bosnia and Herzegovina (%)
Place of birth for the foreign-born population - Bulgaria (%)
Place of birth for the foreign-born population - Croatia (%)
Place of birth for the foreign-born population - Czechoslovakia (%)
Place of birth for the foreign-born population - Hungary (%)
Place of birth for the foreign-born population - Latvia (%)
Place of birth for the foreign-born population - Lithuania (%)
Place of birth for the foreign-born population - North Macedonia (Macedonia) (%)
Place of birth for the foreign-born population - Moldova (%)
Place of birth for the foreign-born population - Poland (%)
Place of birth for the foreign-born population - Romania (%)
Place of birth for the foreign-born population - Russia (%)
Place of birth for the foreign-born population - Serbia (%)
Place of birth for the foreign-born population - Ukraine (%)
Place of birth for the foreign-born population - Other Eastern Europe (%)
Place of birth for the foreign-born population - China (%)
Place of birth for the foreign-born population - Hong Kong (%)
Place of birth for the foreign-born population - Taiwan (%)
Place of birth for the foreign-born population - Japan (%)
Place of birth for the foreign-born population - Korea (%)
Place of birth for the foreign-born population - Other Eastern Asia (%)
Place of birth for the foreign-born population - Afghanistan (%)
Place of birth for the foreign-born population - Bangladesh (%)
Place of birth for the foreign-born population - India (%)
Place of birth for the foreign-born population - Iran (%)
Place of birth for the foreign-born population - Kazakhstan (%)
Place of birth for the foreign-born population - Nepal (%)
Place of birth for the foreign-born population - Pakistan (%)
Place of birth for the foreign-born population - Sri Lanka (%)
Place of birth for the foreign-born population - Uzbekistan (%)
Place of birth for the foreign-born population - Other South Central Asia (%)
Place of birth for the foreign-born population - Burma (%)
Place of birth for the foreign-born population - Cambodia (%)
Place of birth for the foreign-born population - Indonesia (%)
Place of birth for the foreign-born population - Laos (%)
Place of birth for the foreign-born population - Malaysia (%)
Place of birth for the foreign-born population - Philippines (%)
Place of birth for the foreign-born population - Singapore (%)
Place of birth for the foreign-born population - Thailand (%)
Place of birth for the foreign-born population - Vietnam (%)
Place of birth for the foreign-born population - Other South Eastern Asia (%)
Place of birth for the foreign-born population - Armenia (%)
Place of birth for the foreign-born population - Iraq (%)
Place of birth for the foreign-born population - Israel (%)
Place of birth for the foreign-born population - Jordan (%)
Place of birth for the foreign-born population - Kuwait (%)
Place of birth for the foreign-born population - Lebanon (%)
Place of birth for the foreign-born population - Saudi Arabia (%)
Place of birth for the foreign-born population - Syria (%)
Place of birth for the foreign-born population - Turkey (%)
Place of birth for the foreign-born population - Yemen (%)
Place of birth for the foreign-born population - Other Western Asia (%)
Place of birth for the foreign-born population - Eritrea (%)
Place of birth for the foreign-born population - Ethiopia (%)
Place of birth for the foreign-born population - Kenya (%)
Place of birth for the foreign-born population - Somalia (%)
Place of birth for the foreign-born population - Uganda (%)
Place of birth for the foreign-born population - Zimbabwe (%)
Place of birth for the foreign-born population - Other Eastern Africa (%)
Place of birth for the foreign-born population - Cameroon (%)
Place of birth for the foreign-born population - Congo (%)
Place of birth for the foreign-born population - Democratic Republic of Congo (Zaire) (%)
Place of birth for the foreign-born population - Other Middle Africa (%)
Place of birth for the foreign-born population - Egypt (%)
Place of birth for the foreign-born population - Morocco (%)
Place of birth for the foreign-born population - Sudan (%)
Place of birth for the foreign-born population - Other Northern Africa (%)
Place of birth for the foreign-born population - South Africa (%)
Place of birth for the foreign-born population - Other Southern Africa (%)
Place of birth for the foreign-born population - Cabo Verde (%)
Place of birth for the foreign-born population - Ghana (%)
Place of birth for the foreign-born population - Liberia (%)
Place of birth for the foreign-born population - Nigeria (%)
Place of birth for the foreign-born population - Senegal (%)
Place of birth for the foreign-born population - Sierra Leone (%)
Place of birth for the foreign-born population - Other Western Africa (%)
Place of birth for the foreign-born population - Australia (%)
Place of birth for the foreign-born population - New Zealand (%)
Place of birth for the foreign-born population - Fiji (%)
Place of birth for the foreign-born population - Micronesia (%)
Place of birth for the foreign-born population - Bahamas (%)
Place of birth for the foreign-born population - Barbados (%)
Place of birth for the foreign-born population - Cuba (%)
Place of birth for the foreign-born population - Dominica (%)
Place of birth for the foreign-born population - Dominican Republic (%)
Place of birth for the foreign-born population - Grenada (%)
Place of birth for the foreign-born population - Haiti (%)
Place of birth for the foreign-born population - Jamaica (%)
Place of birth for the foreign-born population - St. Vincent and the Grenadines (%)
Place of birth for the foreign-born population - Trinidad and Tobago (%)
Place of birth for the foreign-born population - West Indies (%)
Place of birth for the foreign-born population - Other Caribbean (%)
Place of birth for the foreign-born population - Belize (%)
Place of birth for the foreign-born population - Costa Rica (%)
Place of birth for the foreign-born population - El Salvador (%)
Place of birth for the foreign-born population - Guatemala (%)
Place of birth for the foreign-born population - Honduras (%)
Place of birth for the foreign-born population - Mexico (%)
Place of birth for the foreign-born population - Nicaragua (%)
Place of birth for the foreign-born population - Panama (%)
Place of birth for the foreign-born population - Other Central America (%)
Place of birth for the foreign-born population - Argentina (%)
Place of birth for the foreign-born population - Bolivia (%)
Place of birth for the foreign-born population - Brazil (%)
Place of birth for the foreign-born population - Chile (%)
Place of birth for the foreign-born population - Colombia (%)
Place of birth for the foreign-born population - Ecuador (%)
Place of birth for the foreign-born population - Guyana (%)
Place of birth for the foreign-born population - Peru (%)
Place of birth for the foreign-born population - Uruguay (%)
Place of birth for the foreign-born population - Venezuela (%)
Place of birth for the foreign-born population - Other South America (%)
Place of birth for the foreign-born population - Canada (%)
Place of birth for the foreign-born population - Other Northern America (%)
Place of birth for the foreign-born population - Other (%)
Latest news about races in Carpentersville, IL collected exclusively by city-data.com from local newspapers, TV, and radio stations
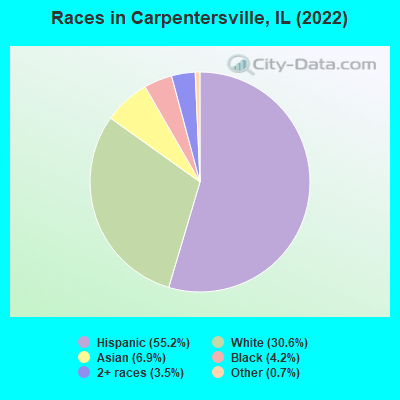
According to 2022 data, the most numerous races in Carpentersville, IL are White alone (11,525 residents), Hispanic (20,744 residents), and Black alone (1,584 residents). 42.9% of Carpentersville residents speak English at home. 28.1% of Carpentersville, IL residents are foreign-born (21.4% born in Latin America, 4.5% born in Asia), which is 50.2% greater than the foreign-born rate of 14.0% across the entire state of Illinois.
Race distribution in Carpentersville
2000 2022
8,424,140 67.8% White alone 1,856,152 14.9% Black alone 1,530,262 12.3% Hispanic 419,916 3.4% Asian alone 153,996 1.2% Two or more races 13,479 0.1% Other race alone 18,232 0.1% American Indian alone 3,116 0.03% Native Hawaiian and Other
7,356,301 58.5% White alone 2,299,726 18.3% Hispanic 1,660,423 13.2% Black alone 747,296 5.9% Asian alone 458,599 3.6% Two or more races 45,386 0.4% Other race alone 10,405 0.08% American Indian alone 3,896 0.03% Native Hawaiian and Other
Income and house value in Carpentersville Median household income in 2022 $80,899 White non-Hispanic householders$127,690 Asian householders$85,811 Some other race householders$54,658 Two or more races householders$83,729 Hispanic or Latino race householdersMedian 2022 house value $234,675 White Non-Hispanic householders$235,848 Black or African American householders$195,562 American Indian or Alaska Native householders $352,208 Asian householders$185,784 Native Hawaiian and other Pacific Islander householders$208,861 Some other race householders$210,816 Two or more races householders$210,229 Hispanic or Latino householders
Median age by race in Carpentersville
40.8 Median age for White residents39.7 42.4 30.1 Median age for Black or African American residents20.2 32.8 28.6 Median age for American Indian / Alaska Native residents20.9 29.4 40.3 Median age for Asian residents34.1 40.8 49.0 Median age for Native Hawaiian / Pacific Islander residents63.2 43.3 28.0 Median age for Other race residents29.1 25.4 26.4 Median age for Two or more races residents34.1 20.0 44.1 Median age for White alone residents43.3 44.6 29.5 Median age for Hispanic or Latino residents30.5 28.4
Owner/renter occupied households by race in Carpentersville
House owners and renters - White residents 4,707 79.6% Owner occupied1,203 20.4% Renter occupiedHouse owners and renters - Black or African American residents 161 27.2% Owner occupied432 72.8% Renter occupiedHouse owners and renters - American Indian / Alaska Native residents 244 94.0% Owner occupied16 6.0% Renter occupiedHouse owners and renters - Asian residents 621 83.3% Owner occupied124 16.7% Renter occupiedHouse owners and renters - Native Hawaiian / Pacific Islander residents 18 100.0% Owner occupiedHouse owners and renters - Other race residents 2,140 66.1% Owner occupied1,095 33.9% Renter occupiedHouse owners and renters - Two or more races residents 1,321 81.7% Owner occupied296 18.3% Renter occupiedHouse owners and renters - White alone residents 3,806 79.8% Owner occupied963 20.2% Renter occupiedHouse owners and renters - Hispanic or Latino residents 3,851 71.4% Owner occupied1,539 28.6% Renter occupied
Language usage in Carpentersville
English speakers - Total 42.9% of residents of Carpentersville speak English at home.
47.2% of residents speak Spanish at home 10,070 60.9% Speak English very well6,461 39.1% Speak English less than very well10.3% of residents speak other language at home 2,263 63.0% Speak English very well1,329 37.0% Speak English less than very well
English speakers - Born in the United States 61.0% of residents of Carpentersville speak English at home.
34.2% of residents speak Spanish at home 1,212 93.9% Speak English very well79 6.1% Speak English less than very well3.5% of residents speak other language at home 132 100.0% Speak English very well
English speakers - Native, born elsewhere 5.8% of residents of Carpentersville speak English at home.
87.9% of residents speak Spanish at home 340 75.2% Speak English very well112 24.8% Speak English less than very well7.8% of residents speak other language at home 40 100.0% Speak English less than very well
English speakers - Foreign-born 6.1% of residents of Carpentersville speak English at home.
71.4% of residents speak Spanish at home 2,015 25.9% Speak English very well5,763 74.1% Speak English less than very well21.8% of residents speak other language at home 1,270 53.5% Speak English very well1,102 46.5% Speak English less than very well
White (Caucasian) - Speak only English Native:
81.1% (10,101)Foreign-born:
10.6% (154)
White (Caucasian) - Speak another language Native:
11.9% (1,479)Foreign-born:
83.6% (1,219)
Black or African American - Speak another language Native:
0.8% (10)Foreign-born:
81.8% (46)
American Indian / Alaska Native - Speak another language Native:
100.0% (751)Foreign-born:
100.0% (455)
Asian - Speak only English Native:
28.9% (289)Foreign-born:
5.8% (93)
Asian - Speak another language Native:
77.6% (776)Foreign-born:
94.2% (1,514)
Native Hawaiian / Pacific Islander - Speak another language Native:
69.9% (50)Foreign-born:
100.0% (40)
Other race - Speak only English Native:
17.6% (1,249)Foreign-born:
5.6% (329)
Other race - Speak another language Native:
81.1% (5,752)Foreign-born:
93.9% (5,484)
Two or more races - Speak only English Native:
57.6% (1,754)Foreign-born:
15.9% (258)
Two or more races - Speak another language Native:
42.6% (1,297)Foreign-born:
85.4% (1,385)
White alone - Speak only English Native:
90.0% (9,127)Foreign-born:
11.5% (102)
White alone - Speak another language Native:
9.2% (928)Foreign-born:
89.5% (794)
Hispanic or Latino - Speak only English Native:
24.8% (2,722)Foreign-born:
6.5% (538)
Hispanic or Latino - Speak another language Native:
75.1% (8,256)Foreign-born:
93.7% (7,781)
Foreign-born residents in Carpentersville 10,563 residents are foreign born (21.4% Latin America , 4.5% Asia ).
This city:
28.1%Illinois:
14.1%
Marital status for residents in Carpentersville Marital status - White (Caucasian) population 15 years and over
Males 34.4% Never married55.2% Now married0.5% Separated1.9% Widowed8.0% DivorcedFemales 31.3% Never married44.5% Now married2.1% Separated6.4% Widowed15.7% DivorcedWomen who gave birth in the past 12 months Now married:
80.4% (213)Unmarried:
19.6% (52)
Women who did not give birth in the past 12 months Now married:
34.3% (1,064)Unmarried:
65.7% (2,039)
Marital status - Black or African American population 15 years and over
Males 42.7% Never married46.2% Now married0.0% Separated0.0% Widowed11.1% DivorcedFemales 53.9% Never married27.6% Now married8.6% Separated1.0% Widowed8.9% DivorcedWomen who gave birth in the past 12 months Now married:
100.0% (73)Unmarried:
0.0% (0)
Women who did not give birth in the past 12 months Now married:
29.6% (97)Unmarried:
70.4% (231)
Marital status - American Indian / Alaska Native population 15 years and over
Males 28.6% Never married71.4% Now married0.0% Separated0.0% Widowed0.0% DivorcedFemales 65.4% Never married30.6% Now married0.0% Separated0.0% Widowed4.0% DivorcedWomen who did not give birth in the past 12 months Now married:
29.1% (201)Unmarried:
70.9% (491)
Marital status - Asian population 15 years and over
Males 51.1% Never married44.1% Now married0.0% Separated1.9% Widowed3.0% DivorcedFemales 19.6% Never married64.9% Now married0.0% Separated7.6% Widowed7.9% DivorcedWomen who did not give birth in the past 12 months Now married:
58.6% (418)Unmarried:
41.4% (295)
Marital status - Native Hawaiian / Pacific Islander population 15 years and over
Males 0.0% Never married100.0% Now married0.0% Separated0.0% Widowed0.0% DivorcedFemales 47.4% Never married42.1% Now married0.0% Separated0.0% Widowed10.5% DivorcedWomen who did not give birth in the past 12 months Now married:
47.1% (24)Unmarried:
52.9% (27)
Marital status - Other race population 15 years and over
Males 43.1% Never married49.4% Now married2.9% Separated1.9% Widowed2.7% DivorcedFemales 44.5% Never married44.0% Now married2.3% Separated1.6% Widowed7.7% DivorcedWomen who gave birth in the past 12 months Now married:
52.9% (199)Unmarried:
47.1% (177)
Women who did not give birth in the past 12 months Now married:
39.9% (1,537)Unmarried:
60.1% (2,317)
Marital status - Two or more races population 15 years and over
Males 43.4% Never married47.0% Now married1.8% Separated5.5% Widowed2.4% DivorcedFemales 45.3% Never married45.0% Now married0.0% Separated3.8% Widowed5.9% DivorcedWomen who gave birth in the past 12 months Now married:
21.4% (27)Unmarried:
78.6% (100)
Women who did not give birth in the past 12 months Now married:
35.0% (407)Unmarried:
65.0% (756)
Marital status - White alone, not Hispanic / Latino population 15 years and over
Males 31.9% Never married54.3% Now married0.4% Separated2.9% Widowed10.4% DivorcedFemales 26.4% Never married46.5% Now married1.8% Separated6.8% Widowed18.5% DivorcedWomen who gave birth in the past 12 months Now married:
81.5% (159)Unmarried:
18.5% (36)
Women who did not give birth in the past 12 months Now married:
37.2% (892)Unmarried:
62.8% (1,503)
Marital status - Hispanic or Latino population 15 years and over
Males 41.8% Never married51.8% Now married1.7% Separated1.9% Widowed2.7% DivorcedFemales 44.6% Never married43.3% Now married2.0% Separated2.8% Widowed7.2% DivorcedWomen who gave birth in the past 12 months Now married:
53.7% (273)Unmarried:
46.3% (236)
Women who did not give birth in the past 12 months Now married:
37.4% (2,068)Unmarried:
62.6% (3,456)
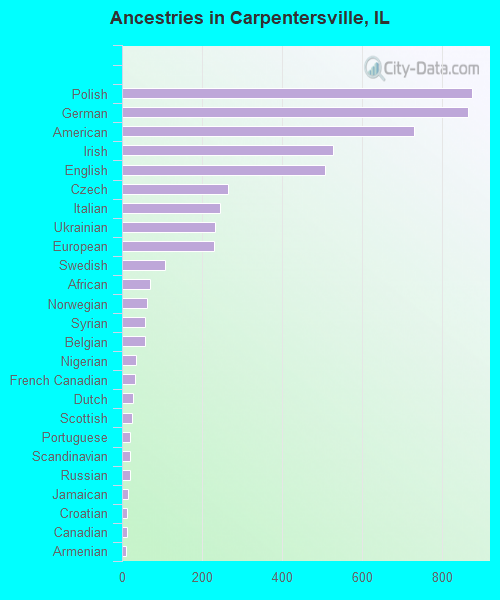
Ancestries in Carpentersville
873 4.0% Polish864 3.9% German730 3.3% American528 2.4% Irish507 2.3% English266 1.2% Czech244 1.1% Italian232 1.1% Ukrainian229 1.0% European108 0.5% Swedish69 0.3% African62 0.3% Norwegian58 0.3% Syrian58 0.3% Belgian35 0.2% Nigerian33 0.2% French Canadian27 0.1% Dutch24 0.1% Scottish21 0.10% Portuguese21 0.10% Scandinavian20 0.09% Russian15 0.07% Jamaican13 0.06% Croatian12 0.05% Canadian11 0.05% Armenian10 0.05% Danish8 0.04% Yugoslavian
Geographical mobility in Carpentersville Same house 1 year ago 13,921 93.1% White (Caucasian)1,430 87.0% Black or African American1,258 99.7% American Indian / Alaska Native2,339 90.2% Asian91 100.0% Native Hawaiian / Pacific Islander13,335 98.6% Other race4,723 88.2% Two or more races10,547 92.4% White alone, not Hispanic / Latino19,619 96.4% Hispanic or LatinoMoved within same county 248 1.7% White / Caucasian44 2.7% Black or African American17 0.7% Asian166 1.2% Other race246 4.6% Two or more races77 0.7% White alone, not Hispanic / Latino516 2.5% Hispanic or LatinoMoved within same state 756 5.1% White / Caucasian158 9.6% Black or African American188 7.3% Asian272 2.0% Other race239 4.5% Two or more races734 6.4% White alone, not Hispanic / Latino448 2.2% Hispanic or LatinoMoved from different state 90 0.6% White / Caucasian6 0.4% Black or African American18 0.7% Asian13 0.1% Other race128 2.4% Two or more races101 0.9% White alone, not Hispanic / Latino11 0.1% Hispanic or LatinoMoved from abroad 16 0.1% White56 2.2% Asian140 1.0% Other race120 0.6% Hispanic or Latino
Children Nativity (place of birth) in Carpentersville
Children under 6 years - Living with two parents Both parents native 849 100.0% NativeBoth parents foreign-born 307 100.0% NativeOne native, one foreign-born parent 786 100.0% NativeChildren under 6 years - Living with one parent Native parent 871 100.0% NativeForeign-born parent 212 100.0% NativeChildren 6 to 17 years - Living with two parents Both parents native 1,215 100.0% NativeBoth parents foreign-born 1,965 90.2% Native213 9.8% Foreign-bornOne native, one foreign-born parent 1,055 99.1% Native10 0.9% Foreign-bornChildren 6 to 17 years - Living with one parent Native parent 1,486 100.0% NativeForeign-born parent 921 51.3% Native872 48.7% Foreign-born
Grandparents responsible for own grandchildren in Carpentersville
Grandparents (30 to 59 years) White / Caucasian 85 100.0% Not responsible for grandchildrenBlack or African American 5 100.0% Not responsible for grandchildrenOther race 11 5.6% Responsible for grandchildren178 94.4% Not responsible for grandchildrenTwo or more races 14 18.8% Responsible for grandchildren60 81.2% Not responsible for grandchildrenWhite alone, not Hispanic / Latino 73 100.0% Not responsible for grandchildrenHispanic or Latino 24 9.9% Responsible for grandchildren217 90.1% Not responsible for grandchildrenGrandparents (60 years and over) White / Caucasian 82 30.6% Responsible for grandchildren186 69.4% Not responsible for grandchildrenBlack or African American 26 100.0% Responsible for grandchildrenOther race 93 38.3% Responsible for grandchildren149 61.7% Not responsible for grandchildrenTwo or more races 69 100.0% Not responsible for grandchildrenWhite alone, not Hispanic / Latino 89 44.6% Responsible for grandchildren110 55.4% Not responsible for grandchildrenHispanic or Latino 65 14.3% Responsible for grandchildren389 85.7% Not responsible for grandchildren