Races in Carpinteria, California (CA) Detailed Stats
Data:
Races - White alone (%)
Races - White alone (% change since 2000)
Races - Black alone (%)
Races - Black alone (% change since 2000)
Races - American Indian alone (%)
Races - American Indian alone (% change since 2000)
Races - Asian alone (%)
Races - Asian alone (% change since 2000)
Races - Hispanic (%)
Races - Hispanic (% change since 2000)
Races - Native Hawaiian and Other Pacific Islander alone (%)
Races - Native Hawaiian and Other Pacific Islander alone (% change since 2000)
Races - Two or more races(%)
Races - Two or more races(% change since 2000)
Races - Other race alone (%)
Races - Other race alone (% change since 2000)
Racial diversity
Place of birth - Born in state of residence (%)
Place of birth - Born in state of residence (%) - White
Place of birth - Born in state of residence (%) - Black or African American
Place of birth - Born in state of residence (%) - Asian
Place of birth - Born in state of residence (%) - Hispanic or Latino
Place of birth - Born in state of residence (%) - American Indian and Alaska Native
Place of birth - Born in state of residence (%) - Multirace
Place of birth - Born in state of residence (%) - Other Race
Place of birth - Born in other state (%)
Place of birth - Born in other state (%) - White
Place of birth - Born in other state (%) - Black or African American
Place of birth - Born in other state (%) - Asian
Place of birth - Born in other state (%) - Hispanic or Latino
Place of birth - Born in other state (%) - American Indian and Alaska Native
Place of birth - Born in other state (%) - Multirace
Place of birth - Born in other state (%) - Other Race
Place of birth - Native, outside of US (%)
Place of birth - Native, outside of US (%) - White
Place of birth - Native, outside of US (%) - Black or African American
Place of birth - Native, outside of US (%) - Asian
Place of birth - Native, outside of US (%) - Hispanic or Latino
Place of birth - Native, outside of US (%) - American Indian and Alaska Native
Place of birth - Native, outside of US (%) - Multirace
Place of birth - Native, outside of US (%) - Other Race
Place of birth - Foreign born (%)
Place of birth - Foreign born (%) - White
Place of birth - Foreign born (%) - Black or African American
Place of birth - Foreign born (%) - Asian
Place of birth - Foreign born (%) - Hispanic or Latino
Place of birth - Foreign born (%) - American Indian and Alaska Native
Place of birth - Foreign born (%) - Multirace
Place of birth - Foreign born (%) - Other Race
Residents speaking English at home (%)
Residents speaking English at home - Born in the United States (%)
Residents speaking English at home - Native, born elsewhere (%)
Residents speaking English at home - Foreign born (%)
Residents speaking Spanish at home (%)
Residents speaking Spanish at home - Born in the United States (%)
Residents speaking Spanish at home - Native, born elsewhere (%)
Residents speaking Spanish at home - Foreign born (%)
Residents speaking other language at home (%)
Residents speaking other language at home - Born in the United States (%)
Residents speaking other language at home - Native, born elsewhere (%)
Residents speaking other language at home - Foreign born (%)
Marital status - Never married (%)
Marital status - Now married (%)
Marital status - Separated (%)
Marital status - Widowed (%)
Marital status - Divorced (%)
Ancestries Reported - Arab (%)
Ancestries Reported - Czech (%)
Ancestries Reported - Danish (%)
Ancestries Reported - Dutch (%)
Ancestries Reported - English (%)
Ancestries Reported - French (%)
Ancestries Reported - French Canadian (%)
Ancestries Reported - German (%)
Ancestries Reported - Greek (%)
Ancestries Reported - Hungarian (%)
Ancestries Reported - Irish (%)
Ancestries Reported - Italian (%)
Ancestries Reported - Lithuanian (%)
Ancestries Reported - Norwegian (%)
Ancestries Reported - Polish (%)
Ancestries Reported - Portuguese (%)
Ancestries Reported - Russian (%)
Ancestries Reported - Scotch-Irish (%)
Ancestries Reported - Scottish (%)
Ancestries Reported - Slovak (%)
Ancestries Reported - Subsaharan African (%)
Ancestries Reported - Swedish (%)
Ancestries Reported - Swiss (%)
Ancestries Reported - Ukrainian (%)
Ancestries Reported - United States (%)
Ancestries Reported - Welsh (%)
Ancestries Reported - West Indian (%)
Ancestries Reported - Other (%)
Geographical mobility - Same house 1 year ago (%)
Geographical mobility - Same house 1 year ago (%) - White
Geographical mobility - Same house 1 year ago (%) - Black or African American
Geographical mobility - Same house 1 year ago (%) - Asian
Geographical mobility - Same house 1 year ago (%) - Hispanic or Latino
Geographical mobility - Same house 1 year ago (%) - American Indian and Alaska Native
Geographical mobility - Same house 1 year ago (%) - Multirace
Geographical mobility - Same house 1 year ago (%) - Other Race
Geographical mobility - Moved within same county (%)
Geographical mobility - Moved within same county (%) - White
Geographical mobility - Moved within same county (%) - Black or African American
Geographical mobility - Moved within same county (%) - Asian
Geographical mobility - Moved within same county (%) - Hispanic or Latino
Geographical mobility - Moved within same county (%) - American Indian and Alaska Native
Geographical mobility - Moved within same county (%) - Multirace
Geographical mobility - Moved within same county (%) - Other Race
Geographical mobility - Moved from different county within same state (%)
Geographical mobility - Moved from different county within same state (%) - White
Geographical mobility - Moved from different county within same state (%) - Black or African American
Geographical mobility - Moved from different county within same state (%) - Asian
Geographical mobility - Moved from different county within same state (%) - Hispanic or Latino
Geographical mobility - Moved from different county within same state (%) - American Indian and Alaska Native
Geographical mobility - Moved from different county within same state (%) - Multirace
Geographical mobility - Moved from different county within same state (%) - Other Race
Geographical mobility - Moved from different state (%)
Geographical mobility - Moved from different state (%) - White
Geographical mobility - Moved from different state (%) - Black or African American
Geographical mobility - Moved from different state (%) - Asian
Geographical mobility - Moved from different state (%) - Hispanic or Latino
Geographical mobility - Moved from different state (%) - American Indian and Alaska Native
Geographical mobility - Moved from different state (%) - Multirace
Geographical mobility - Moved from different state (%) - Other Race
Geographical mobility - Moved from abroad (%)
Geographical mobility - Moved from abroad (%) - White
Geographical mobility - Moved from abroad (%) - Black or African American
Geographical mobility - Moved from abroad (%) - Asian
Geographical mobility - Moved from abroad (%) - Hispanic or Latino
Geographical mobility - Moved from abroad (%) - American Indian and Alaska Native
Geographical mobility - Moved from abroad (%) - Multirace
Geographical mobility - Moved from abroad (%) - Other Race
Place of birth for the foreign-born population - Ireland (%)
Place of birth for the foreign-born population - Denmark (%)
Place of birth for the foreign-born population - Norway (%)
Place of birth for the foreign-born population - Sweden (%)
Place of birth for the foreign-born population - United Kingdom (%)
Place of birth for the foreign-born population - England (%)
Place of birth for the foreign-born population - Scotland (%)
Place of birth for the foreign-born population - Other Northern Europe (%)
Place of birth for the foreign-born population - Austria (%)
Place of birth for the foreign-born population - Belgium (%)
Place of birth for the foreign-born population - France (%)
Place of birth for the foreign-born population - Germany (%)
Place of birth for the foreign-born population - Netherlands (%)
Place of birth for the foreign-born population - Switzerland (%)
Place of birth for the foreign-born population - Other Western Europe (%)
Place of birth for the foreign-born population - Greece (%)
Place of birth for the foreign-born population - Italy (%)
Place of birth for the foreign-born population - Portugal (%)
Place of birth for the foreign-born population - Spain (%)
Place of birth for the foreign-born population - Other Southern Europe (%)
Place of birth for the foreign-born population - Albania (%)
Place of birth for the foreign-born population - Belarus (%)
Place of birth for the foreign-born population - Bosnia and Herzegovina (%)
Place of birth for the foreign-born population - Bulgaria (%)
Place of birth for the foreign-born population - Croatia (%)
Place of birth for the foreign-born population - Czechoslovakia (%)
Place of birth for the foreign-born population - Hungary (%)
Place of birth for the foreign-born population - Latvia (%)
Place of birth for the foreign-born population - Lithuania (%)
Place of birth for the foreign-born population - North Macedonia (Macedonia) (%)
Place of birth for the foreign-born population - Moldova (%)
Place of birth for the foreign-born population - Poland (%)
Place of birth for the foreign-born population - Romania (%)
Place of birth for the foreign-born population - Russia (%)
Place of birth for the foreign-born population - Serbia (%)
Place of birth for the foreign-born population - Ukraine (%)
Place of birth for the foreign-born population - Other Eastern Europe (%)
Place of birth for the foreign-born population - China (%)
Place of birth for the foreign-born population - Hong Kong (%)
Place of birth for the foreign-born population - Taiwan (%)
Place of birth for the foreign-born population - Japan (%)
Place of birth for the foreign-born population - Korea (%)
Place of birth for the foreign-born population - Other Eastern Asia (%)
Place of birth for the foreign-born population - Afghanistan (%)
Place of birth for the foreign-born population - Bangladesh (%)
Place of birth for the foreign-born population - India (%)
Place of birth for the foreign-born population - Iran (%)
Place of birth for the foreign-born population - Kazakhstan (%)
Place of birth for the foreign-born population - Nepal (%)
Place of birth for the foreign-born population - Pakistan (%)
Place of birth for the foreign-born population - Sri Lanka (%)
Place of birth for the foreign-born population - Uzbekistan (%)
Place of birth for the foreign-born population - Other South Central Asia (%)
Place of birth for the foreign-born population - Burma (%)
Place of birth for the foreign-born population - Cambodia (%)
Place of birth for the foreign-born population - Indonesia (%)
Place of birth for the foreign-born population - Laos (%)
Place of birth for the foreign-born population - Malaysia (%)
Place of birth for the foreign-born population - Philippines (%)
Place of birth for the foreign-born population - Singapore (%)
Place of birth for the foreign-born population - Thailand (%)
Place of birth for the foreign-born population - Vietnam (%)
Place of birth for the foreign-born population - Other South Eastern Asia (%)
Place of birth for the foreign-born population - Armenia (%)
Place of birth for the foreign-born population - Iraq (%)
Place of birth for the foreign-born population - Israel (%)
Place of birth for the foreign-born population - Jordan (%)
Place of birth for the foreign-born population - Kuwait (%)
Place of birth for the foreign-born population - Lebanon (%)
Place of birth for the foreign-born population - Saudi Arabia (%)
Place of birth for the foreign-born population - Syria (%)
Place of birth for the foreign-born population - Turkey (%)
Place of birth for the foreign-born population - Yemen (%)
Place of birth for the foreign-born population - Other Western Asia (%)
Place of birth for the foreign-born population - Eritrea (%)
Place of birth for the foreign-born population - Ethiopia (%)
Place of birth for the foreign-born population - Kenya (%)
Place of birth for the foreign-born population - Somalia (%)
Place of birth for the foreign-born population - Uganda (%)
Place of birth for the foreign-born population - Zimbabwe (%)
Place of birth for the foreign-born population - Other Eastern Africa (%)
Place of birth for the foreign-born population - Cameroon (%)
Place of birth for the foreign-born population - Congo (%)
Place of birth for the foreign-born population - Democratic Republic of Congo (Zaire) (%)
Place of birth for the foreign-born population - Other Middle Africa (%)
Place of birth for the foreign-born population - Egypt (%)
Place of birth for the foreign-born population - Morocco (%)
Place of birth for the foreign-born population - Sudan (%)
Place of birth for the foreign-born population - Other Northern Africa (%)
Place of birth for the foreign-born population - South Africa (%)
Place of birth for the foreign-born population - Other Southern Africa (%)
Place of birth for the foreign-born population - Cabo Verde (%)
Place of birth for the foreign-born population - Ghana (%)
Place of birth for the foreign-born population - Liberia (%)
Place of birth for the foreign-born population - Nigeria (%)
Place of birth for the foreign-born population - Senegal (%)
Place of birth for the foreign-born population - Sierra Leone (%)
Place of birth for the foreign-born population - Other Western Africa (%)
Place of birth for the foreign-born population - Australia (%)
Place of birth for the foreign-born population - New Zealand (%)
Place of birth for the foreign-born population - Fiji (%)
Place of birth for the foreign-born population - Micronesia (%)
Place of birth for the foreign-born population - Bahamas (%)
Place of birth for the foreign-born population - Barbados (%)
Place of birth for the foreign-born population - Cuba (%)
Place of birth for the foreign-born population - Dominica (%)
Place of birth for the foreign-born population - Dominican Republic (%)
Place of birth for the foreign-born population - Grenada (%)
Place of birth for the foreign-born population - Haiti (%)
Place of birth for the foreign-born population - Jamaica (%)
Place of birth for the foreign-born population - St. Vincent and the Grenadines (%)
Place of birth for the foreign-born population - Trinidad and Tobago (%)
Place of birth for the foreign-born population - West Indies (%)
Place of birth for the foreign-born population - Other Caribbean (%)
Place of birth for the foreign-born population - Belize (%)
Place of birth for the foreign-born population - Costa Rica (%)
Place of birth for the foreign-born population - El Salvador (%)
Place of birth for the foreign-born population - Guatemala (%)
Place of birth for the foreign-born population - Honduras (%)
Place of birth for the foreign-born population - Mexico (%)
Place of birth for the foreign-born population - Nicaragua (%)
Place of birth for the foreign-born population - Panama (%)
Place of birth for the foreign-born population - Other Central America (%)
Place of birth for the foreign-born population - Argentina (%)
Place of birth for the foreign-born population - Bolivia (%)
Place of birth for the foreign-born population - Brazil (%)
Place of birth for the foreign-born population - Chile (%)
Place of birth for the foreign-born population - Colombia (%)
Place of birth for the foreign-born population - Ecuador (%)
Place of birth for the foreign-born population - Guyana (%)
Place of birth for the foreign-born population - Peru (%)
Place of birth for the foreign-born population - Uruguay (%)
Place of birth for the foreign-born population - Venezuela (%)
Place of birth for the foreign-born population - Other South America (%)
Place of birth for the foreign-born population - Canada (%)
Place of birth for the foreign-born population - Other Northern America (%)
Place of birth for the foreign-born population - Other (%)
Latest news about races in Carpinteria, CA collected exclusively by city-data.com from local newspapers, TV, and radio stations
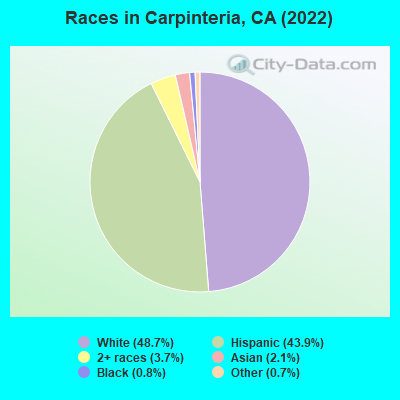
According to 2022 data, the most numerous races in Carpinteria, CA are Hispanic (6,390 residents), White alone (6,213 residents), and Asian alone (356 residents). 60.2% of Carpinteria residents speak English at home. 24.5% of Carpinteria, CA residents are foreign-born (19.9% born in Latin America), which is 6.3% less than the foreign-born rate of 26.0% across the entire state of California.
Race distribution in Carpinteria
2000 2022
15,816,790 46.7% White alone 10,966,556 32.4% Hispanic 3,648,860 10.8% Asian alone 2,181,926 6.4% Black alone 903,115 2.7% Two or more races 178,984 0.5% American Indian alone 103,736 0.3% Native Hawaiian and Other 71,681 0.2% Other race alone
15,732,184 40.3% Hispanic 13,160,426 33.7% White alone 5,957,867 15.3% Asian alone 2,025,218 5.2% Black alone 1,663,222 4.3% Two or more races 251,618 0.6% Other race alone 135,777 0.3% Native Hawaiian and Other 103,030 0.3% American Indian alone
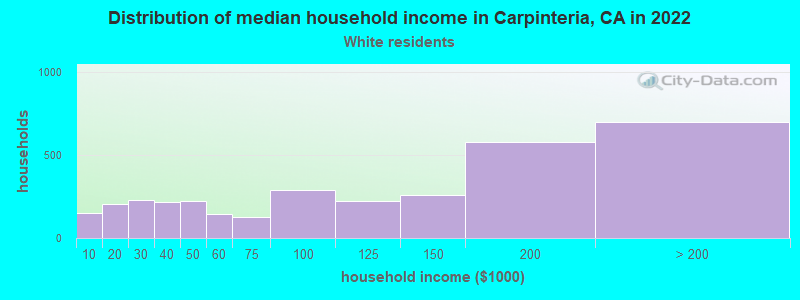
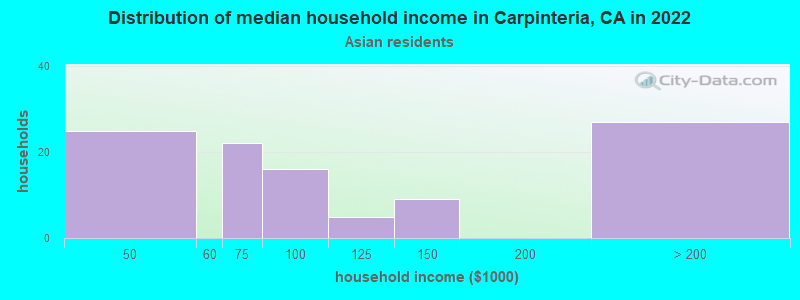
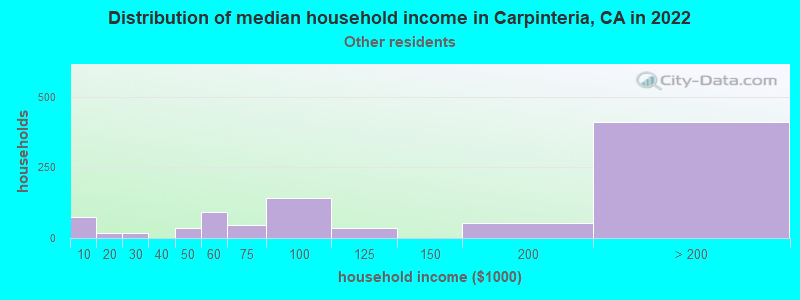
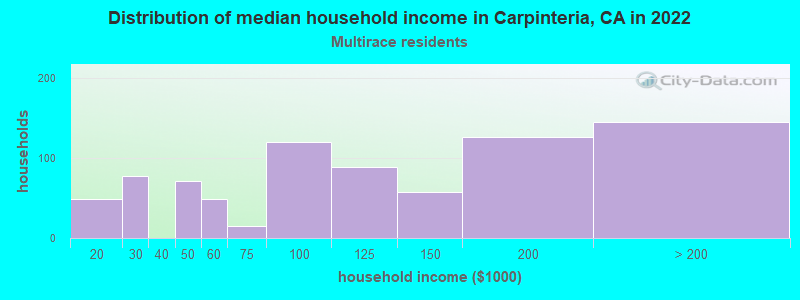
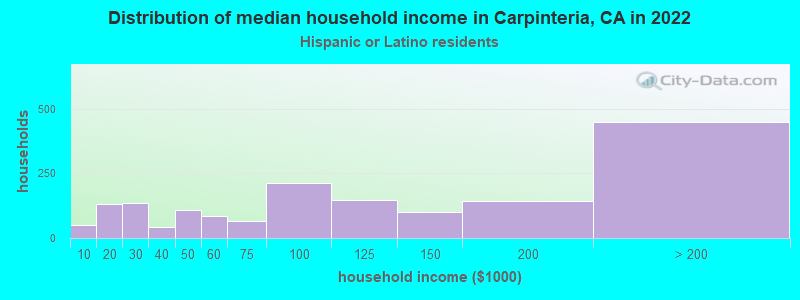
Income and house value in Carpinteria Median household income in 2022 $103,656 White non-Hispanic householders$20,421 Black householders$198,885 American Indian and Alaska Native householders$155,791 Asian householders$97,734 Some other race householders$119,844 Two or more races householders$89,936 Hispanic or Latino race householdersMedian 2022 house value over $1,000,000 White Non-Hispanic householders$494,903 American Indian or Alaska Native householders over $1,000,000 Asian householdersover $1,000,000 Some other race householdersover $1,000,000 Two or more races householdersover $1,000,000 Hispanic or Latino householders
Median age by race in Carpinteria
49.1 Median age for White residents44.2 53.0 56.7 Median age for Black or African American residents53.5 Median age for American Indian / Alaska Native residents57.2 Median age for Asian residents55.4 53.7 38.4 Median age for Other race residents48.4 32.8 32.8 Median age for Two or more races residents31.0 48.0 56.7 Median age for White alone residents53.9 57.9 38.2 Median age for Hispanic or Latino residents38.8 37.2
Owner/renter occupied households by race in Carpinteria
House owners and renters - White residents 2,073 57.0% Owner occupied1,562 43.0% Renter occupiedHouse owners and renters - Black or African American residents 7 58.7% Owner occupied5 41.3% Renter occupiedHouse owners and renters - Asian residents 96 74.0% Owner occupied34 26.0% Renter occupiedHouse owners and renters - Other race residents 396 49.2% Owner occupied410 50.8% Renter occupiedHouse owners and renters - Two or more races residents 196 54.3% Owner occupied165 45.7% Renter occupiedHouse owners and renters - White alone residents 1,816 59.7% Owner occupied1,225 40.3% Renter occupiedHouse owners and renters - Hispanic or Latino residents 816 44.5% Owner occupied1,016 55.5% Renter occupied
Language usage in Carpinteria
English speakers - Total 60.2% of residents of Carpinteria speak English at home.
36.0% of residents speak Spanish at home 2,795 60.3% Speak English very well1,840 39.7% Speak English less than very well3.6% of residents speak other language at home 391 85.2% Speak English very well68 14.8% Speak English less than very well
English speakers - Born in the United States 93.0% of residents of Carpinteria speak English at home.
5.8% of residents speak Spanish at home 118 90.1% Speak English very well13 9.9% Speak English less than very well0.9% of residents speak other language at home 20 100.0% Speak English very well
English speakers - Native, born elsewhere 64.7% of residents of Carpinteria speak English at home.
12.8% of residents speak Spanish at home 15 75.0% Speak English very well5 25.0% Speak English less than very well21.2% of residents speak other language at home 33 100.0% Speak English very well
English speakers - Foreign-born 12.9% of residents of Carpinteria speak English at home.
77.3% of residents speak Spanish at home 912 36.3% Speak English very well1,598 63.7% Speak English less than very well8.3% of residents speak other language at home 204 75.3% Speak English very well67 24.7% Speak English less than very well
White (Caucasian) - Speak only English Native:
89.9% (6,136)Foreign-born:
26.6% (283)
White (Caucasian) - Speak another language Native:
11.8% (807)Foreign-born:
75.4% (801)
Asian - Speak only English Native:
77.7% (103)Foreign-born:
6.0% (13)
Asian - Speak another language Native:
23.2% (31)Foreign-born:
95.2% (205)
Other race - Speak only English Native:
20.5% (262)Foreign-born:
1.0% (16)
Other race - Speak another language Native:
74.6% (955)Foreign-born:
97.9% (1,625)
Two or more races - Speak only English Native:
55.6% (413)Foreign-born:
3.8% (17)
Two or more races - Speak another language Native:
57.1% (423)Foreign-born:
100.0% (436)
White alone - Speak only English Native:
95.4% (5,369)Foreign-born:
78.5% (282)
White alone - Speak another language Native:
4.2% (238)Foreign-born:
23.1% (83)
Hispanic or Latino - Speak only English Native:
43.9% (1,473)Foreign-born:
1.8% (49)
Hispanic or Latino - Speak another language Native:
56.1% (1,884)Foreign-born:
97.5% (2,566)
Foreign-born residents in Carpinteria 3,322 residents are foreign born (19.9% Latin America ).
This city:
24.5%California:
100.0%
Marital status for residents in Carpinteria Marital status - White (Caucasian) population 15 years and over
Males 27.1% Never married58.0% Now married3.2% Separated2.0% Widowed9.7% DivorcedFemales 20.9% Never married51.2% Now married0.6% Separated10.1% Widowed17.1% DivorcedWomen who gave birth in the past 12 months Now married:
100.0% (103)Unmarried:
0.0% (0)
Women who did not give birth in the past 12 months Now married:
47.7% (662)Unmarried:
52.3% (726)
Marital status - Black or African American population 15 years and over
Males 65.5% Never married27.6% Now married0.0% Separated6.9% Widowed0.0% DivorcedFemales 100.0% Never married0.0% Now married0.0% Separated0.0% Widowed0.0% DivorcedMarital status - American Indian / Alaska Native population 15 years and over
Males 100.0% Never married0.0% Now married0.0% Separated0.0% Widowed0.0% DivorcedFemales 0.0% Never married100.0% Now married0.0% Separated0.0% Widowed0.0% DivorcedWomen who did not give birth in the past 12 months Now married:
100.0% (39)Unmarried:
0.0% (0)
Marital status - Asian population 15 years and over
Males 26.7% Never married62.8% Now married10.5% Separated0.0% Widowed0.0% DivorcedFemales 27.3% Never married53.7% Now married5.9% Separated0.0% Widowed13.2% DivorcedWomen who did not give birth in the past 12 months Now married:
57.7% (47)Unmarried:
42.3% (34)
Marital status - Other race population 15 years and over
Males 35.2% Never married43.6% Now married0.0% Separated2.1% Widowed19.1% DivorcedFemales 40.9% Never married44.5% Now married3.6% Separated4.8% Widowed6.3% DivorcedWomen who did not give birth in the past 12 months Now married:
36.5% (302)Unmarried:
63.5% (527)
Marital status - Two or more races population 15 years and over
Males 51.6% Never married42.6% Now married0.4% Separated5.5% Widowed0.0% DivorcedFemales 24.8% Never married54.9% Now married7.1% Separated13.3% Widowed0.0% DivorcedWomen who gave birth in the past 12 months Now married:
100.0% (32)Unmarried:
0.0% (0)
Women who did not give birth in the past 12 months Now married:
75.3% (157)Unmarried:
24.7% (51)
Marital status - White alone, not Hispanic / Latino population 15 years and over
Males 27.8% Never married55.4% Now married2.2% Separated1.8% Widowed12.6% DivorcedFemales 20.0% Never married48.5% Now married0.6% Separated11.2% Widowed19.6% DivorcedWomen who gave birth in the past 12 months Now married:
100.0% (15)Unmarried:
0.0% (0)
Women who did not give birth in the past 12 months Now married:
44.2% (446)Unmarried:
55.8% (564)
Marital status - Hispanic or Latino population 15 years and over
Males 29.3% Never married55.0% Now married2.9% Separated2.9% Widowed10.0% DivorcedFemales 29.7% Never married53.0% Now married2.2% Separated6.5% Widowed8.6% DivorcedWomen who gave birth in the past 12 months Now married:
100.0% (122)Unmarried:
0.0% (0)
Women who did not give birth in the past 12 months Now married:
47.8% (695)Unmarried:
52.2% (759)
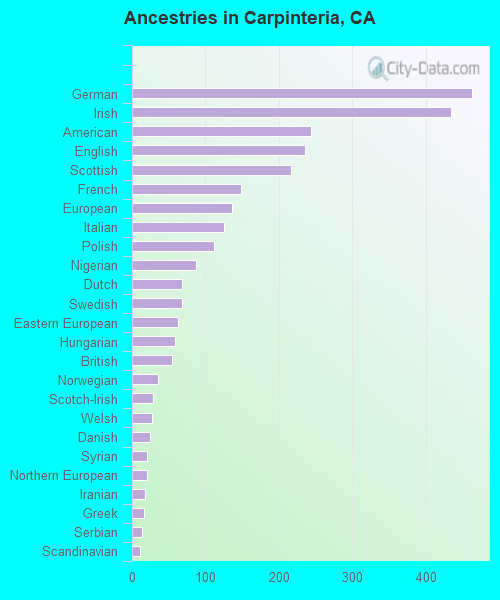
Ancestries in Carpinteria
345 4.6% English309 4.1% Irish302 4.0% American283 3.8% European251 3.4% German214 2.9% Italian81 1.1% British70 0.9% Polish67 0.9% Swedish53 0.7% Norwegian52 0.7% Northern European42 0.6% Scotch-Irish34 0.5% Scottish33 0.4% Eastern European30 0.4% Scandinavian28 0.4% Greek22 0.3% Celtic22 0.3% South African21 0.3% French Canadian18 0.2% French16 0.2% Danish16 0.2% Romanian13 0.2% Dutch10 0.1% Slovak8 0.1% Welsh7 0.09% Armenian7 0.09% Russian6 0.08% Canadian5 0.07% Pennsylvania German5 0.07% Kenyan4 0.05% African
Geographical mobility in Carpinteria Same house 1 year ago 7,262 90.4% White (Caucasian)65 97.3% Black or African American38 92.7% American Indian / Alaska Native285 81.0% Asian2,737 90.3% Other race1,258 81.7% Two or more races5,398 85.7% White alone, not Hispanic / Latino6,024 97.6% Hispanic or LatinoMoved within same county 361 4.5% White / Caucasian2 3.2% Black or African American3 8.0% American Indian / Alaska Native31 8.9% Asian47 1.5% Other race132 8.6% Two or more races431 6.8% White alone, not Hispanic / Latino39 0.6% Hispanic or LatinoMoved within same state 263 3.3% White / Caucasian10 2.9% Asian97 3.2% Other race111 7.2% Two or more races263 4.2% White alone, not Hispanic / Latino160 2.6% Hispanic or LatinoMoved from different state 198 2.5% White / Caucasian200 3.2% White alone, not Hispanic / LatinoMoved from abroad 10 0.1% White19 5.5% Asian16 0.5% Other race8 0.1% White alone, not Hispanic / Latino27 0.4% Hispanic or Latino
Children Nativity (place of birth) in Carpinteria
Children under 6 years - Living with two parents Both parents native 392 100.0% NativeBoth parents foreign-born 317 100.0% NativeOne native, one foreign-born parent 66 100.0% NativeChildren under 6 years - Living with one parent Native parent 31 100.0% NativeForeign-born parent 21 100.0% NativeChildren 6 to 17 years - Living with two parents Both parents native 481 100.0% Native0 0.0% Foreign-bornBoth parents foreign-born 542 95.5% Native25 4.5% Foreign-bornOne native, one foreign-born parent 132 100.0% NativeChildren 6 to 17 years - Living with one parent Native parent 131 100.0% NativeForeign-born parent 258 54.1% Native218 45.9% Foreign-born
Grandparents responsible for own grandchildren in Carpinteria
Grandparents (30 to 59 years) White / Caucasian 4 100.0% Not responsible for grandchildrenOther race 29 49.7% Responsible for grandchildren30 50.3% Not responsible for grandchildrenWhite alone, not Hispanic / Latino 8 100.0% Not responsible for grandchildrenHispanic or Latino 24 47.3% Responsible for grandchildren27 52.7% Not responsible for grandchildrenGrandparents (60 years and over) White / Caucasian 7 4.2% Responsible for grandchildren168 95.8% Not responsible for grandchildrenOther race 18 100.0% Not responsible for grandchildrenWhite alone, not Hispanic / Latino 72 100.0% Not responsible for grandchildrenHispanic or Latino 10 6.2% Responsible for grandchildren158 93.8% Not responsible for grandchildren