Races in Carrollton, Texas (TX) Detailed Stats
Data:
Races - White alone (%)
Races - White alone (% change since 2000)
Races - Black alone (%)
Races - Black alone (% change since 2000)
Races - American Indian alone (%)
Races - American Indian alone (% change since 2000)
Races - Asian alone (%)
Races - Asian alone (% change since 2000)
Races - Hispanic (%)
Races - Hispanic (% change since 2000)
Races - Native Hawaiian and Other Pacific Islander alone (%)
Races - Native Hawaiian and Other Pacific Islander alone (% change since 2000)
Races - Two or more races(%)
Races - Two or more races(% change since 2000)
Races - Other race alone (%)
Races - Other race alone (% change since 2000)
Racial diversity
Place of birth - Born in state of residence (%)
Place of birth - Born in state of residence (%) - White
Place of birth - Born in state of residence (%) - Black or African American
Place of birth - Born in state of residence (%) - Asian
Place of birth - Born in state of residence (%) - Hispanic or Latino
Place of birth - Born in state of residence (%) - American Indian and Alaska Native
Place of birth - Born in state of residence (%) - Multirace
Place of birth - Born in state of residence (%) - Other Race
Place of birth - Born in other state (%)
Place of birth - Born in other state (%) - White
Place of birth - Born in other state (%) - Black or African American
Place of birth - Born in other state (%) - Asian
Place of birth - Born in other state (%) - Hispanic or Latino
Place of birth - Born in other state (%) - American Indian and Alaska Native
Place of birth - Born in other state (%) - Multirace
Place of birth - Born in other state (%) - Other Race
Place of birth - Native, outside of US (%)
Place of birth - Native, outside of US (%) - White
Place of birth - Native, outside of US (%) - Black or African American
Place of birth - Native, outside of US (%) - Asian
Place of birth - Native, outside of US (%) - Hispanic or Latino
Place of birth - Native, outside of US (%) - American Indian and Alaska Native
Place of birth - Native, outside of US (%) - Multirace
Place of birth - Native, outside of US (%) - Other Race
Place of birth - Foreign born (%)
Place of birth - Foreign born (%) - White
Place of birth - Foreign born (%) - Black or African American
Place of birth - Foreign born (%) - Asian
Place of birth - Foreign born (%) - Hispanic or Latino
Place of birth - Foreign born (%) - American Indian and Alaska Native
Place of birth - Foreign born (%) - Multirace
Place of birth - Foreign born (%) - Other Race
Residents speaking English at home (%)
Residents speaking English at home - Born in the United States (%)
Residents speaking English at home - Native, born elsewhere (%)
Residents speaking English at home - Foreign born (%)
Residents speaking Spanish at home (%)
Residents speaking Spanish at home - Born in the United States (%)
Residents speaking Spanish at home - Native, born elsewhere (%)
Residents speaking Spanish at home - Foreign born (%)
Residents speaking other language at home (%)
Residents speaking other language at home - Born in the United States (%)
Residents speaking other language at home - Native, born elsewhere (%)
Residents speaking other language at home - Foreign born (%)
Marital status - Never married (%)
Marital status - Now married (%)
Marital status - Separated (%)
Marital status - Widowed (%)
Marital status - Divorced (%)
Ancestries Reported - Arab (%)
Ancestries Reported - Czech (%)
Ancestries Reported - Danish (%)
Ancestries Reported - Dutch (%)
Ancestries Reported - English (%)
Ancestries Reported - French (%)
Ancestries Reported - French Canadian (%)
Ancestries Reported - German (%)
Ancestries Reported - Greek (%)
Ancestries Reported - Hungarian (%)
Ancestries Reported - Irish (%)
Ancestries Reported - Italian (%)
Ancestries Reported - Lithuanian (%)
Ancestries Reported - Norwegian (%)
Ancestries Reported - Polish (%)
Ancestries Reported - Portuguese (%)
Ancestries Reported - Russian (%)
Ancestries Reported - Scotch-Irish (%)
Ancestries Reported - Scottish (%)
Ancestries Reported - Slovak (%)
Ancestries Reported - Subsaharan African (%)
Ancestries Reported - Swedish (%)
Ancestries Reported - Swiss (%)
Ancestries Reported - Ukrainian (%)
Ancestries Reported - United States (%)
Ancestries Reported - Welsh (%)
Ancestries Reported - West Indian (%)
Ancestries Reported - Other (%)
Geographical mobility - Same house 1 year ago (%)
Geographical mobility - Same house 1 year ago (%) - White
Geographical mobility - Same house 1 year ago (%) - Black or African American
Geographical mobility - Same house 1 year ago (%) - Asian
Geographical mobility - Same house 1 year ago (%) - Hispanic or Latino
Geographical mobility - Same house 1 year ago (%) - American Indian and Alaska Native
Geographical mobility - Same house 1 year ago (%) - Multirace
Geographical mobility - Same house 1 year ago (%) - Other Race
Geographical mobility - Moved within same county (%)
Geographical mobility - Moved within same county (%) - White
Geographical mobility - Moved within same county (%) - Black or African American
Geographical mobility - Moved within same county (%) - Asian
Geographical mobility - Moved within same county (%) - Hispanic or Latino
Geographical mobility - Moved within same county (%) - American Indian and Alaska Native
Geographical mobility - Moved within same county (%) - Multirace
Geographical mobility - Moved within same county (%) - Other Race
Geographical mobility - Moved from different county within same state (%)
Geographical mobility - Moved from different county within same state (%) - White
Geographical mobility - Moved from different county within same state (%) - Black or African American
Geographical mobility - Moved from different county within same state (%) - Asian
Geographical mobility - Moved from different county within same state (%) - Hispanic or Latino
Geographical mobility - Moved from different county within same state (%) - American Indian and Alaska Native
Geographical mobility - Moved from different county within same state (%) - Multirace
Geographical mobility - Moved from different county within same state (%) - Other Race
Geographical mobility - Moved from different state (%)
Geographical mobility - Moved from different state (%) - White
Geographical mobility - Moved from different state (%) - Black or African American
Geographical mobility - Moved from different state (%) - Asian
Geographical mobility - Moved from different state (%) - Hispanic or Latino
Geographical mobility - Moved from different state (%) - American Indian and Alaska Native
Geographical mobility - Moved from different state (%) - Multirace
Geographical mobility - Moved from different state (%) - Other Race
Geographical mobility - Moved from abroad (%)
Geographical mobility - Moved from abroad (%) - White
Geographical mobility - Moved from abroad (%) - Black or African American
Geographical mobility - Moved from abroad (%) - Asian
Geographical mobility - Moved from abroad (%) - Hispanic or Latino
Geographical mobility - Moved from abroad (%) - American Indian and Alaska Native
Geographical mobility - Moved from abroad (%) - Multirace
Geographical mobility - Moved from abroad (%) - Other Race
Place of birth for the foreign-born population - Ireland (%)
Place of birth for the foreign-born population - Denmark (%)
Place of birth for the foreign-born population - Norway (%)
Place of birth for the foreign-born population - Sweden (%)
Place of birth for the foreign-born population - United Kingdom (%)
Place of birth for the foreign-born population - England (%)
Place of birth for the foreign-born population - Scotland (%)
Place of birth for the foreign-born population - Other Northern Europe (%)
Place of birth for the foreign-born population - Austria (%)
Place of birth for the foreign-born population - Belgium (%)
Place of birth for the foreign-born population - France (%)
Place of birth for the foreign-born population - Germany (%)
Place of birth for the foreign-born population - Netherlands (%)
Place of birth for the foreign-born population - Switzerland (%)
Place of birth for the foreign-born population - Other Western Europe (%)
Place of birth for the foreign-born population - Greece (%)
Place of birth for the foreign-born population - Italy (%)
Place of birth for the foreign-born population - Portugal (%)
Place of birth for the foreign-born population - Spain (%)
Place of birth for the foreign-born population - Other Southern Europe (%)
Place of birth for the foreign-born population - Albania (%)
Place of birth for the foreign-born population - Belarus (%)
Place of birth for the foreign-born population - Bosnia and Herzegovina (%)
Place of birth for the foreign-born population - Bulgaria (%)
Place of birth for the foreign-born population - Croatia (%)
Place of birth for the foreign-born population - Czechoslovakia (%)
Place of birth for the foreign-born population - Hungary (%)
Place of birth for the foreign-born population - Latvia (%)
Place of birth for the foreign-born population - Lithuania (%)
Place of birth for the foreign-born population - North Macedonia (Macedonia) (%)
Place of birth for the foreign-born population - Moldova (%)
Place of birth for the foreign-born population - Poland (%)
Place of birth for the foreign-born population - Romania (%)
Place of birth for the foreign-born population - Russia (%)
Place of birth for the foreign-born population - Serbia (%)
Place of birth for the foreign-born population - Ukraine (%)
Place of birth for the foreign-born population - Other Eastern Europe (%)
Place of birth for the foreign-born population - China (%)
Place of birth for the foreign-born population - Hong Kong (%)
Place of birth for the foreign-born population - Taiwan (%)
Place of birth for the foreign-born population - Japan (%)
Place of birth for the foreign-born population - Korea (%)
Place of birth for the foreign-born population - Other Eastern Asia (%)
Place of birth for the foreign-born population - Afghanistan (%)
Place of birth for the foreign-born population - Bangladesh (%)
Place of birth for the foreign-born population - India (%)
Place of birth for the foreign-born population - Iran (%)
Place of birth for the foreign-born population - Kazakhstan (%)
Place of birth for the foreign-born population - Nepal (%)
Place of birth for the foreign-born population - Pakistan (%)
Place of birth for the foreign-born population - Sri Lanka (%)
Place of birth for the foreign-born population - Uzbekistan (%)
Place of birth for the foreign-born population - Other South Central Asia (%)
Place of birth for the foreign-born population - Burma (%)
Place of birth for the foreign-born population - Cambodia (%)
Place of birth for the foreign-born population - Indonesia (%)
Place of birth for the foreign-born population - Laos (%)
Place of birth for the foreign-born population - Malaysia (%)
Place of birth for the foreign-born population - Philippines (%)
Place of birth for the foreign-born population - Singapore (%)
Place of birth for the foreign-born population - Thailand (%)
Place of birth for the foreign-born population - Vietnam (%)
Place of birth for the foreign-born population - Other South Eastern Asia (%)
Place of birth for the foreign-born population - Armenia (%)
Place of birth for the foreign-born population - Iraq (%)
Place of birth for the foreign-born population - Israel (%)
Place of birth for the foreign-born population - Jordan (%)
Place of birth for the foreign-born population - Kuwait (%)
Place of birth for the foreign-born population - Lebanon (%)
Place of birth for the foreign-born population - Saudi Arabia (%)
Place of birth for the foreign-born population - Syria (%)
Place of birth for the foreign-born population - Turkey (%)
Place of birth for the foreign-born population - Yemen (%)
Place of birth for the foreign-born population - Other Western Asia (%)
Place of birth for the foreign-born population - Eritrea (%)
Place of birth for the foreign-born population - Ethiopia (%)
Place of birth for the foreign-born population - Kenya (%)
Place of birth for the foreign-born population - Somalia (%)
Place of birth for the foreign-born population - Uganda (%)
Place of birth for the foreign-born population - Zimbabwe (%)
Place of birth for the foreign-born population - Other Eastern Africa (%)
Place of birth for the foreign-born population - Cameroon (%)
Place of birth for the foreign-born population - Congo (%)
Place of birth for the foreign-born population - Democratic Republic of Congo (Zaire) (%)
Place of birth for the foreign-born population - Other Middle Africa (%)
Place of birth for the foreign-born population - Egypt (%)
Place of birth for the foreign-born population - Morocco (%)
Place of birth for the foreign-born population - Sudan (%)
Place of birth for the foreign-born population - Other Northern Africa (%)
Place of birth for the foreign-born population - South Africa (%)
Place of birth for the foreign-born population - Other Southern Africa (%)
Place of birth for the foreign-born population - Cabo Verde (%)
Place of birth for the foreign-born population - Ghana (%)
Place of birth for the foreign-born population - Liberia (%)
Place of birth for the foreign-born population - Nigeria (%)
Place of birth for the foreign-born population - Senegal (%)
Place of birth for the foreign-born population - Sierra Leone (%)
Place of birth for the foreign-born population - Other Western Africa (%)
Place of birth for the foreign-born population - Australia (%)
Place of birth for the foreign-born population - New Zealand (%)
Place of birth for the foreign-born population - Fiji (%)
Place of birth for the foreign-born population - Micronesia (%)
Place of birth for the foreign-born population - Bahamas (%)
Place of birth for the foreign-born population - Barbados (%)
Place of birth for the foreign-born population - Cuba (%)
Place of birth for the foreign-born population - Dominica (%)
Place of birth for the foreign-born population - Dominican Republic (%)
Place of birth for the foreign-born population - Grenada (%)
Place of birth for the foreign-born population - Haiti (%)
Place of birth for the foreign-born population - Jamaica (%)
Place of birth for the foreign-born population - St. Vincent and the Grenadines (%)
Place of birth for the foreign-born population - Trinidad and Tobago (%)
Place of birth for the foreign-born population - West Indies (%)
Place of birth for the foreign-born population - Other Caribbean (%)
Place of birth for the foreign-born population - Belize (%)
Place of birth for the foreign-born population - Costa Rica (%)
Place of birth for the foreign-born population - El Salvador (%)
Place of birth for the foreign-born population - Guatemala (%)
Place of birth for the foreign-born population - Honduras (%)
Place of birth for the foreign-born population - Mexico (%)
Place of birth for the foreign-born population - Nicaragua (%)
Place of birth for the foreign-born population - Panama (%)
Place of birth for the foreign-born population - Other Central America (%)
Place of birth for the foreign-born population - Argentina (%)
Place of birth for the foreign-born population - Bolivia (%)
Place of birth for the foreign-born population - Brazil (%)
Place of birth for the foreign-born population - Chile (%)
Place of birth for the foreign-born population - Colombia (%)
Place of birth for the foreign-born population - Ecuador (%)
Place of birth for the foreign-born population - Guyana (%)
Place of birth for the foreign-born population - Peru (%)
Place of birth for the foreign-born population - Uruguay (%)
Place of birth for the foreign-born population - Venezuela (%)
Place of birth for the foreign-born population - Other South America (%)
Place of birth for the foreign-born population - Canada (%)
Place of birth for the foreign-born population - Other Northern America (%)
Place of birth for the foreign-born population - Other (%)
Latest news about races in Carrollton, TX collected exclusively by city-data.com from local newspapers, TV, and radio stations
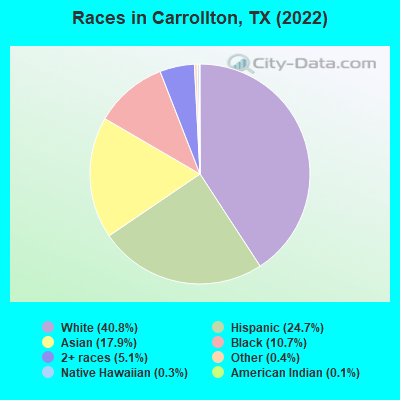
According to 2022 data, the most numerous races in Carrollton, TX are Hispanic (32,945 residents), White alone (54,396 residents), and Black alone (14,211 residents). 64.1% of Carrollton residents speak English at home. 28.5% of Carrollton, TX residents are foreign-born (13.5% born in Latin America, 11.2% born in Asia), which is 40.4% greater than the foreign-born rate of 17.0% across the entire state of Texas.
Race distribution in Carrollton
2000 2022
67,078 61.2% White alone 21,400 19.5% Hispanic 11,903 10.9% Asian alone 6,713 6.1% Black alone 1,882 1.7% Two or more races 385 0.4% American Indian alone 159 0.1% Other race alone 56 0.05% Native Hawaiian and Other
54,396 40.8% White alone 32,945 24.7% Hispanic 23,817 17.9% Asian alone 14,211 10.7% Black alone 6,736 5.1% Two or more races 534 0.4% Other race alone 446 0.3% Native Hawaiian and Other 155 0.1% American Indian alone
2000 2022
10,933,313 52.4% White alone 6,669,666 32.0% Hispanic 2,364,255 11.3% Black alone 554,445 2.7% Asian alone 230,567 1.1% Two or more races 68,859 0.3% American Indian alone 19,958 0.10% Other race alone 10,757 0.05% Native Hawaiian and Other
12,070,642 40.2% Hispanic 11,683,430 38.9% White alone 3,508,706 11.7% Black alone 1,608,173 5.4% Asian alone 956,560 3.2% Two or more races 125,763 0.4% Other race alone 47,023 0.2% American Indian alone 29,275 0.10% Native Hawaiian and Other
Income and house value in Carrollton Median household income in 2022 $105,418 White non-Hispanic householders$77,911 Black householders$65,177 American Indian and Alaska Native householders$96,659 Asian householders$61,229 Some other race householders$101,990 Two or more races householders$73,790 Hispanic or Latino race householdersMedian 2022 house value $370,860 White Non-Hispanic householders$402,106 Black or African American householders$279,459 American Indian or Alaska Native householders $421,087 Asian householders$277,415 Native Hawaiian and other Pacific Islander householders$275,079 Some other race householders$356,259 Two or more races householders$290,264 Hispanic or Latino householders
Median age by race in Carrollton
41.1 Median age for White residents40.7 42.2 35.0 Median age for Black or African American residents35.1 33.4 50.7 Median age for American Indian / Alaska Native residents50.5 -666,666,666.0 40.7 Median age for Asian residents40.8 40.5 -666,666,666.0 Median age for Native Hawaiian / Pacific Islander residents-666,666,666.0 -666,666,666.0 35.6 Median age for Other race residents34.4 35.9 32.3 Median age for Two or more races residents32.9 29.3 42.4 Median age for White alone residents41.4 46.7 33.0 Median age for Hispanic or Latino residents37.9 28.1
Owner/renter occupied households by race in Carrollton
House owners and renters - White residents 17,767 62.5% Owner occupied10,644 37.5% Renter occupiedHouse owners and renters - Black or African American residents 1,581 23.4% Owner occupied5,163 76.6% Renter occupiedHouse owners and renters - American Indian / Alaska Native residents 251 74.5% Owner occupied86 25.5% Renter occupiedHouse owners and renters - Asian residents 5,202 66.6% Owner occupied2,606 33.4% Renter occupiedHouse owners and renters - Native Hawaiian / Pacific Islander residents 23 69.8% Owner occupied10 30.2% Renter occupiedHouse owners and renters - Other race residents 1,116 59.1% Owner occupied772 40.9% Renter occupiedHouse owners and renters - Two or more races residents 4,894 69.6% Owner occupied2,135 30.4% Renter occupiedHouse owners and renters - White alone residents 16,615 65.5% Owner occupied8,758 34.5% Renter occupiedHouse owners and renters - Hispanic or Latino residents 5,415 54.6% Owner occupied4,508 45.4% Renter occupied
Language usage in Carrollton
English speakers - Total 64.1% of residents of Carrollton speak English at home.
19.6% of residents speak Spanish at home 12,518 51.0% Speak English very well12,044 49.0% Speak English less than very well16.3% of residents speak other language at home 11,364 55.4% Speak English very well9,132 44.6% Speak English less than very well
English speakers - Born in the United States 91.9% of residents of Carrollton speak English at home.
4.4% of residents speak Spanish at home 1,617 95.6% Speak English very well75 4.4% Speak English less than very well3.7% of residents speak other language at home 1,231 87.1% Speak English very well182 12.9% Speak English less than very well
English speakers - Native, born elsewhere 58.6% of residents of Carrollton speak English at home.
13.1% of residents speak Spanish at home 208 77.0% Speak English very well62 23.0% Speak English less than very well28.3% of residents speak other language at home 373 64.0% Speak English very well210 36.0% Speak English less than very well
English speakers - Foreign-born 11.7% of residents of Carrollton speak English at home.
42.7% of residents speak Spanish at home 3,812 25.4% Speak English very well11,193 74.6% Speak English less than very well45.6% of residents speak other language at home 7,841 49.0% Speak English very well8,174 51.0% Speak English less than very well
White (Caucasian) - Speak only English Native:
93.6% (51,283)Foreign-born:
17.4% (1,172)
White (Caucasian) - Speak another language Native:
6.4% (3,519)Foreign-born:
82.6% (5,579)
Black or African American - Speak only English Native:
98.8% (10,771)Foreign-born:
34.7% (593)
Black or African American - Speak another language Native:
1.3% (144)Foreign-born:
63.7% (1,088)
American Indian / Alaska Native - Speak another language Native:
38.2% (210)Foreign-born:
100.0% (49)
Asian - Speak only English Native:
42.3% (2,649)Foreign-born:
10.4% (1,731)
Asian - Speak another language Native:
57.7% (3,618)Foreign-born:
89.6% (14,875)
Other race - Speak only English Native:
35.0% (1,068)Foreign-born:
4.0% (144)
Other race - Speak another language Native:
65.0% (1,981)Foreign-born:
96.0% (3,420)
Two or more races - Speak only English Native:
63.2% (8,303)Foreign-born:
5.1% (378)
Two or more races - Speak another language Native:
36.8% (4,827)Foreign-born:
94.9% (7,050)
White alone - Speak only English Native:
96.7% (49,380)Foreign-born:
48.2% (1,007)
White alone - Speak another language Native:
3.3% (1,663)Foreign-born:
51.8% (1,083)
Hispanic or Latino - Speak only English Native:
44.3% (6,484)Foreign-born:
3.0% (455)
Hispanic or Latino - Speak another language Native:
55.7% (8,153)Foreign-born:
97.0% (14,958)
Foreign-born residents in Carrollton 37,670 residents are foreign born (13.5% Latin America , 11.2% Asia ).
This city:
28.5%Texas:
17.1%
Marital status for residents in Carrollton Marital status - White (Caucasian) population 15 years and over
Males 39.2% Never married52.1% Now married1.0% Separated1.9% Widowed5.7% DivorcedFemales 26.4% Never married53.2% Now married1.5% Separated6.0% Widowed13.0% DivorcedWomen who gave birth in the past 12 months Now married:
90.2% (804)Unmarried:
9.8% (87)
Women who did not give birth in the past 12 months Now married:
50.7% (6,673)Unmarried:
49.3% (6,499)
Marital status - Black or African American population 15 years and over
Males 46.3% Never married43.7% Now married2.6% Separated0.0% Widowed7.4% DivorcedFemales 47.7% Never married20.1% Now married0.0% Separated1.1% Widowed31.1% DivorcedWomen who gave birth in the past 12 months Now married:
71.2% (150)Unmarried:
28.8% (61)
Women who did not give birth in the past 12 months Now married:
23.6% (1,058)Unmarried:
76.4% (3,420)
Marital status - American Indian / Alaska Native population 15 years and over
Males 26.1% Never married56.7% Now married1.1% Separated0.0% Widowed16.1% DivorcedFemales 35.3% Never married54.2% Now married0.0% Separated6.5% Widowed3.9% DivorcedWomen who gave birth in the past 12 months Now married:
100.0% (13)Unmarried:
0.0% (0)
Women who did not give birth in the past 12 months Now married:
41.0% (33)Unmarried:
59.0% (47)
Marital status - Asian population 15 years and over
Males 28.4% Never married62.3% Now married0.0% Separated3.1% Widowed6.3% DivorcedFemales 27.2% Never married60.3% Now married0.0% Separated7.7% Widowed4.8% DivorcedWomen who gave birth in the past 12 months Now married:
100.0% (311)Unmarried:
0.0% (0)
Women who did not give birth in the past 12 months Now married:
53.1% (3,633)Unmarried:
46.9% (3,214)
Marital status - Native Hawaiian / Pacific Islander population 15 years and over
Males 94.3% Never married5.7% Now married0.0% Separated0.0% Widowed0.0% DivorcedFemales 15.9% Never married77.5% Now married0.0% Separated6.5% Widowed0.0% DivorcedWomen who did not give birth in the past 12 months Now married:
38.9% (17)Unmarried:
61.1% (27)
Marital status - Other race population 15 years and over
Males 34.2% Never married49.1% Now married1.7% Separated7.4% Widowed7.7% DivorcedFemales 28.8% Never married42.6% Now married8.3% Separated5.2% Widowed15.1% DivorcedWomen who gave birth in the past 12 months Now married:
100.0% (79)Unmarried:
0.0% (0)
Women who did not give birth in the past 12 months Now married:
39.2% (902)Unmarried:
60.8% (1,398)
Marital status - Two or more races population 15 years and over
Males 25.7% Never married72.9% Now married1.3% Separated0.0% Widowed0.1% DivorcedFemales 39.8% Never married53.2% Now married1.2% Separated0.6% Widowed5.2% DivorcedWomen who gave birth in the past 12 months Now married:
100.0% (443)Unmarried:
0.0% (0)
Women who did not give birth in the past 12 months Now married:
47.9% (2,615)Unmarried:
52.1% (2,840)
Marital status - White alone, not Hispanic / Latino population 15 years and over
Males 38.1% Never married52.9% Now married0.0% Separated2.2% Widowed6.8% DivorcedFemales 27.3% Never married51.5% Now married1.1% Separated6.7% Widowed13.4% DivorcedWomen who gave birth in the past 12 months Now married:
70.4% (207)Unmarried:
29.6% (87)
Women who did not give birth in the past 12 months Now married:
49.6% (5,926)Unmarried:
50.4% (6,026)
Marital status - Hispanic or Latino population 15 years and over
Males 32.5% Never married59.9% Now married4.7% Separated2.0% Widowed1.0% DivorcedFemales 30.0% Never married60.4% Now married2.0% Separated0.0% Widowed7.6% DivorcedWomen who gave birth in the past 12 months Now married:
100.0% (1,107)Unmarried:
0.0% (0)
Women who did not give birth in the past 12 months Now married:
50.0% (3,520)Unmarried:
50.0% (3,523)
Ancestries in Carrollton
5,467 6.9% English2,955 3.7% German2,798 3.5% American2,643 3.3% Irish1,226 1.5% Italian782 1.0% African758 1.0% Scottish758 1.0% European683 0.9% Polish593 0.7% British567 0.7% Nigerian491 0.6% Scotch-Irish470 0.6% French326 0.4% French Canadian291 0.4% Norwegian220 0.3% Dutch206 0.3% Palestinian202 0.3% Northern European182 0.2% Liberian179 0.2% Czech166 0.2% Brazilian154 0.2% Swedish149 0.2% Belizean139 0.2% Russian138 0.2% Lithuanian130 0.2% Scandinavian112 0.1% Serbian91 0.1% Armenian89 0.1% Ethiopian85 0.1% Eastern European84 0.1% Arab83 0.1% Turkish83 0.1% Ukrainian81 0.1% Iranian78 0.10% Hungarian77 0.10% Canadian76 0.10% Ghanaian72 0.09% Greek70 0.09% Slovene56 0.07% Afghan46 0.06% Welsh45 0.06% Czechoslovakian41 0.05% Danish40 0.05% Romanian37 0.05% Celtic36 0.05% Slovak33 0.04% Lebanese28 0.04% Jordanian25 0.03% Kenyan24 0.03% Latvian22 0.03% Bulgarian20 0.03% Austrian20 0.03% Finnish19 0.02% Cajun19 0.02% Jamaican18 0.02% Zimbabwean16 0.02% Sierra Leonean16 0.02% Albanian15 0.02% Egyptian11 0.01% Croatian11 0.01% Swiss11 0.01% Yugoslavian10 0.01% Belgian10 0.01% Syrian10 0.01% Guyanese
Geographical mobility in Carrollton Same house 1 year ago 56,553 88.4% White (Caucasian)13,288 93.5% Black or African American553 92.9% American Indian / Alaska Native19,961 84.5% Asian458 80.0% Native Hawaiian / Pacific Islander7,397 86.1% Other race21,824 95.0% Two or more races48,540 89.5% White alone, not Hispanic / Latino28,462 87.5% Hispanic or LatinoMoved within same county 1,902 3.0% White / Caucasian582 4.1% Black or African American27 4.6% American Indian / Alaska Native1,346 5.7% Asian225 2.6% Other race486 2.1% Two or more races1,646 3.0% White alone, not Hispanic / Latino1,348 4.1% Hispanic or LatinoMoved within same state 3,414 5.3% White / Caucasian340 2.4% Black or African American859 3.6% Asian159 27.8% Native Hawaiian / Pacific Islander383 4.5% Other race502 2.2% Two or more races2,167 4.0% White alone, not Hispanic / Latino1,817 5.6% Hispanic or LatinoMoved from different state 1,757 2.7% White / Caucasian4 0.7% American Indian / Alaska Native399 1.7% Asian247 2.9% Other race165 0.7% Two or more races1,683 3.1% White alone, not Hispanic / Latino367 1.1% Hispanic or LatinoMoved from abroad 325 0.5% White9 1.5% American Indian / Alaska Native1,059 4.5% Asian534 6.2% Other race201 0.4% White alone, not Hispanic / Latino531 1.6% Hispanic or Latino
Children Nativity (place of birth) in Carrollton
Children under 6 years - Living with two parents Both parents native 3,119 100.0% NativeBoth parents foreign-born 2,262 97.5% Native58 2.5% Foreign-bornOne native, one foreign-born parent 730 97.2% Native21 2.8% Foreign-bornChildren under 6 years - Living with one parent Native parent 1,282 100.0% NativeForeign-born parent 557 95.3% Native27 4.7% Foreign-bornChildren 6 to 17 years - Living with two parents Both parents native 5,120 99.3% Native36 0.7% Foreign-bornBoth parents foreign-born 3,775 81.4% Native865 18.6% Foreign-bornOne native, one foreign-born parent 2,503 98.0% Native50 2.0% Foreign-bornChildren 6 to 17 years - Living with one parent Native parent 2,383 100.0% NativeForeign-born parent 1,844 55.4% Native1,485 44.6% Foreign-born
Place of birth for residents in Carrollton 19,203 Americas18,545 Latin America16,016 Central America15,392 Asia6,652 South Central Asia4,785 Eastern Asia3,401 South Eastern Asia1,745 Africa1,610 South America1,269 Western Africa1,204 Europe1,071 China918 Caribbean658 Northern America527 Eastern Europe441 Western Asia324 Eastern Africa309 Northern Europe271 Western Europe124 Oceania95 Southern Europe79 Southern Africa49 Australia and New Zealand Subregion40 Northern Africa31 Middle Africa12,667 Mexico3,892 India3,690 Korea1,989 Vietnam1,892 Pakistan1,888 El Salvador795 China675 Cuba673 Honduras658 Canada599 Cambodia597 Venezuela511 Nigeria507 Colombia444 Philippines379 Bangladesh349 Guatemala258 Nepal233 Nicaragua223 Ghana212 Poland201 Taiwan201 Saudi Arabia193 Peru185 United Kingdom167 Laos161 Iran156 Liberia143 Brazil143 France128 Germany127 Kenya117 Thailand110 Ethiopia105 Belize101 Dominican Republic89 Russia79 South Africa74 Hong Kong74 Costa Rica72 West Indies69 Bolivia67 United Arab Emirates61 Romania55 Italy53 Ukraine52 Jordan50 Scotland47 Ireland46 Sierra Leone43 Chile41 Indonesia40 Micronesia40 Bulgaria39 Greece38 Australia37 Guyana35 Sri Lanka35 Malaysia33 Afghanistan32 Turkey29 Uganda25 England24 Panama23 Kuwait22 Syria21 Algeria21 Hungary20 Eritrea20 Latvia19 Cameroon18 Jamaica18 Zimbabwe18 Egypt17 Japan17 Ecuador16 Czechoslovakia12 Trinidad and Tobago11 Congo11 Albania11 New Zealand9 Lebanon6 Burma (Myanmar)5 Tanzania
Grandparents responsible for own grandchildren in Carrollton
Grandparents (30 to 59 years) White / Caucasian 129 40.3% Responsible for grandchildren190 59.7% Not responsible for grandchildrenBlack or African American 41 61.1% Responsible for grandchildren26 38.9% Not responsible for grandchildrenAsian 18 27.2% Responsible for grandchildren49 72.8% Not responsible for grandchildrenOther race 9 100.0% Not responsible for grandchildrenTwo or more races 141 54.7% Responsible for grandchildren117 45.3% Not responsible for grandchildrenWhite alone, not Hispanic / Latino 116 61.9% Responsible for grandchildren71 38.1% Not responsible for grandchildrenHispanic or Latino 205 42.4% Responsible for grandchildren278 57.6% Not responsible for grandchildrenGrandparents (60 years and over) White / Caucasian 139 36.4% Responsible for grandchildren243 63.6% Not responsible for grandchildrenBlack or African American 133 100.0% Not responsible for grandchildrenAsian 14 5.6% Responsible for grandchildren237 94.4% Not responsible for grandchildrenOther race 110 74.9% Responsible for grandchildren37 25.1% Not responsible for grandchildrenTwo or more races 21 7.0% Responsible for grandchildren280 93.0% Not responsible for grandchildrenWhite alone, not Hispanic / Latino 164 28.9% Responsible for grandchildren405 71.1% Not responsible for grandchildrenHispanic or Latino 87 28.2% Responsible for grandchildren222 71.8% Not responsible for grandchildren