Races in Carrollwood, Florida (FL) Detailed Stats
Data:
Races - White alone (%)
Races - White alone (% change since 2000)
Races - Black alone (%)
Races - Black alone (% change since 2000)
Races - American Indian alone (%)
Races - American Indian alone (% change since 2000)
Races - Asian alone (%)
Races - Asian alone (% change since 2000)
Races - Hispanic (%)
Races - Hispanic (% change since 2000)
Races - Native Hawaiian and Other Pacific Islander alone (%)
Races - Native Hawaiian and Other Pacific Islander alone (% change since 2000)
Races - Two or more races(%)
Races - Two or more races(% change since 2000)
Races - Other race alone (%)
Races - Other race alone (% change since 2000)
Racial diversity
Place of birth - Born in state of residence (%)
Place of birth - Born in state of residence (%) - White
Place of birth - Born in state of residence (%) - Black or African American
Place of birth - Born in state of residence (%) - Asian
Place of birth - Born in state of residence (%) - Hispanic or Latino
Place of birth - Born in state of residence (%) - American Indian and Alaska Native
Place of birth - Born in state of residence (%) - Multirace
Place of birth - Born in state of residence (%) - Other Race
Place of birth - Born in other state (%)
Place of birth - Born in other state (%) - White
Place of birth - Born in other state (%) - Black or African American
Place of birth - Born in other state (%) - Asian
Place of birth - Born in other state (%) - Hispanic or Latino
Place of birth - Born in other state (%) - American Indian and Alaska Native
Place of birth - Born in other state (%) - Multirace
Place of birth - Born in other state (%) - Other Race
Place of birth - Native, outside of US (%)
Place of birth - Native, outside of US (%) - White
Place of birth - Native, outside of US (%) - Black or African American
Place of birth - Native, outside of US (%) - Asian
Place of birth - Native, outside of US (%) - Hispanic or Latino
Place of birth - Native, outside of US (%) - American Indian and Alaska Native
Place of birth - Native, outside of US (%) - Multirace
Place of birth - Native, outside of US (%) - Other Race
Place of birth - Foreign born (%)
Place of birth - Foreign born (%) - White
Place of birth - Foreign born (%) - Black or African American
Place of birth - Foreign born (%) - Asian
Place of birth - Foreign born (%) - Hispanic or Latino
Place of birth - Foreign born (%) - American Indian and Alaska Native
Place of birth - Foreign born (%) - Multirace
Place of birth - Foreign born (%) - Other Race
Residents speaking English at home (%)
Residents speaking English at home - Born in the United States (%)
Residents speaking English at home - Native, born elsewhere (%)
Residents speaking English at home - Foreign born (%)
Residents speaking Spanish at home (%)
Residents speaking Spanish at home - Born in the United States (%)
Residents speaking Spanish at home - Native, born elsewhere (%)
Residents speaking Spanish at home - Foreign born (%)
Residents speaking other language at home (%)
Residents speaking other language at home - Born in the United States (%)
Residents speaking other language at home - Native, born elsewhere (%)
Residents speaking other language at home - Foreign born (%)
Marital status - Never married (%)
Marital status - Now married (%)
Marital status - Separated (%)
Marital status - Widowed (%)
Marital status - Divorced (%)
Ancestries Reported - Arab (%)
Ancestries Reported - Czech (%)
Ancestries Reported - Danish (%)
Ancestries Reported - Dutch (%)
Ancestries Reported - English (%)
Ancestries Reported - French (%)
Ancestries Reported - French Canadian (%)
Ancestries Reported - German (%)
Ancestries Reported - Greek (%)
Ancestries Reported - Hungarian (%)
Ancestries Reported - Irish (%)
Ancestries Reported - Italian (%)
Ancestries Reported - Lithuanian (%)
Ancestries Reported - Norwegian (%)
Ancestries Reported - Polish (%)
Ancestries Reported - Portuguese (%)
Ancestries Reported - Russian (%)
Ancestries Reported - Scotch-Irish (%)
Ancestries Reported - Scottish (%)
Ancestries Reported - Slovak (%)
Ancestries Reported - Subsaharan African (%)
Ancestries Reported - Swedish (%)
Ancestries Reported - Swiss (%)
Ancestries Reported - Ukrainian (%)
Ancestries Reported - United States (%)
Ancestries Reported - Welsh (%)
Ancestries Reported - West Indian (%)
Ancestries Reported - Other (%)
Geographical mobility - Same house 1 year ago (%)
Geographical mobility - Same house 1 year ago (%) - White
Geographical mobility - Same house 1 year ago (%) - Black or African American
Geographical mobility - Same house 1 year ago (%) - Asian
Geographical mobility - Same house 1 year ago (%) - Hispanic or Latino
Geographical mobility - Same house 1 year ago (%) - American Indian and Alaska Native
Geographical mobility - Same house 1 year ago (%) - Multirace
Geographical mobility - Same house 1 year ago (%) - Other Race
Geographical mobility - Moved within same county (%)
Geographical mobility - Moved within same county (%) - White
Geographical mobility - Moved within same county (%) - Black or African American
Geographical mobility - Moved within same county (%) - Asian
Geographical mobility - Moved within same county (%) - Hispanic or Latino
Geographical mobility - Moved within same county (%) - American Indian and Alaska Native
Geographical mobility - Moved within same county (%) - Multirace
Geographical mobility - Moved within same county (%) - Other Race
Geographical mobility - Moved from different county within same state (%)
Geographical mobility - Moved from different county within same state (%) - White
Geographical mobility - Moved from different county within same state (%) - Black or African American
Geographical mobility - Moved from different county within same state (%) - Asian
Geographical mobility - Moved from different county within same state (%) - Hispanic or Latino
Geographical mobility - Moved from different county within same state (%) - American Indian and Alaska Native
Geographical mobility - Moved from different county within same state (%) - Multirace
Geographical mobility - Moved from different county within same state (%) - Other Race
Geographical mobility - Moved from different state (%)
Geographical mobility - Moved from different state (%) - White
Geographical mobility - Moved from different state (%) - Black or African American
Geographical mobility - Moved from different state (%) - Asian
Geographical mobility - Moved from different state (%) - Hispanic or Latino
Geographical mobility - Moved from different state (%) - American Indian and Alaska Native
Geographical mobility - Moved from different state (%) - Multirace
Geographical mobility - Moved from different state (%) - Other Race
Geographical mobility - Moved from abroad (%)
Geographical mobility - Moved from abroad (%) - White
Geographical mobility - Moved from abroad (%) - Black or African American
Geographical mobility - Moved from abroad (%) - Asian
Geographical mobility - Moved from abroad (%) - Hispanic or Latino
Geographical mobility - Moved from abroad (%) - American Indian and Alaska Native
Geographical mobility - Moved from abroad (%) - Multirace
Geographical mobility - Moved from abroad (%) - Other Race
Place of birth for the foreign-born population - Ireland (%)
Place of birth for the foreign-born population - Denmark (%)
Place of birth for the foreign-born population - Norway (%)
Place of birth for the foreign-born population - Sweden (%)
Place of birth for the foreign-born population - United Kingdom (%)
Place of birth for the foreign-born population - England (%)
Place of birth for the foreign-born population - Scotland (%)
Place of birth for the foreign-born population - Other Northern Europe (%)
Place of birth for the foreign-born population - Austria (%)
Place of birth for the foreign-born population - Belgium (%)
Place of birth for the foreign-born population - France (%)
Place of birth for the foreign-born population - Germany (%)
Place of birth for the foreign-born population - Netherlands (%)
Place of birth for the foreign-born population - Switzerland (%)
Place of birth for the foreign-born population - Other Western Europe (%)
Place of birth for the foreign-born population - Greece (%)
Place of birth for the foreign-born population - Italy (%)
Place of birth for the foreign-born population - Portugal (%)
Place of birth for the foreign-born population - Spain (%)
Place of birth for the foreign-born population - Other Southern Europe (%)
Place of birth for the foreign-born population - Albania (%)
Place of birth for the foreign-born population - Belarus (%)
Place of birth for the foreign-born population - Bosnia and Herzegovina (%)
Place of birth for the foreign-born population - Bulgaria (%)
Place of birth for the foreign-born population - Croatia (%)
Place of birth for the foreign-born population - Czechoslovakia (%)
Place of birth for the foreign-born population - Hungary (%)
Place of birth for the foreign-born population - Latvia (%)
Place of birth for the foreign-born population - Lithuania (%)
Place of birth for the foreign-born population - North Macedonia (Macedonia) (%)
Place of birth for the foreign-born population - Moldova (%)
Place of birth for the foreign-born population - Poland (%)
Place of birth for the foreign-born population - Romania (%)
Place of birth for the foreign-born population - Russia (%)
Place of birth for the foreign-born population - Serbia (%)
Place of birth for the foreign-born population - Ukraine (%)
Place of birth for the foreign-born population - Other Eastern Europe (%)
Place of birth for the foreign-born population - China (%)
Place of birth for the foreign-born population - Hong Kong (%)
Place of birth for the foreign-born population - Taiwan (%)
Place of birth for the foreign-born population - Japan (%)
Place of birth for the foreign-born population - Korea (%)
Place of birth for the foreign-born population - Other Eastern Asia (%)
Place of birth for the foreign-born population - Afghanistan (%)
Place of birth for the foreign-born population - Bangladesh (%)
Place of birth for the foreign-born population - India (%)
Place of birth for the foreign-born population - Iran (%)
Place of birth for the foreign-born population - Kazakhstan (%)
Place of birth for the foreign-born population - Nepal (%)
Place of birth for the foreign-born population - Pakistan (%)
Place of birth for the foreign-born population - Sri Lanka (%)
Place of birth for the foreign-born population - Uzbekistan (%)
Place of birth for the foreign-born population - Other South Central Asia (%)
Place of birth for the foreign-born population - Burma (%)
Place of birth for the foreign-born population - Cambodia (%)
Place of birth for the foreign-born population - Indonesia (%)
Place of birth for the foreign-born population - Laos (%)
Place of birth for the foreign-born population - Malaysia (%)
Place of birth for the foreign-born population - Philippines (%)
Place of birth for the foreign-born population - Singapore (%)
Place of birth for the foreign-born population - Thailand (%)
Place of birth for the foreign-born population - Vietnam (%)
Place of birth for the foreign-born population - Other South Eastern Asia (%)
Place of birth for the foreign-born population - Armenia (%)
Place of birth for the foreign-born population - Iraq (%)
Place of birth for the foreign-born population - Israel (%)
Place of birth for the foreign-born population - Jordan (%)
Place of birth for the foreign-born population - Kuwait (%)
Place of birth for the foreign-born population - Lebanon (%)
Place of birth for the foreign-born population - Saudi Arabia (%)
Place of birth for the foreign-born population - Syria (%)
Place of birth for the foreign-born population - Turkey (%)
Place of birth for the foreign-born population - Yemen (%)
Place of birth for the foreign-born population - Other Western Asia (%)
Place of birth for the foreign-born population - Eritrea (%)
Place of birth for the foreign-born population - Ethiopia (%)
Place of birth for the foreign-born population - Kenya (%)
Place of birth for the foreign-born population - Somalia (%)
Place of birth for the foreign-born population - Uganda (%)
Place of birth for the foreign-born population - Zimbabwe (%)
Place of birth for the foreign-born population - Other Eastern Africa (%)
Place of birth for the foreign-born population - Cameroon (%)
Place of birth for the foreign-born population - Congo (%)
Place of birth for the foreign-born population - Democratic Republic of Congo (Zaire) (%)
Place of birth for the foreign-born population - Other Middle Africa (%)
Place of birth for the foreign-born population - Egypt (%)
Place of birth for the foreign-born population - Morocco (%)
Place of birth for the foreign-born population - Sudan (%)
Place of birth for the foreign-born population - Other Northern Africa (%)
Place of birth for the foreign-born population - South Africa (%)
Place of birth for the foreign-born population - Other Southern Africa (%)
Place of birth for the foreign-born population - Cabo Verde (%)
Place of birth for the foreign-born population - Ghana (%)
Place of birth for the foreign-born population - Liberia (%)
Place of birth for the foreign-born population - Nigeria (%)
Place of birth for the foreign-born population - Senegal (%)
Place of birth for the foreign-born population - Sierra Leone (%)
Place of birth for the foreign-born population - Other Western Africa (%)
Place of birth for the foreign-born population - Australia (%)
Place of birth for the foreign-born population - New Zealand (%)
Place of birth for the foreign-born population - Fiji (%)
Place of birth for the foreign-born population - Micronesia (%)
Place of birth for the foreign-born population - Bahamas (%)
Place of birth for the foreign-born population - Barbados (%)
Place of birth for the foreign-born population - Cuba (%)
Place of birth for the foreign-born population - Dominica (%)
Place of birth for the foreign-born population - Dominican Republic (%)
Place of birth for the foreign-born population - Grenada (%)
Place of birth for the foreign-born population - Haiti (%)
Place of birth for the foreign-born population - Jamaica (%)
Place of birth for the foreign-born population - St. Vincent and the Grenadines (%)
Place of birth for the foreign-born population - Trinidad and Tobago (%)
Place of birth for the foreign-born population - West Indies (%)
Place of birth for the foreign-born population - Other Caribbean (%)
Place of birth for the foreign-born population - Belize (%)
Place of birth for the foreign-born population - Costa Rica (%)
Place of birth for the foreign-born population - El Salvador (%)
Place of birth for the foreign-born population - Guatemala (%)
Place of birth for the foreign-born population - Honduras (%)
Place of birth for the foreign-born population - Mexico (%)
Place of birth for the foreign-born population - Nicaragua (%)
Place of birth for the foreign-born population - Panama (%)
Place of birth for the foreign-born population - Other Central America (%)
Place of birth for the foreign-born population - Argentina (%)
Place of birth for the foreign-born population - Bolivia (%)
Place of birth for the foreign-born population - Brazil (%)
Place of birth for the foreign-born population - Chile (%)
Place of birth for the foreign-born population - Colombia (%)
Place of birth for the foreign-born population - Ecuador (%)
Place of birth for the foreign-born population - Guyana (%)
Place of birth for the foreign-born population - Peru (%)
Place of birth for the foreign-born population - Uruguay (%)
Place of birth for the foreign-born population - Venezuela (%)
Place of birth for the foreign-born population - Other South America (%)
Place of birth for the foreign-born population - Canada (%)
Place of birth for the foreign-born population - Other Northern America (%)
Place of birth for the foreign-born population - Other (%)
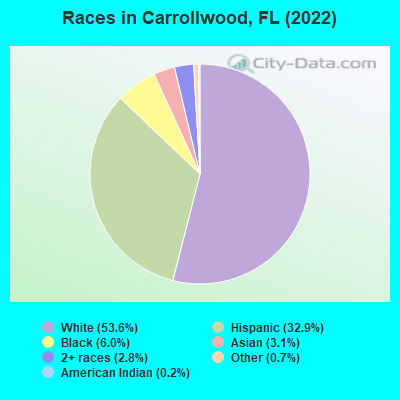
According to 2022 data, the most numerous races in Carrollwood, FL are White alone (19,976 residents), Hispanic (12,255 residents), and Black alone (2,218 residents). 72.6% of Carrollwood residents speak English at home.
Race distribution in Carrollwood 19,976 53.6% White alone 12,255 32.9% Hispanic 2,218 6.0% Black alone 1,144 3.1% Asian alone 1,035 2.8% Two or more races 257 0.7% Other race alone 89 0.2% American Indian alone
2000 2022
10,458,509 65.4% White alone 2,682,715 16.8% Hispanic 2,264,268 14.2% Black alone 261,693 1.6% Asian alone 236,954 1.5% Two or more races 42,358 0.3% American Indian alone 28,994 0.2% Other race alone 6,887 0.04% Native Hawaiian and Other
11,309,403 50.8% White alone 6,025,039 27.1% Hispanic 3,241,015 14.6% Black alone 861,630 3.9% Two or more races 623,692 2.8% Asian alone 152,054 0.7% Other race alone 22,504 0.1% American Indian alone 9,486 0.04% Native Hawaiian and Other
Income and house value in Carrollwood Median household income in 2022 $82,790 White non-Hispanic householders$57,494 Black householders$51,320 American Indian and Alaska Native householders$108,271 Asian householders$59,711 Some other race householders$67,453 Two or more races householders$69,920 Hispanic or Latino race householders
Median age by race in Carrollwood
46.1 Median age for White residents42.3 47.8 38.3 Median age for Black or African American residents38.0 38.0 34.5 Median age for American Indian / Alaska Native residents34.8 33.7 42.1 Median age for Asian residents37.4 48.0 -848,484,847.6 Median age for Native Hawaiian / Pacific Islander residents-776,729,559.0 -490,118,576.6 40.2 Median age for Other race residents38.5 42.8 33.9 Median age for Two or more races residents34.3 31.4 45.6 Median age for White alone residents43.2 46.6 38.9 Median age for Hispanic or Latino residents37.8 39.4
Owner/renter occupied households by race in Carrollwood
House owners and renters - White residents 7,238 74.2% Owner occupied2,516 25.8% Renter occupiedHouse owners and renters - Black or African American residents 301 24.0% Owner occupied954 76.0% Renter occupiedHouse owners and renters - American Indian / Alaska Native residents 97 38.0% Owner occupied159 62.0% Renter occupiedHouse owners and renters - Asian residents 251 70.5% Owner occupied105 29.5% Renter occupiedHouse owners and renters - Other race residents 526 59.8% Owner occupied353 40.2% Renter occupiedHouse owners and renters - Two or more races residents 1,811 71.7% Owner occupied714 28.3% Renter occupiedHouse owners and renters - White alone residents 6,596 73.5% Owner occupied2,383 26.5% Renter occupiedHouse owners and renters - Hispanic or Latino residents 2,797 64.6% Owner occupied1,532 35.4% Renter occupied
Language usage in Carrollwood
English speakers - Total 72.6% of residents of Carrollwood speak English at home.
21.2% of residents speak Spanish at home 4,196 57.8% Speak English very well3,061 42.2% Speak English less than very well5.9% of residents speak other language at home 1,315 64.7% Speak English very well716 35.3% Speak English less than very well
English speakers - Born in the United States 89.4% of residents of Carrollwood speak English at home.
8.7% of residents speak Spanish at home 1,091 91.9% Speak English very well96 8.1% Speak English less than very well1.8% of residents speak other language at home 244 97.2% Speak English very well7 2.8% Speak English less than very well
English speakers - Native, born elsewhere 54.4% of residents of Carrollwood speak English at home.
42.2% of residents speak Spanish at home 746 89.6% Speak English very well87 10.4% Speak English less than very well4.8% of residents speak other language at home 95 100.0% Speak English very well
English speakers - Foreign-born 16.2% of residents of Carrollwood speak English at home.
61.7% of residents speak Spanish at home 1,459 35.8% Speak English very well2,613 64.2% Speak English less than very well21.9% of residents speak other language at home 837 58.0% Speak English very well606 42.0% Speak English less than very well
White (Caucasian) - Speak only English Native:
96.4% (18,567)Foreign-born:
31.4% (373)
White (Caucasian) - Speak another language Native:
4.9% (944)Foreign-born:
69.7% (828)
Black or African American - Speak only English Native:
87.5% (1,985)Foreign-born:
54.8% (99)
Black or African American - Speak another language Native:
12.3% (278)Foreign-born:
45.1% (82)
Asian - Speak only English Native:
62.6% (217)Foreign-born:
22.7% (181)
Asian - Speak another language Native:
34.9% (121)Foreign-born:
77.5% (616)
Other race - Speak only English Native:
28.3% (300)Foreign-born:
3.9% (65)
Other race - Speak another language Native:
71.5% (760)Foreign-born:
96.6% (1,605)
Two or more races - Speak only English Native:
61.4% (2,344)Foreign-born:
13.1% (328)
Two or more races - Speak another language Native:
37.9% (1,447)Foreign-born:
84.5% (2,117)
White alone - Speak only English Native:
96.2% (17,315)Foreign-born:
40.2% (316)
White alone - Speak another language Native:
3.7% (670)Foreign-born:
59.9% (471)
Hispanic or Latino - Speak only English Native:
59.4% (3,740)Foreign-born:
6.4% (279)
Hispanic or Latino - Speak another language Native:
43.8% (2,760)Foreign-born:
93.4% (4,084)
Foreign-born residents in Carrollwood
Marital status for residents in Carrollwood Marital status - White (Caucasian) population 15 years and over
Males 28.8% Never married54.3% Now married1.7% Separated1.7% Widowed13.5% DivorcedFemales 26.3% Never married47.3% Now married2.4% Separated10.0% Widowed14.0% DivorcedWomen who gave birth in the past 12 months Now married:
45.1% (113)Unmarried:
54.9% (138)
Women who did not give birth in the past 12 months Now married:
41.4% (1,788)Unmarried:
58.6% (2,530)
Marital status - Black or African American population 15 years and over
Males 42.0% Never married41.0% Now married0.1% Separated1.9% Widowed15.0% DivorcedFemales 51.4% Never married27.3% Now married2.4% Separated2.0% Widowed16.8% DivorcedWomen who gave birth in the past 12 months Now married:
0.0% (0)Unmarried:
100.0% (85)
Women who did not give birth in the past 12 months Now married:
28.4% (235)Unmarried:
71.6% (593)
Marital status - American Indian / Alaska Native population 15 years and over
Males 84.0% Never married16.0% Now married0.0% Separated0.0% Widowed0.0% DivorcedFemales 49.7% Never married37.8% Now married0.0% Separated12.6% Widowed0.0% DivorcedWomen who gave birth in the past 12 months Now married:
100.0% (40)Unmarried:
0.0% (0)
Women who did not give birth in the past 12 months Now married:
32.4% (68)Unmarried:
67.6% (143)
Marital status - Asian population 15 years and over
Males 29.1% Never married61.9% Now married0.0% Separated0.0% Widowed9.1% DivorcedFemales 22.8% Never married73.6% Now married0.0% Separated1.6% Widowed2.0% DivorcedWomen who gave birth in the past 12 months Now married:
100.0% (15)Unmarried:
0.0% (0)
Women who did not give birth in the past 12 months Now married:
44.8% (107)Unmarried:
55.2% (131)
Marital status - Other race population 15 years and over
Males 33.0% Never married55.9% Now married0.0% Separated0.0% Widowed11.1% DivorcedFemales 21.2% Never married47.9% Now married5.7% Separated9.4% Widowed15.8% DivorcedWomen who gave birth in the past 12 months Now married:
0.0% (0)Unmarried:
100.0% (8)
Women who did not give birth in the past 12 months Now married:
58.5% (458)Unmarried:
41.5% (325)
Marital status - Two or more races population 15 years and over
Males 41.4% Never married48.3% Now married2.0% Separated0.0% Widowed8.4% DivorcedFemales 29.3% Never married38.0% Now married1.1% Separated9.5% Widowed22.1% DivorcedWomen who gave birth in the past 12 months Now married:
35.8% (112)Unmarried:
64.2% (201)
Women who did not give birth in the past 12 months Now married:
41.4% (478)Unmarried:
58.6% (677)
Marital status - White alone, not Hispanic / Latino population 15 years and over
Males 28.2% Never married55.1% Now married1.6% Separated1.8% Widowed13.3% DivorcedFemales 25.1% Never married47.5% Now married2.1% Separated10.8% Widowed14.5% DivorcedWomen who gave birth in the past 12 months Now married:
51.2% (134)Unmarried:
48.8% (128)
Women who did not give birth in the past 12 months Now married:
41.8% (1,717)Unmarried:
58.2% (2,388)
Marital status - Hispanic or Latino population 15 years and over
Males 34.5% Never married49.6% Now married1.7% Separated0.8% Widowed13.4% DivorcedFemales 30.6% Never married42.4% Now married3.3% Separated8.3% Widowed15.4% DivorcedWomen who gave birth in the past 12 months Now married:
27.1% (67)Unmarried:
72.9% (179)
Women who did not give birth in the past 12 months Now married:
41.9% (1,018)Unmarried:
58.1% (1,411)
Ancestries in Carrollwood
1,845 9.8% American1,723 9.1% English1,299 6.9% Italian1,171 6.2% Irish987 5.2% German496 2.6% European380 2.0% Polish188 1.0% Swedish158 0.8% Dutch144 0.8% Eastern European118 0.6% Iraqi109 0.6% Brazilian104 0.6% Scottish104 0.6% Jamaican102 0.5% Bulgarian101 0.5% Pennsylvania German81 0.4% Haitian80 0.4% Israeli67 0.4% Moroccan65 0.3% Trinidadian and Tobagonian64 0.3% Czechoslovakian60 0.3% Scotch-Irish53 0.3% Russian53 0.3% South African48 0.3% British45 0.2% Danish44 0.2% Portuguese43 0.2% Norwegian41 0.2% Nigerian39 0.2% Hungarian37 0.2% Yugoslavian36 0.2% French36 0.2% Greek36 0.2% Icelander35 0.2% French Canadian34 0.2% Welsh28 0.1% Canadian27 0.1% Armenian27 0.1% Scandinavian22 0.1% U.S. Virgin Islander19 0.1% Iranian15 0.08% Lebanese15 0.08% Northern European13 0.07% Finnish11 0.06% Slovak10 0.05% Arab10 0.05% Serbian10 0.05% Guyanese9 0.05% Ukrainian6 0.03% Lithuanian5 0.03% Somali
Geographical mobility in Carrollwood Same house 1 year ago 19,225 89.8% White (Caucasian)2,435 97.5% Black or African American433 89.8% American Indian / Alaska Native999 85.5% Asian1,963 70.3% Other race6,622 87.1% Two or more races17,314 87.9% White alone, not Hispanic / Latino10,238 85.8% Hispanic or LatinoMoved within same county 1,413 6.6% White / Caucasian122 4.9% Black or African American25 5.1% American Indian / Alaska Native94 8.0% Asian654 23.4% Other race176 2.3% Two or more races1,454 7.4% White alone, not Hispanic / Latino976 8.2% Hispanic or LatinoMoved within same state 442 2.1% White / Caucasian26 5.5% American Indian / Alaska Native772 10.1% Two or more races490 2.5% White alone, not Hispanic / Latino540 4.5% Hispanic or LatinoMoved from different state 282 1.3% White / Caucasian99 1.3% Two or more races302 1.5% White alone, not Hispanic / LatinoMoved from abroad 8 0.0% White38 3.3% Asian62 2.2% Other race19 0.2% Two or more races88 0.7% Hispanic or Latino
Children Nativity (place of birth) in Carrollwood
Children under 6 years - Living with two parents Both parents native 1,469 100.0% NativeBoth parents foreign-born 213 100.0% NativeOne native, one foreign-born parent 93 100.0% NativeChildren under 6 years - Living with one parent Native parent 1,107 100.0% NativeForeign-born parent 126 100.0% NativeChildren 6 to 17 years - Living with two parents Both parents native 2,024 100.0% NativeBoth parents foreign-born 365 69.5% Native161 30.5% Foreign-bornOne native, one foreign-born parent 542 100.0% NativeChildren 6 to 17 years - Living with one parent Native parent 1,003 100.0% NativeForeign-born parent 141 61.3% Native89 38.7% Foreign-born
Grandparents responsible for own grandchildren in Carrollwood
Grandparents (30 to 59 years) White / Caucasian 25 26.5% Responsible for grandchildren70 73.5% Not responsible for grandchildrenBlack or African American 32 100.0% Not responsible for grandchildrenTwo or more races 53 100.0% Responsible for grandchildrenWhite alone, not Hispanic / Latino 13 29.9% Responsible for grandchildren31 70.1% Not responsible for grandchildrenHispanic or Latino 64 68.1% Responsible for grandchildren30 31.9% Not responsible for grandchildrenGrandparents (60 years and over) White / Caucasian 43 29.4% Responsible for grandchildren104 70.6% Not responsible for grandchildrenBlack or African American 19 100.0% Not responsible for grandchildrenTwo or more races 31 100.0% Not responsible for grandchildrenWhite alone, not Hispanic / Latino 53 61.9% Responsible for grandchildren33 38.1% Not responsible for grandchildrenHispanic or Latino 237 100.0% Not responsible for grandchildren