Races in Cary, North Carolina (NC) Detailed Stats
Data:
Races - White alone (%)
Races - White alone (% change since 2000)
Races - Black alone (%)
Races - Black alone (% change since 2000)
Races - American Indian alone (%)
Races - American Indian alone (% change since 2000)
Races - Asian alone (%)
Races - Asian alone (% change since 2000)
Races - Hispanic (%)
Races - Hispanic (% change since 2000)
Races - Native Hawaiian and Other Pacific Islander alone (%)
Races - Native Hawaiian and Other Pacific Islander alone (% change since 2000)
Races - Two or more races(%)
Races - Two or more races(% change since 2000)
Races - Other race alone (%)
Races - Other race alone (% change since 2000)
Racial diversity
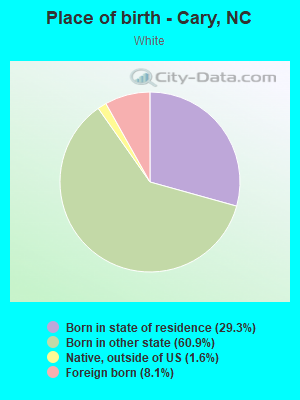
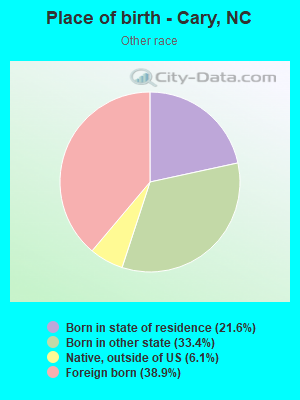
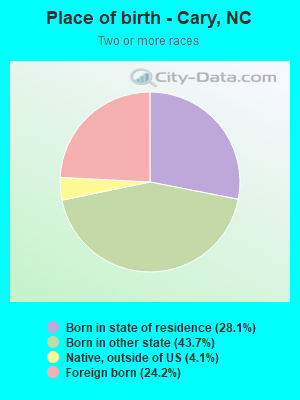
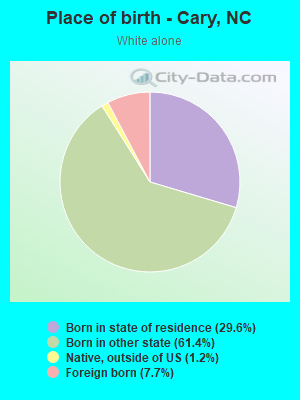
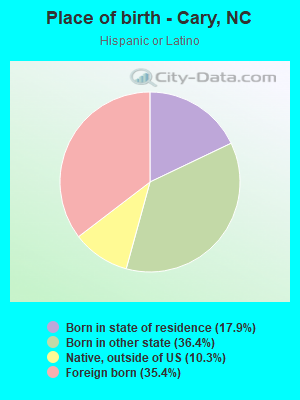
Place of birth - Born in state of residence (%)
Place of birth - Born in state of residence (%) - White
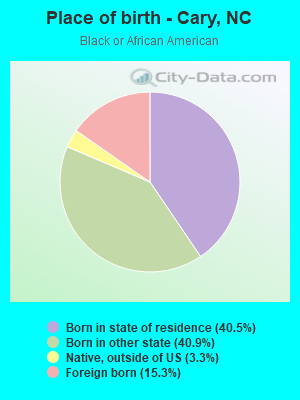
Place of birth - Born in state of residence (%) - Black or African American
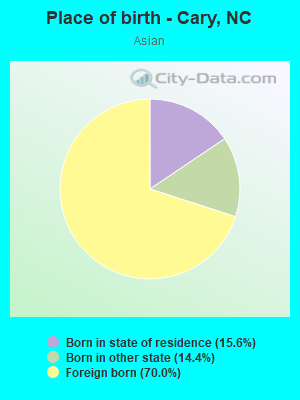
Place of birth - Born in state of residence (%) - Asian
Place of birth - Born in state of residence (%) - Hispanic or Latino
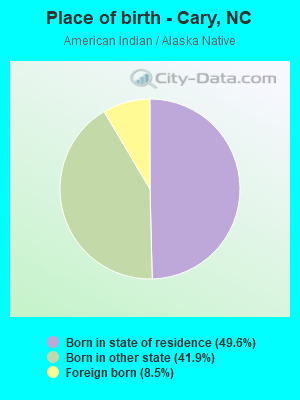
Place of birth - Born in state of residence (%) - American Indian and Alaska Native
Place of birth - Born in state of residence (%) - Multirace
Place of birth - Born in state of residence (%) - Other Race
Place of birth - Born in other state (%)
Place of birth - Born in other state (%) - White
Place of birth - Born in other state (%) - Black or African American
Place of birth - Born in other state (%) - Asian
Place of birth - Born in other state (%) - Hispanic or Latino
Place of birth - Born in other state (%) - American Indian and Alaska Native
Place of birth - Born in other state (%) - Multirace
Place of birth - Born in other state (%) - Other Race
Place of birth - Native, outside of US (%)
Place of birth - Native, outside of US (%) - White
Place of birth - Native, outside of US (%) - Black or African American
Place of birth - Native, outside of US (%) - Asian
Place of birth - Native, outside of US (%) - Hispanic or Latino
Place of birth - Native, outside of US (%) - American Indian and Alaska Native
Place of birth - Native, outside of US (%) - Multirace
Place of birth - Native, outside of US (%) - Other Race
Place of birth - Foreign born (%)
Place of birth - Foreign born (%) - White
Place of birth - Foreign born (%) - Black or African American
Place of birth - Foreign born (%) - Asian
Place of birth - Foreign born (%) - Hispanic or Latino
Place of birth - Foreign born (%) - American Indian and Alaska Native
Place of birth - Foreign born (%) - Multirace
Place of birth - Foreign born (%) - Other Race
Residents speaking English at home (%)
Residents speaking English at home - Born in the United States (%)
Residents speaking English at home - Native, born elsewhere (%)
Residents speaking English at home - Foreign born (%)
Residents speaking Spanish at home (%)
Residents speaking Spanish at home - Born in the United States (%)
Residents speaking Spanish at home - Native, born elsewhere (%)
Residents speaking Spanish at home - Foreign born (%)
Residents speaking other language at home (%)
Residents speaking other language at home - Born in the United States (%)
Residents speaking other language at home - Native, born elsewhere (%)
Residents speaking other language at home - Foreign born (%)
Marital status - Never married (%)
Marital status - Now married (%)
Marital status - Separated (%)
Marital status - Widowed (%)
Marital status - Divorced (%)
Ancestries Reported - Arab (%)
Ancestries Reported - Czech (%)
Ancestries Reported - Danish (%)
Ancestries Reported - Dutch (%)
Ancestries Reported - English (%)
Ancestries Reported - French (%)
Ancestries Reported - French Canadian (%)
Ancestries Reported - German (%)
Ancestries Reported - Greek (%)
Ancestries Reported - Hungarian (%)
Ancestries Reported - Irish (%)
Ancestries Reported - Italian (%)
Ancestries Reported - Lithuanian (%)
Ancestries Reported - Norwegian (%)
Ancestries Reported - Polish (%)
Ancestries Reported - Portuguese (%)
Ancestries Reported - Russian (%)
Ancestries Reported - Scotch-Irish (%)
Ancestries Reported - Scottish (%)
Ancestries Reported - Slovak (%)
Ancestries Reported - Subsaharan African (%)
Ancestries Reported - Swedish (%)
Ancestries Reported - Swiss (%)
Ancestries Reported - Ukrainian (%)
Ancestries Reported - United States (%)
Ancestries Reported - Welsh (%)
Ancestries Reported - West Indian (%)
Ancestries Reported - Other (%)
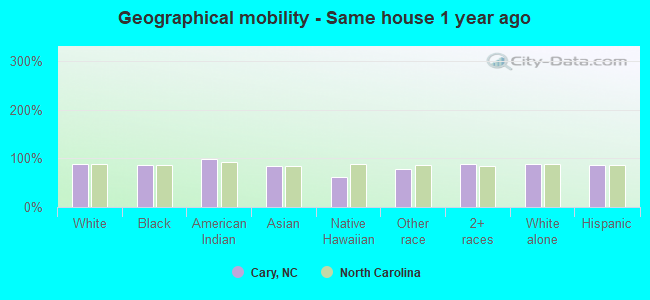
Geographical mobility - Same house 1 year ago (%)
Geographical mobility - Same house 1 year ago (%) - White
Geographical mobility - Same house 1 year ago (%) - Black or African American
Geographical mobility - Same house 1 year ago (%) - Asian
Geographical mobility - Same house 1 year ago (%) - Hispanic or Latino
Geographical mobility - Same house 1 year ago (%) - American Indian and Alaska Native
Geographical mobility - Same house 1 year ago (%) - Multirace
Geographical mobility - Same house 1 year ago (%) - Other Race
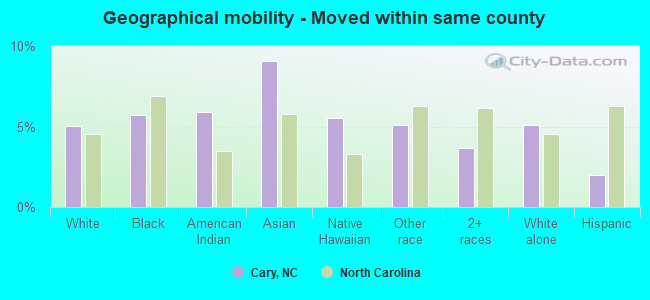
Geographical mobility - Moved within same county (%)
Geographical mobility - Moved within same county (%) - White
Geographical mobility - Moved within same county (%) - Black or African American
Geographical mobility - Moved within same county (%) - Asian
Geographical mobility - Moved within same county (%) - Hispanic or Latino
Geographical mobility - Moved within same county (%) - American Indian and Alaska Native
Geographical mobility - Moved within same county (%) - Multirace
Geographical mobility - Moved within same county (%) - Other Race
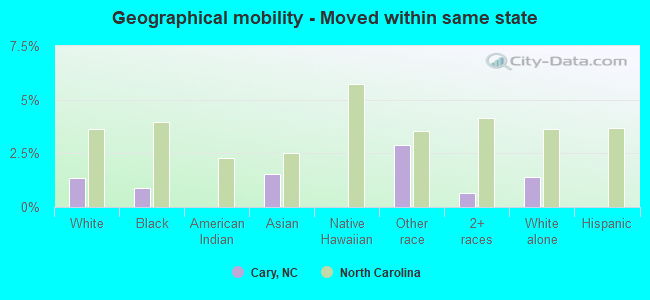
Geographical mobility - Moved from different county within same state (%)
Geographical mobility - Moved from different county within same state (%) - White
Geographical mobility - Moved from different county within same state (%) - Black or African American
Geographical mobility - Moved from different county within same state (%) - Asian
Geographical mobility - Moved from different county within same state (%) - Hispanic or Latino
Geographical mobility - Moved from different county within same state (%) - American Indian and Alaska Native
Geographical mobility - Moved from different county within same state (%) - Multirace
Geographical mobility - Moved from different county within same state (%) - Other Race
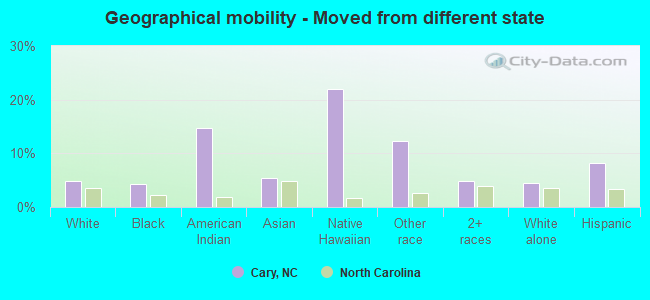
Geographical mobility - Moved from different state (%)
Geographical mobility - Moved from different state (%) - White
Geographical mobility - Moved from different state (%) - Black or African American
Geographical mobility - Moved from different state (%) - Asian
Geographical mobility - Moved from different state (%) - Hispanic or Latino
Geographical mobility - Moved from different state (%) - American Indian and Alaska Native
Geographical mobility - Moved from different state (%) - Multirace
Geographical mobility - Moved from different state (%) - Other Race
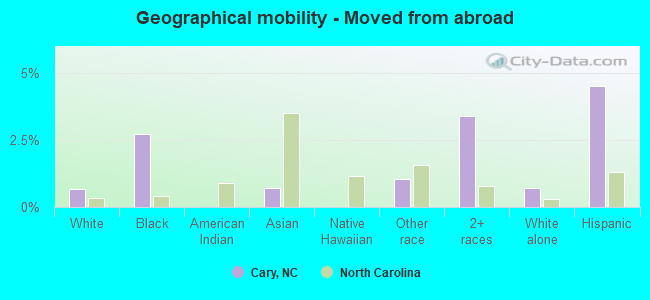
Geographical mobility - Moved from abroad (%)
Geographical mobility - Moved from abroad (%) - White
Geographical mobility - Moved from abroad (%) - Black or African American
Geographical mobility - Moved from abroad (%) - Asian
Geographical mobility - Moved from abroad (%) - Hispanic or Latino
Geographical mobility - Moved from abroad (%) - American Indian and Alaska Native
Geographical mobility - Moved from abroad (%) - Multirace
Geographical mobility - Moved from abroad (%) - Other Race
Place of birth for the foreign-born population - Ireland (%)
Place of birth for the foreign-born population - Denmark (%)
Place of birth for the foreign-born population - Norway (%)
Place of birth for the foreign-born population - Sweden (%)
Place of birth for the foreign-born population - United Kingdom (%)
Place of birth for the foreign-born population - England (%)
Place of birth for the foreign-born population - Scotland (%)
Place of birth for the foreign-born population - Other Northern Europe (%)
Place of birth for the foreign-born population - Austria (%)
Place of birth for the foreign-born population - Belgium (%)
Place of birth for the foreign-born population - France (%)
Place of birth for the foreign-born population - Germany (%)
Place of birth for the foreign-born population - Netherlands (%)
Place of birth for the foreign-born population - Switzerland (%)
Place of birth for the foreign-born population - Other Western Europe (%)
Place of birth for the foreign-born population - Greece (%)
Place of birth for the foreign-born population - Italy (%)
Place of birth for the foreign-born population - Portugal (%)
Place of birth for the foreign-born population - Spain (%)
Place of birth for the foreign-born population - Other Southern Europe (%)
Place of birth for the foreign-born population - Albania (%)
Place of birth for the foreign-born population - Belarus (%)
Place of birth for the foreign-born population - Bosnia and Herzegovina (%)
Place of birth for the foreign-born population - Bulgaria (%)
Place of birth for the foreign-born population - Croatia (%)
Place of birth for the foreign-born population - Czechoslovakia (%)
Place of birth for the foreign-born population - Hungary (%)
Place of birth for the foreign-born population - Latvia (%)
Place of birth for the foreign-born population - Lithuania (%)
Place of birth for the foreign-born population - North Macedonia (Macedonia) (%)
Place of birth for the foreign-born population - Moldova (%)
Place of birth for the foreign-born population - Poland (%)
Place of birth for the foreign-born population - Romania (%)
Place of birth for the foreign-born population - Russia (%)
Place of birth for the foreign-born population - Serbia (%)
Place of birth for the foreign-born population - Ukraine (%)
Place of birth for the foreign-born population - Other Eastern Europe (%)
Place of birth for the foreign-born population - China (%)
Place of birth for the foreign-born population - Hong Kong (%)
Place of birth for the foreign-born population - Taiwan (%)
Place of birth for the foreign-born population - Japan (%)
Place of birth for the foreign-born population - Korea (%)
Place of birth for the foreign-born population - Other Eastern Asia (%)
Place of birth for the foreign-born population - Afghanistan (%)
Place of birth for the foreign-born population - Bangladesh (%)
Place of birth for the foreign-born population - India (%)
Place of birth for the foreign-born population - Iran (%)
Place of birth for the foreign-born population - Kazakhstan (%)
Place of birth for the foreign-born population - Nepal (%)
Place of birth for the foreign-born population - Pakistan (%)
Place of birth for the foreign-born population - Sri Lanka (%)
Place of birth for the foreign-born population - Uzbekistan (%)
Place of birth for the foreign-born population - Other South Central Asia (%)
Place of birth for the foreign-born population - Burma (%)
Place of birth for the foreign-born population - Cambodia (%)
Place of birth for the foreign-born population - Indonesia (%)
Place of birth for the foreign-born population - Laos (%)
Place of birth for the foreign-born population - Malaysia (%)
Place of birth for the foreign-born population - Philippines (%)
Place of birth for the foreign-born population - Singapore (%)
Place of birth for the foreign-born population - Thailand (%)
Place of birth for the foreign-born population - Vietnam (%)
Place of birth for the foreign-born population - Other South Eastern Asia (%)
Place of birth for the foreign-born population - Armenia (%)
Place of birth for the foreign-born population - Iraq (%)
Place of birth for the foreign-born population - Israel (%)
Place of birth for the foreign-born population - Jordan (%)
Place of birth for the foreign-born population - Kuwait (%)
Place of birth for the foreign-born population - Lebanon (%)
Place of birth for the foreign-born population - Saudi Arabia (%)
Place of birth for the foreign-born population - Syria (%)
Place of birth for the foreign-born population - Turkey (%)
Place of birth for the foreign-born population - Yemen (%)
Place of birth for the foreign-born population - Other Western Asia (%)
Place of birth for the foreign-born population - Eritrea (%)
Place of birth for the foreign-born population - Ethiopia (%)
Place of birth for the foreign-born population - Kenya (%)
Place of birth for the foreign-born population - Somalia (%)
Place of birth for the foreign-born population - Uganda (%)
Place of birth for the foreign-born population - Zimbabwe (%)
Place of birth for the foreign-born population - Other Eastern Africa (%)
Place of birth for the foreign-born population - Cameroon (%)
Place of birth for the foreign-born population - Congo (%)
Place of birth for the foreign-born population - Democratic Republic of Congo (Zaire) (%)
Place of birth for the foreign-born population - Other Middle Africa (%)
Place of birth for the foreign-born population - Egypt (%)
Place of birth for the foreign-born population - Morocco (%)
Place of birth for the foreign-born population - Sudan (%)
Place of birth for the foreign-born population - Other Northern Africa (%)
Place of birth for the foreign-born population - South Africa (%)
Place of birth for the foreign-born population - Other Southern Africa (%)
Place of birth for the foreign-born population - Cabo Verde (%)
Place of birth for the foreign-born population - Ghana (%)
Place of birth for the foreign-born population - Liberia (%)
Place of birth for the foreign-born population - Nigeria (%)
Place of birth for the foreign-born population - Senegal (%)
Place of birth for the foreign-born population - Sierra Leone (%)
Place of birth for the foreign-born population - Other Western Africa (%)
Place of birth for the foreign-born population - Australia (%)
Place of birth for the foreign-born population - New Zealand (%)
Place of birth for the foreign-born population - Fiji (%)
Place of birth for the foreign-born population - Micronesia (%)
Place of birth for the foreign-born population - Bahamas (%)
Place of birth for the foreign-born population - Barbados (%)
Place of birth for the foreign-born population - Cuba (%)
Place of birth for the foreign-born population - Dominica (%)
Place of birth for the foreign-born population - Dominican Republic (%)
Place of birth for the foreign-born population - Grenada (%)
Place of birth for the foreign-born population - Haiti (%)
Place of birth for the foreign-born population - Jamaica (%)
Place of birth for the foreign-born population - St. Vincent and the Grenadines (%)
Place of birth for the foreign-born population - Trinidad and Tobago (%)
Place of birth for the foreign-born population - West Indies (%)
Place of birth for the foreign-born population - Other Caribbean (%)
Place of birth for the foreign-born population - Belize (%)
Place of birth for the foreign-born population - Costa Rica (%)
Place of birth for the foreign-born population - El Salvador (%)
Place of birth for the foreign-born population - Guatemala (%)
Place of birth for the foreign-born population - Honduras (%)
Place of birth for the foreign-born population - Mexico (%)
Place of birth for the foreign-born population - Nicaragua (%)
Place of birth for the foreign-born population - Panama (%)
Place of birth for the foreign-born population - Other Central America (%)
Place of birth for the foreign-born population - Argentina (%)
Place of birth for the foreign-born population - Bolivia (%)
Place of birth for the foreign-born population - Brazil (%)
Place of birth for the foreign-born population - Chile (%)
Place of birth for the foreign-born population - Colombia (%)
Place of birth for the foreign-born population - Ecuador (%)
Place of birth for the foreign-born population - Guyana (%)
Place of birth for the foreign-born population - Peru (%)
Place of birth for the foreign-born population - Uruguay (%)
Place of birth for the foreign-born population - Venezuela (%)
Place of birth for the foreign-born population - Other South America (%)
Place of birth for the foreign-born population - Canada (%)
Place of birth for the foreign-born population - Other Northern America (%)
Place of birth for the foreign-born population - Other (%)
Latest news about races in Cary, NC collected exclusively by city-data.com from local newspapers, TV, and radio stations
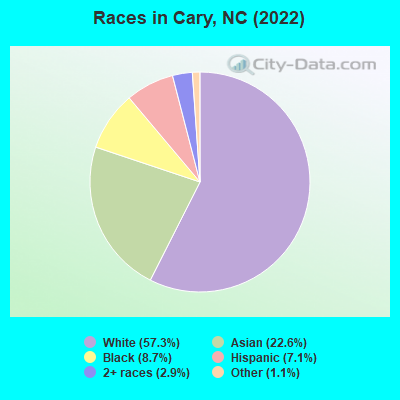
According to 2022 data, the most numerous races in Cary, NC are White alone (102,774 residents), Black alone (15,644 residents), and Hispanic (12,803 residents). 75.0% of Cary residents speak English at home. 23.2% of Cary, NC residents are foreign-born (15.2% born in Asia, 3.1% born in Latin America, 2.4% born in Europe), which is 65.5% greater than the foreign-born rate of 8.0% across the entire state of North Carolina.
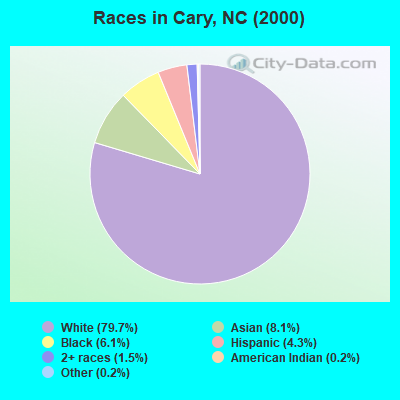
Race distribution in Cary
2000 2022
75,299 79.7% White alone 7,636 8.1% Asian alone 5,744 6.1% Black alone 4,047 4.3% Hispanic 1,415 1.5% Two or more races 197 0.2% American Indian alone 173 0.2% Other race alone 25 0.03% Native Hawaiian and Other
102,774 57.3% White alone 40,565 22.6% Asian alone 15,644 8.7% Black alone 12,803 7.1% Hispanic 5,176 2.9% Two or more races 2,025 1.1% Other race alone 177 0.10% Native Hawaiian and Other 92 0.05% American Indian alone
2000 2022
5,647,155 70.2% White alone 1,723,301 21.4% Black alone 378,963 4.7% Hispanic 112,416 1.4% Asian alone 95,333 1.2% American Indian alone 79,965 1.0% Two or more races 9,015 0.1% Other race alone 3,165 0.04% Native Hawaiian and Other
6,497,519 60.7% White alone 2,155,650 20.1% Black alone 1,114,799 10.4% Hispanic 438,061 4.1% Two or more races 341,052 3.2% Asian alone 91,758 0.9% American Indian alone 50,180 0.5% Other race alone 9,954 0.09% Native Hawaiian and Other
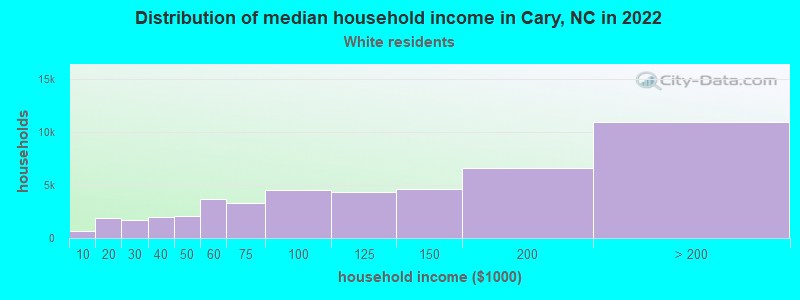
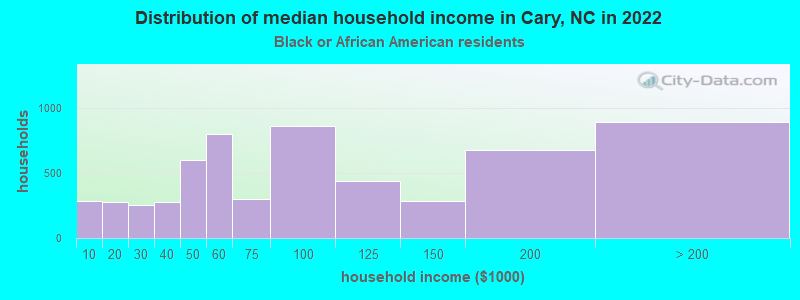
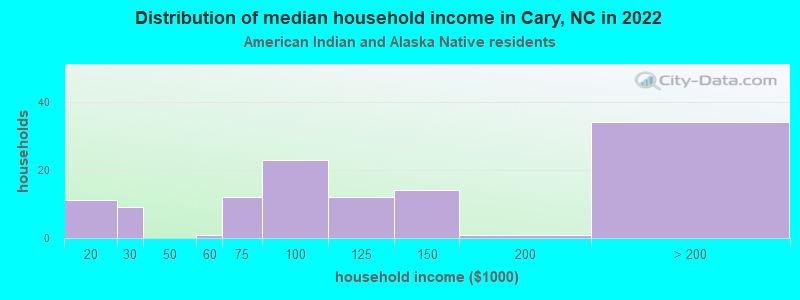
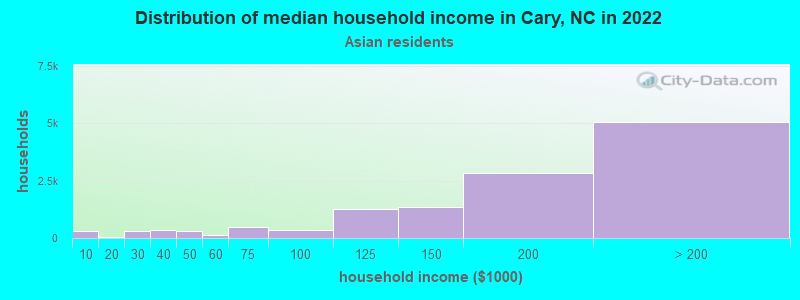
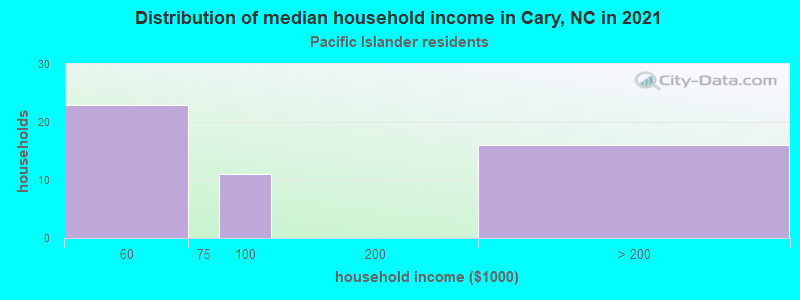
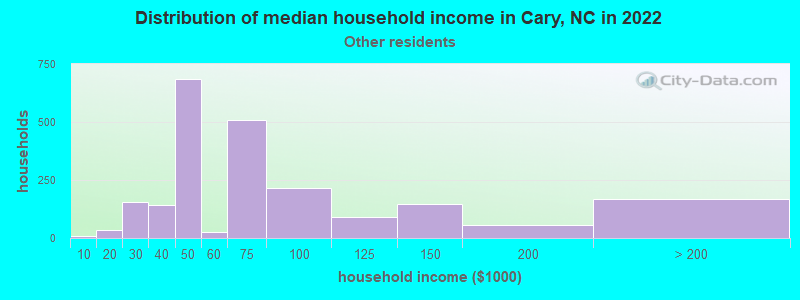
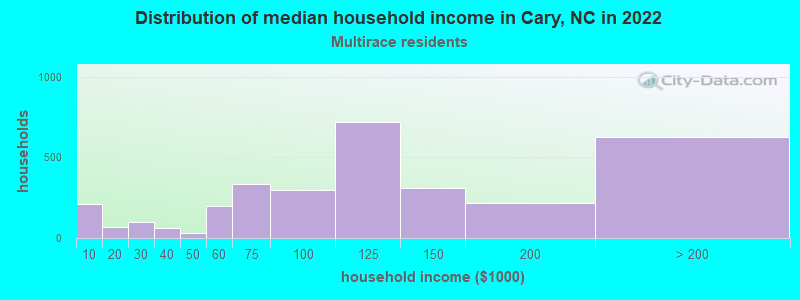
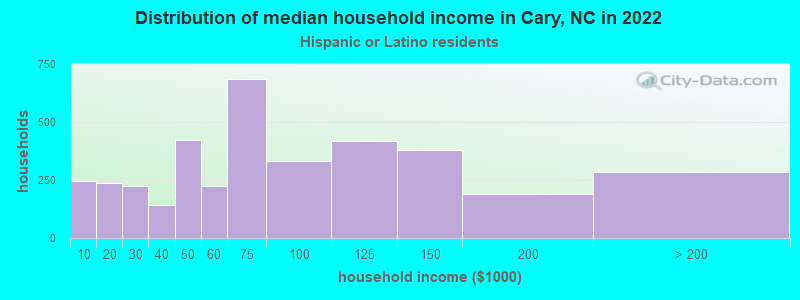
Income and house value in Cary Median household income in 2022 $117,705 White non-Hispanic householders$96,128 Black householders$167,472 Asian householders$60,662 Some other race householders$105,726 Two or more races householders$60,613 Hispanic or Latino race householdersMedian 2022 house value $577,971 White Non-Hispanic householders$524,200 Black or African American householders$406,078 American Indian or Alaska Native householders $611,468 Asian householders$550,939 Native Hawaiian and other Pacific Islander householders$593,545 Some other race householders$508,039 Two or more races householders$617,933 Hispanic or Latino householders
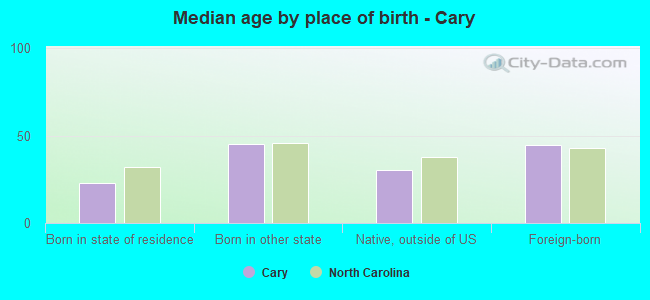
Median age by race in Cary
45.0 Median age for White residents44.0 46.2 36.6 Median age for Black or African American residents38.0 31.8 24.1 Median age for American Indian / Alaska Native residents24.1 35.1 37.7 Median age for Asian residents38.3 37.2 -666,666,666.0 Median age for Native Hawaiian / Pacific Islander residents-666,666,666.0 -666,666,666.0 34.1 Median age for Other race residents27.4 43.9 27.7 Median age for Two or more races residents33.3 27.0 45.3 Median age for White alone residents44.3 46.4 34.6 Median age for Hispanic or Latino residents35.3 34.2
Owner/renter occupied households by race in Cary
House owners and renters - White residents 32,563 70.8% Owner occupied13,435 29.2% Renter occupiedHouse owners and renters - Black or African American residents 2,335 44.1% Owner occupied2,962 55.9% Renter occupiedHouse owners and renters - American Indian / Alaska Native residents 50 66.0% Owner occupied26 34.0% Renter occupiedHouse owners and renters - Asian residents 9,014 70.6% Owner occupied3,752 29.4% Renter occupiedHouse owners and renters - Native Hawaiian / Pacific Islander residents 64 46.4% Owner occupied74 53.6% Renter occupiedHouse owners and renters - Other race residents 928 47.4% Owner occupied1,028 52.6% Renter occupiedHouse owners and renters - Two or more races residents 1,929 51.2% Owner occupied1,839 48.8% Renter occupiedHouse owners and renters - White alone residents 32,314 71.0% Owner occupied13,209 29.0% Renter occupiedHouse owners and renters - Hispanic or Latino residents 1,844 49.3% Owner occupied1,898 50.7% Renter occupied
Language usage in Cary
English speakers - Total 75.0% of residents of Cary speak English at home.
3.8% of residents speak Spanish at home 4,523 70.2% Speak English very well1,919 29.8% Speak English less than very well21.3% of residents speak other language at home 28,260 77.6% Speak English very well8,155 22.4% Speak English less than very well
English speakers - Born in the United States 94.0% of residents of Cary speak English at home.
1.4% of residents speak Spanish at home 1,129 95.4% Speak English very well55 4.6% Speak English less than very well4.6% of residents speak other language at home 3,590 95.8% Speak English very well159 4.2% Speak English less than very well
English speakers - Native, born elsewhere 72.6% of residents of Cary speak English at home.
14.6% of residents speak Spanish at home 339 76.5% Speak English very well104 23.5% Speak English less than very well12.8% of residents speak other language at home 388 100.0% Speak English very well
English speakers - Foreign-born 26.2% of residents of Cary speak English at home.
9.0% of residents speak Spanish at home 2,366 58.8% Speak English very well1,660 41.2% Speak English less than very well64.8% of residents speak other language at home 21,720 75.2% Speak English very well7,155 24.8% Speak English less than very well
White (Caucasian) - Speak only English Native:
97.3% (90,029)Foreign-born:
53.8% (4,593)
White (Caucasian) - Speak another language Native:
2.7% (2,545)Foreign-born:
46.2% (3,946)
Black or African American - Speak only English Native:
95.4% (10,740)Foreign-born:
29.5% (807)
Black or African American - Speak another language Native:
4.8% (537)Foreign-born:
67.2% (1,837)
American Indian / Alaska Native - Speak another language Native:
23.1% (53)Foreign-born:
100.0% (41)
Asian - Speak only English Native:
43.2% (4,239)Foreign-born:
14.6% (4,142)
Asian - Speak another language Native:
56.8% (5,573)Foreign-born:
85.4% (24,140)
Native Hawaiian / Pacific Islander - Speak only English Native:
100.0% (134)Foreign-born:
56.2% (35)
Other race - Speak only English Native:
72.8% (2,398)Foreign-born:
14.9% (320)
Other race - Speak another language Native:
27.2% (897)Foreign-born:
85.1% (1,825)
Two or more races - Speak only English Native:
91.3% (7,550)Foreign-born:
29.3% (857)
Two or more races - Speak another language Native:
8.7% (716)Foreign-born:
70.7% (2,068)
White alone - Speak only English Native:
97.6% (89,145)Foreign-born:
56.5% (4,492)
White alone - Speak another language Native:
2.4% (2,236)Foreign-born:
43.5% (3,457)
Hispanic or Latino - Speak only English Native:
75.3% (5,516)Foreign-born:
16.2% (732)
Hispanic or Latino - Speak another language Native:
24.7% (1,812)Foreign-born:
83.8% (3,799)
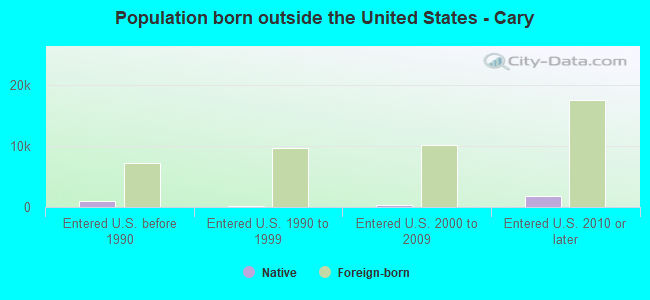
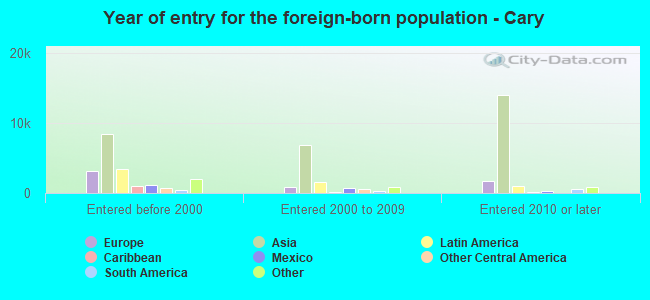
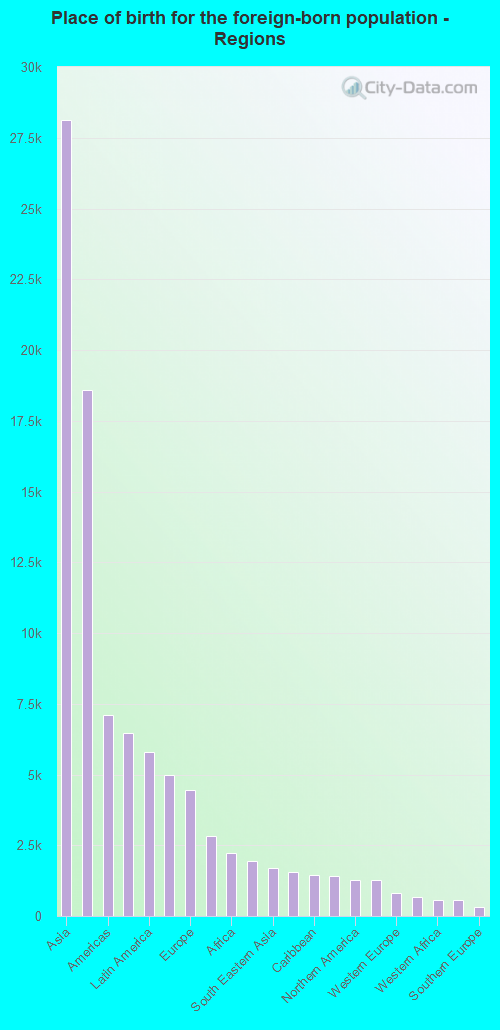
Foreign-born residents in Cary 42,082 residents are foreign born (15.2% Asia , 3.1% Latin America , 2.4% Europe ).
This city:
23.2%North Carolina:
8.3%
Marital status for residents in Cary Marital status - White (Caucasian) population 15 years and over
Males 26.0% Never married62.9% Now married1.0% Separated2.6% Widowed7.6% DivorcedFemales 25.9% Never married56.9% Now married0.7% Separated7.0% Widowed9.5% DivorcedWomen who gave birth in the past 12 months Now married:
100.0% (715)Unmarried:
0.0% (0)
Women who did not give birth in the past 12 months Now married:
43.6% (9,545)Unmarried:
56.4% (12,332)
Marital status - Black or African American population 15 years and over
Males 38.3% Never married49.8% Now married3.5% Separated0.9% Widowed7.6% DivorcedFemales 48.1% Never married33.1% Now married4.7% Separated5.7% Widowed8.4% DivorcedWomen who gave birth in the past 12 months Now married:
80.9% (230)Unmarried:
19.1% (54)
Women who did not give birth in the past 12 months Now married:
29.2% (1,253)Unmarried:
70.8% (3,035)
Marital status - American Indian / Alaska Native population 15 years and over
Males 31.8% Never married65.9% Now married0.0% Separated0.0% Widowed2.3% DivorcedFemales 17.5% Never married64.9% Now married0.0% Separated0.0% Widowed17.5% DivorcedWomen who gave birth in the past 12 months Now married:
0.0% (0)Unmarried:
100.0% (11)
Women who did not give birth in the past 12 months Now married:
100.0% (23)Unmarried:
0.0% (0)
Marital status - Asian population 15 years and over
Males 27.8% Never married67.3% Now married0.0% Separated0.6% Widowed4.4% DivorcedFemales 16.4% Never married71.5% Now married0.0% Separated6.7% Widowed5.4% DivorcedWomen who gave birth in the past 12 months Now married:
100.0% (533)Unmarried:
0.0% (0)
Women who did not give birth in the past 12 months Now married:
75.3% (7,798)Unmarried:
24.7% (2,553)
Marital status - Native Hawaiian / Pacific Islander population 15 years and over
Males 0.0% Never married30.2% Now married0.0% Separated0.0% Widowed69.8% DivorcedFemales 28.4% Never married71.6% Now married0.0% Separated0.0% Widowed0.0% DivorcedWomen who did not give birth in the past 12 months Now married:
65.7% (46)Unmarried:
34.3% (24)
Marital status - Other race population 15 years and over
Males 44.6% Never married51.0% Now married0.0% Separated0.0% Widowed4.4% DivorcedFemales 20.5% Never married57.1% Now married3.6% Separated6.8% Widowed12.1% DivorcedWomen who gave birth in the past 12 months Now married:
45.2% (22)Unmarried:
54.8% (27)
Women who did not give birth in the past 12 months Now married:
59.6% (840)Unmarried:
40.4% (569)
Marital status - Two or more races population 15 years and over
Males 34.7% Never married59.1% Now married1.5% Separated0.6% Widowed4.1% DivorcedFemales 50.0% Never married40.0% Now married0.8% Separated3.0% Widowed6.2% DivorcedWomen who gave birth in the past 12 months Now married:
94.6% (145)Unmarried:
5.4% (8)
Women who did not give birth in the past 12 months Now married:
33.7% (1,370)Unmarried:
66.3% (2,691)
Marital status - White alone, not Hispanic / Latino population 15 years and over
Males 26.1% Never married62.6% Now married1.0% Separated2.6% Widowed7.7% DivorcedFemales 25.7% Never married56.9% Now married0.6% Separated7.1% Widowed9.7% DivorcedWomen who gave birth in the past 12 months Now married:
100.0% (715)Unmarried:
0.0% (0)
Women who did not give birth in the past 12 months Now married:
43.7% (9,350)Unmarried:
56.3% (12,034)
Marital status - Hispanic or Latino population 15 years and over
Males 40.1% Never married50.3% Now married1.6% Separated0.6% Widowed7.4% DivorcedFemales 35.5% Never married46.5% Now married4.3% Separated4.2% Widowed9.6% DivorcedWomen who gave birth in the past 12 months Now married:
60.1% (125)Unmarried:
39.9% (83)
Women who did not give birth in the past 12 months Now married:
49.0% (1,781)Unmarried:
51.0% (1,857)
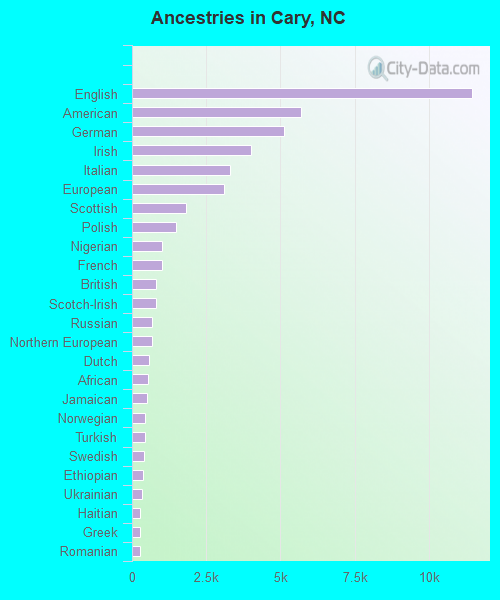
Ancestries in Cary
11,457 11.4% English5,685 5.7% American5,110 5.1% German3,999 4.0% Irish3,300 3.3% Italian3,091 3.1% European1,827 1.8% Scottish1,490 1.5% Polish1,018 1.0% Nigerian1,009 1.0% French821 0.8% British796 0.8% Scotch-Irish686 0.7% Russian661 0.7% Northern European569 0.6% Dutch555 0.6% African499 0.5% Jamaican453 0.5% Norwegian448 0.4% Turkish421 0.4% Swedish371 0.4% Ethiopian335 0.3% Ukrainian285 0.3% Haitian283 0.3% Greek270 0.3% Romanian260 0.3% Canadian252 0.3% Welsh248 0.2% Scandinavian244 0.2% Jordanian233 0.2% Somali220 0.2% Lebanese220 0.2% Eastern European206 0.2% French Canadian197 0.2% Iranian188 0.2% Lithuanian188 0.2% Slovak186 0.2% Palestinian180 0.2% Moroccan171 0.2% Egyptian166 0.2% Hungarian146 0.1% Swiss137 0.1% Finnish131 0.1% Armenian129 0.1% Bulgarian128 0.1% Arab122 0.1% Liberian113 0.1% Danish109 0.1% Afghan98 0.10% Icelander88 0.09% Albanian86 0.09% Portuguese80 0.08% Czech80 0.08% Croatian79 0.08% Trinidadian and Tobagonian71 0.07% Syrian67 0.07% Sudanese61 0.06% British West Indian59 0.06% West Indian56 0.06% Yugoslavian46 0.05% Brazilian44 0.04% Slovene36 0.04% Kenyan33 0.03% Cypriot32 0.03% Luxembourger32 0.03% Cajun31 0.03% Czechoslovakian28 0.03% Senegalese23 0.02% South African17 0.02% Slavic15 0.01% Austrian14 0.01% Belgian10 0.01% Bahamian10 0.01% Barbadian9 0.01% Celtic8 0.01% Serbian6 0.01% Assyrian
Geographical mobility in Cary Same house 1 year ago 91,828 88.1% White (Caucasian)13,438 86.4% Black or African American234 98.6% American Indian / Alaska Native33,499 83.4% Asian126 62.3% Native Hawaiian / Pacific Islander4,650 77.3% Other race10,559 87.5% Two or more races90,205 88.3% White alone, not Hispanic / Latino10,919 85.3% Hispanic or LatinoMoved within same county 5,213 5.0% White / Caucasian885 5.7% Black or African American14 5.9% American Indian / Alaska Native3,638 9.1% Asian11 5.5% Native Hawaiian / Pacific Islander307 5.1% Other race445 3.7% Two or more races5,213 5.1% White alone, not Hispanic / Latino255 2.0% Hispanic or LatinoMoved within same state 1,417 1.4% White / Caucasian135 0.9% Black or African American615 1.5% Asian173 2.9% Other race77 0.6% Two or more races1,417 1.4% White alone, not Hispanic / LatinoMoved from different state 5,050 4.8% White / Caucasian677 4.4% Black or African American35 14.8% American Indian / Alaska Native2,149 5.3% Asian44 21.9% Native Hawaiian / Pacific Islander735 12.2% Other race579 4.8% Two or more races4,559 4.5% White alone, not Hispanic / Latino1,052 8.2% Hispanic or LatinoMoved from abroad 710 0.7% White423 2.7% Black or African American280 0.7% Asian63 1.0% Other race409 3.4% Two or more races710 0.7% White alone, not Hispanic / Latino577 4.5% Hispanic or Latino
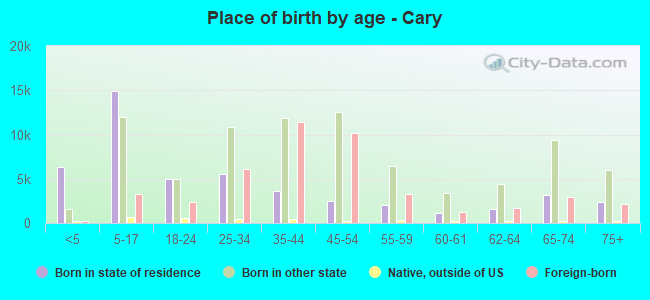
Children Nativity (place of birth) in Cary
Children under 6 years - Living with two parents Both parents native 4,549 100.0% NativeBoth parents foreign-born 3,805 97.0% Native116 3.0% Foreign-bornOne native, one foreign-born parent 930 100.0% NativeChildren under 6 years - Living with one parent Native parent 257 100.0% NativeForeign-born parent 84 100.0% NativeChildren 6 to 17 years - Living with two parents Both parents native 11,386 100.0% NativeBoth parents foreign-born 5,896 67.1% Native2,888 32.9% Foreign-bornOne native, one foreign-born parent 2,082 100.0% NativeChildren 6 to 17 years - Living with one parent Native parent 2,870 100.0% NativeForeign-born parent 2,393 50.5% Native2,343 49.5% Foreign-born
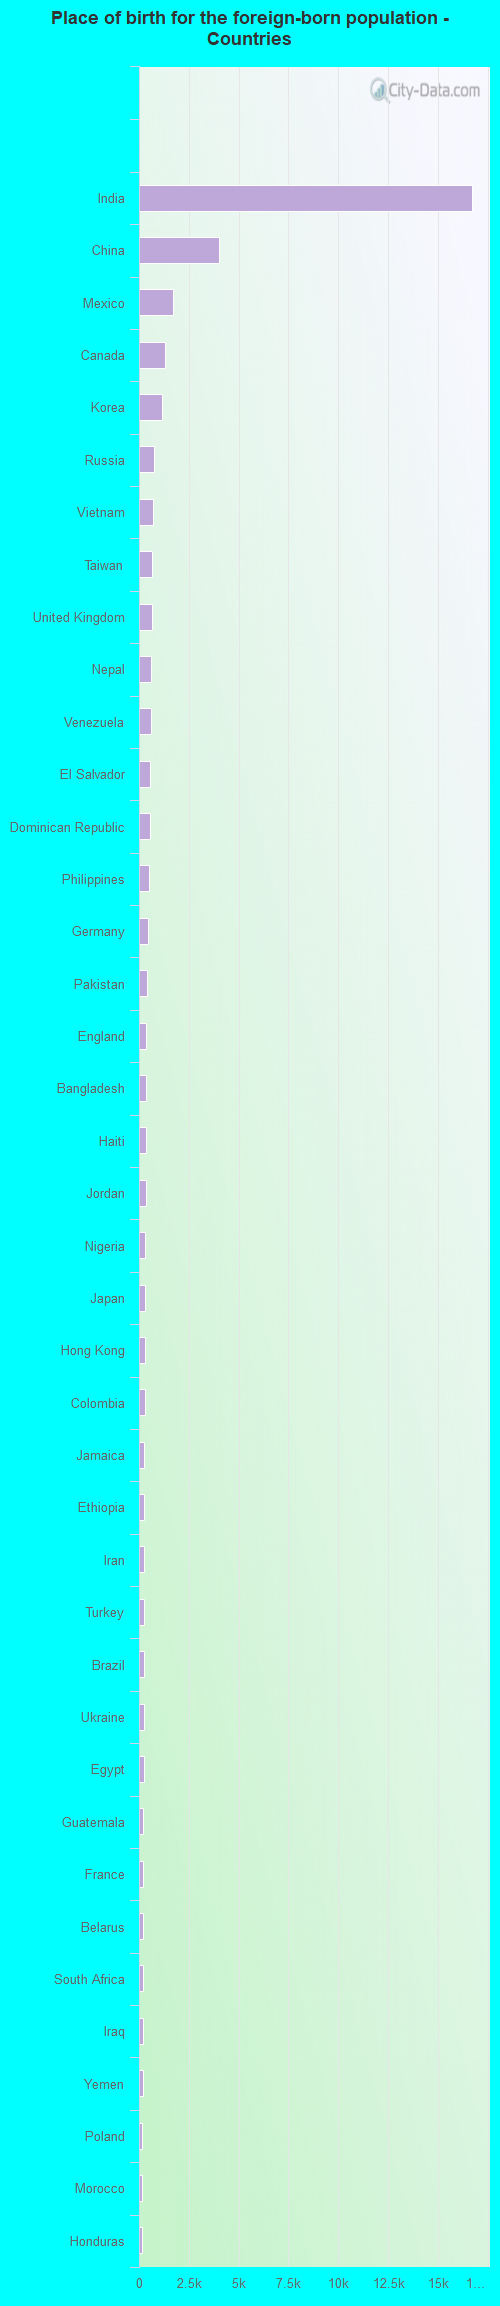
Place of birth for residents in Cary 28,139 Asia18,602 South Central Asia7,086 Americas6,473 Eastern Asia5,803 Latin America4,994 China4,447 Europe2,810 Central America2,217 Africa1,931 Eastern Europe1,681 South Eastern Asia1,541 South America1,451 Caribbean1,414 Northern Europe1,283 Northern America1,267 Western Asia797 Western Europe683 Eastern Africa565 Western Africa552 Northern Africa304 Southern Europe192 Oceania190 Southern Africa162 Australia and New Zealand Subregion149 Middle Africa16,726 India4,030 China1,717 Mexico1,283 Canada1,171 Korea743 Russia725 Vietnam669 Taiwan662 United Kingdom586 Nepal580 Venezuela575 El Salvador574 Dominican Republic512 Philippines473 Germany407 Pakistan373 England366 Bangladesh331 Haiti330 Jordan323 Nigeria308 Japan293 Hong Kong287 Colombia272 Jamaica265 Ethiopia261 Iran259 Turkey242 Brazil232 Ukraine227 Egypt220 Guatemala198 France192 Belarus190 South Africa188 Iraq176 Yemen174 Poland169 Morocco155 Honduras151 Indonesia137 Ecuador134 Kenya125 Scotland123 Argentina119 Cameroon114 Greece113 United Arab Emirates109 Australia107 Moldova100 Kazakhstan97 Ireland92 Italy89 Romania89 Somalia87 Thailand84 Chile78 Spain78 Panama73 Trinidad and Tobago70 Afghanistan70 Sudan69 Singapore69 Israel69 Zimbabwe69 Hungary66 Lebanon64 Czechoslovakia64 Bulgaria63 Malaysia62 Sri Lanka60 Switzerland53 Lithuania52 New Zealand50 Cuba49 Syria48 Uganda47 Netherlands47 Senegal46 Bahamas45 Sweden44 Liberia42 Ghana42 Sierra Leone41 Laos39 Peru38 Croatia34 Costa Rica34 Algeria30 Cambodia30 St. Lucia30 Democratic Republic of Congo (Zaire)28 Nicaragua22 Uruguay20 Micronesia20 Uzbekistan20 Albania19 Portugal17 Belgium15 Serbia14 Barbados13 Eritrea12 Denmark11 Bolivia9 Bosnia and Herzegovina9 Fiji8 Tanzania5 Guyana
Grandparents responsible for own grandchildren in Cary
Grandparents (30 to 59 years) White / Caucasian 13 6.8% Responsible for grandchildren171 93.2% Not responsible for grandchildrenBlack or African American 7 3.9% Responsible for grandchildren174 96.1% Not responsible for grandchildrenAsian 70 73.7% Responsible for grandchildren25 26.3% Not responsible for grandchildrenOther race 52 100.0% Not responsible for grandchildrenTwo or more races 46 81.8% Responsible for grandchildren10 18.2% Not responsible for grandchildrenWhite alone, not Hispanic / Latino 13 11.4% Responsible for grandchildren102 88.6% Not responsible for grandchildrenHispanic or Latino 27 17.1% Responsible for grandchildren131 82.9% Not responsible for grandchildrenGrandparents (60 years and over) White / Caucasian 501 58.2% Responsible for grandchildren360 41.8% Not responsible for grandchildrenBlack or African American 22 16.2% Responsible for grandchildren115 83.8% Not responsible for grandchildrenAsian 9 0.6% Responsible for grandchildren1,476 99.4% Not responsible for grandchildrenTwo or more races 87 38.3% Responsible for grandchildren139 61.7% Not responsible for grandchildrenWhite alone, not Hispanic / Latino 510 61.1% Responsible for grandchildren324 38.9% Not responsible for grandchildrenHispanic or Latino 134 100.0% Not responsible for grandchildren