Races in Castlewood, Colorado (CO) Detailed Stats
Ancestries, Foreign-born residents, place of birth

Recent posts about races in Castlewood, Colorado on our local forum with over 2,400,000 registered users:
 | Englewood Clarification (26 replies) |
| Neighborhoods in cherry creek school district? (23 replies) |
| Need Help w/Area to Move To (Neighborhoods, Schools, Etc) (25 replies) |
| Castlewood Area of Centennial - Any info? (29 replies) |
| Relocating: Job in Centennial, Likelihood of Living West of Denver (65 replies) |
| Parker or SE Aurora? (Yes, another thread.) (35 replies) |
7.0% of Castlewood, CO residents are foreign-born (2.3% born in Asia, 1.4% born in Europe, 1.2% born in Latin America, 1.1% born in North America), which is 28.3% less than the foreign-born rate of 9.0% across the entire state of Colorado.
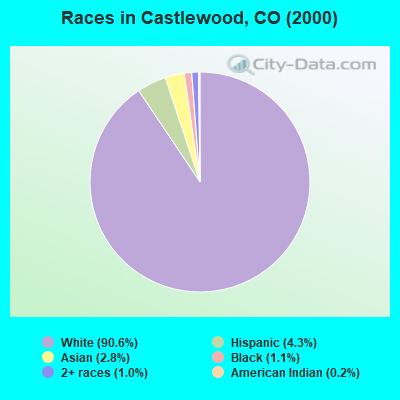
Race distribution in Castlewood

- 23,16790.6%White alone
- 1,0984.3%Hispanic
- 7092.8%Asian alone
- 2691.1%Black alone
- 2531.0%Two or more races
- 460.2%American Indian alone
- 200.08%Other race alone
- 50.02%Native Hawaiian and Other
Pacific Islander alone
2000
2022
-
- 3,202,88074.5%White alone
- 735,60117.1%Hispanic
- 158,4433.7%Black alone
- 93,2772.2%Asian alone
- 72,7211.7%Two or more races
- 28,9820.7%American Indian alone
- 5,5120.1%Other race alone
- 3,8450.09%Native Hawaiian and Other
Pacific Islander alone

-
- 3,793,27065.0%White alone
- 1,314,96222.5%Hispanic
- 268,7544.6%Two or more races
- 220,7563.8%Black alone
- 182,6583.1%Asian alone
- 29,7980.5%Other race alone
- 23,3890.4%American Indian alone
- 6,3390.1%Native Hawaiian and Other
Pacific Islander alone

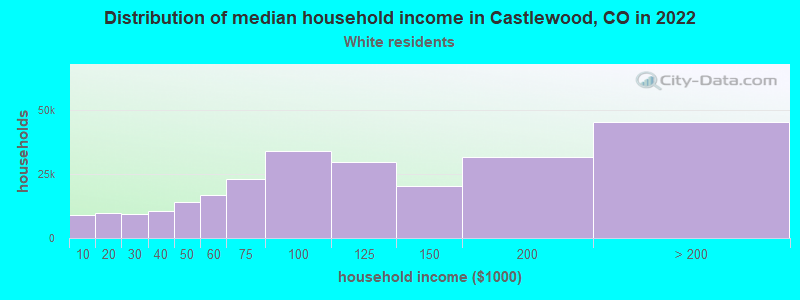
Income and house value in Castlewood
- Median household income in 2022
- $154,702White non-Hispanic householders
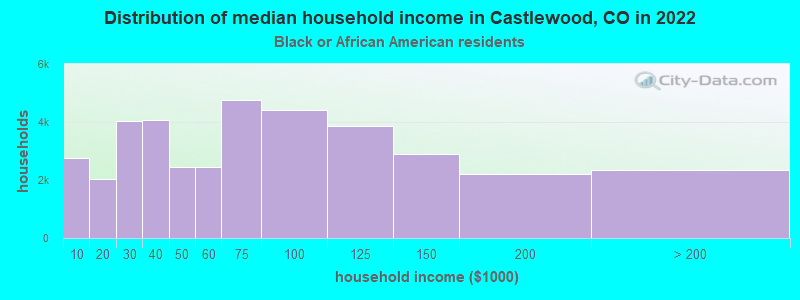
- $99,201Black householders
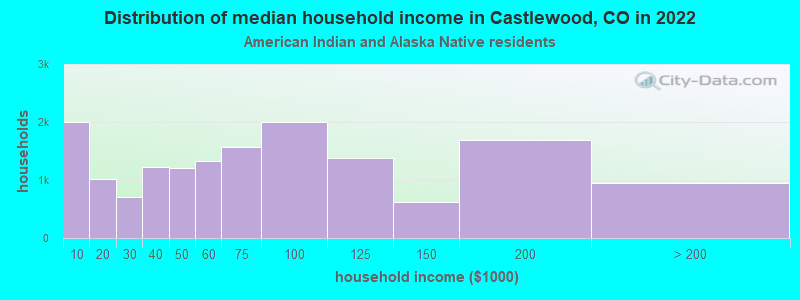
- $76,640American Indian and Alaska Native householders
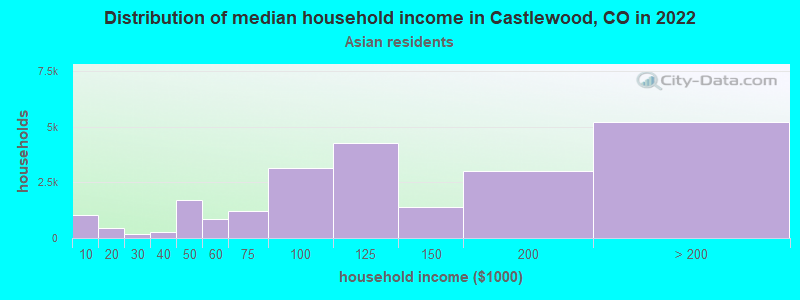
- $177,207Asian householders
- $97,789Native Hawaiian and other Pacific Islander householders
- over $200,000Some other race householders
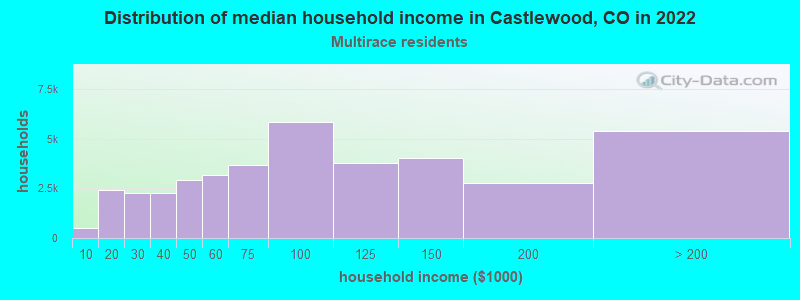
- $138,192Two or more races householders
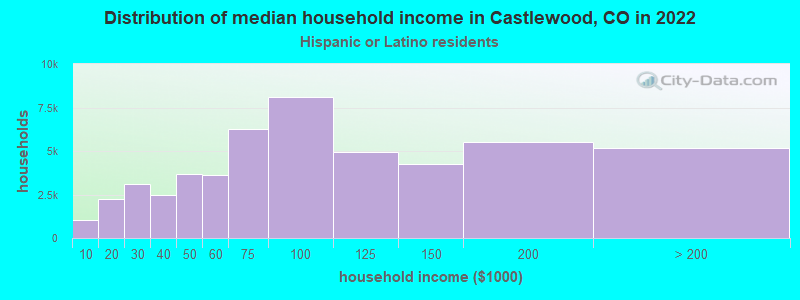
- $114,868Hispanic or Latino race householders
- Median 2022 house value
- $781,224White Non-Hispanic householders
- $646,210Black or African American householders
- $756,344Asian householders
- $621,994Native Hawaiian and other Pacific Islander householders
- $733,787Some other race householders
- $822,359Two or more races householders
- $773,594Hispanic or Latino householders
Household income for White non-Hispanic householders
Household income for Black householders
Household income for American Indian and Alaska Native householders
Household income for Asian householders
Household income for Native Hawaiian and other Pacific Islander householders

Household income for Two or more races householders
Household income for Hispanic or Latino race householders
Foreign-born residents in Castlewood
1,794 residents are foreign born (2.3% Asia, 1.4% Europe, 1.2% Latin America, 1.1% North America).
| This city: | 7.0% |
| Colorado: | 8.6% |
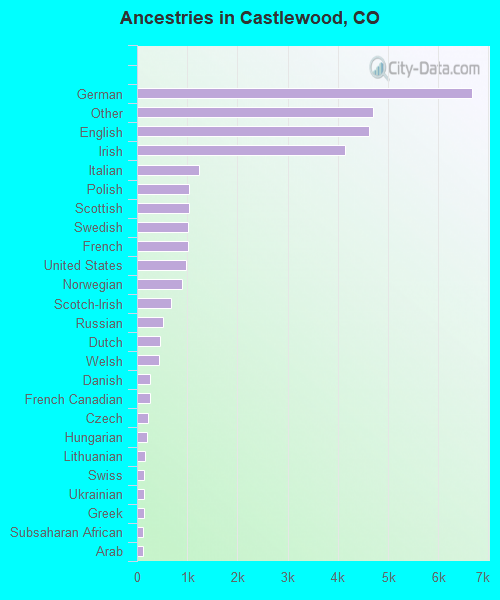
Ancestries in Castlewood

- 6,67721.3%German
- 4,69515.0%Other
- 4,62514.8%English
- 4,14113.2%Irish
- 1,2303.9%Italian
- 1,0393.3%Polish
- 1,0303.3%Scottish
- 1,0153.2%Swedish
- 1,0113.2%French
- 9823.1%United States
- 8942.9%Norwegian
- 6742.2%Scotch-Irish
- 5161.6%Russian
- 4501.4%Dutch
- 4381.4%Welsh
- 2550.8%Danish
- 2500.8%French Canadian
- 2280.7%Czech
- 2030.6%Hungarian
- 1520.5%Lithuanian
- 1410.5%Swiss
- 1330.4%Ukrainian
- 1310.4%Greek
- 1150.4%Subsaharan African
- 1120.4%Arab
- 740.2%Slovak
- 550.2%Portuguese
- 430.1%West Indian
Zip codes: 80112.