Races in Castroville, California (CA) Detailed Stats
Data:
Races - White alone (%)
Races - White alone (% change since 2000)
Races - Black alone (%)
Races - Black alone (% change since 2000)
Races - American Indian alone (%)
Races - American Indian alone (% change since 2000)
Races - Asian alone (%)
Races - Asian alone (% change since 2000)
Races - Hispanic (%)
Races - Hispanic (% change since 2000)
Races - Native Hawaiian and Other Pacific Islander alone (%)
Races - Native Hawaiian and Other Pacific Islander alone (% change since 2000)
Races - Two or more races(%)
Races - Two or more races(% change since 2000)
Races - Other race alone (%)
Races - Other race alone (% change since 2000)
Racial diversity
Place of birth - Born in state of residence (%)
Place of birth - Born in state of residence (%) - White
Place of birth - Born in state of residence (%) - Black or African American
Place of birth - Born in state of residence (%) - Asian
Place of birth - Born in state of residence (%) - Hispanic or Latino
Place of birth - Born in state of residence (%) - American Indian and Alaska Native
Place of birth - Born in state of residence (%) - Multirace
Place of birth - Born in state of residence (%) - Other Race
Place of birth - Born in other state (%)
Place of birth - Born in other state (%) - White
Place of birth - Born in other state (%) - Black or African American
Place of birth - Born in other state (%) - Asian
Place of birth - Born in other state (%) - Hispanic or Latino
Place of birth - Born in other state (%) - American Indian and Alaska Native
Place of birth - Born in other state (%) - Multirace
Place of birth - Born in other state (%) - Other Race
Place of birth - Native, outside of US (%)
Place of birth - Native, outside of US (%) - White
Place of birth - Native, outside of US (%) - Black or African American
Place of birth - Native, outside of US (%) - Asian
Place of birth - Native, outside of US (%) - Hispanic or Latino
Place of birth - Native, outside of US (%) - American Indian and Alaska Native
Place of birth - Native, outside of US (%) - Multirace
Place of birth - Native, outside of US (%) - Other Race
Place of birth - Foreign born (%)
Place of birth - Foreign born (%) - White
Place of birth - Foreign born (%) - Black or African American
Place of birth - Foreign born (%) - Asian
Place of birth - Foreign born (%) - Hispanic or Latino
Place of birth - Foreign born (%) - American Indian and Alaska Native
Place of birth - Foreign born (%) - Multirace
Place of birth - Foreign born (%) - Other Race
Residents speaking English at home (%)
Residents speaking English at home - Born in the United States (%)
Residents speaking English at home - Native, born elsewhere (%)
Residents speaking English at home - Foreign born (%)
Residents speaking Spanish at home (%)
Residents speaking Spanish at home - Born in the United States (%)
Residents speaking Spanish at home - Native, born elsewhere (%)
Residents speaking Spanish at home - Foreign born (%)
Residents speaking other language at home (%)
Residents speaking other language at home - Born in the United States (%)
Residents speaking other language at home - Native, born elsewhere (%)
Residents speaking other language at home - Foreign born (%)
Marital status - Never married (%)
Marital status - Now married (%)
Marital status - Separated (%)
Marital status - Widowed (%)
Marital status - Divorced (%)
Ancestries Reported - Arab (%)
Ancestries Reported - Czech (%)
Ancestries Reported - Danish (%)
Ancestries Reported - Dutch (%)
Ancestries Reported - English (%)
Ancestries Reported - French (%)
Ancestries Reported - French Canadian (%)
Ancestries Reported - German (%)
Ancestries Reported - Greek (%)
Ancestries Reported - Hungarian (%)
Ancestries Reported - Irish (%)
Ancestries Reported - Italian (%)
Ancestries Reported - Lithuanian (%)
Ancestries Reported - Norwegian (%)
Ancestries Reported - Polish (%)
Ancestries Reported - Portuguese (%)
Ancestries Reported - Russian (%)
Ancestries Reported - Scotch-Irish (%)
Ancestries Reported - Scottish (%)
Ancestries Reported - Slovak (%)
Ancestries Reported - Subsaharan African (%)
Ancestries Reported - Swedish (%)
Ancestries Reported - Swiss (%)
Ancestries Reported - Ukrainian (%)
Ancestries Reported - United States (%)
Ancestries Reported - Welsh (%)
Ancestries Reported - West Indian (%)
Ancestries Reported - Other (%)
Geographical mobility - Same house 1 year ago (%)
Geographical mobility - Same house 1 year ago (%) - White
Geographical mobility - Same house 1 year ago (%) - Black or African American
Geographical mobility - Same house 1 year ago (%) - Asian
Geographical mobility - Same house 1 year ago (%) - Hispanic or Latino
Geographical mobility - Same house 1 year ago (%) - American Indian and Alaska Native
Geographical mobility - Same house 1 year ago (%) - Multirace
Geographical mobility - Same house 1 year ago (%) - Other Race
Geographical mobility - Moved within same county (%)
Geographical mobility - Moved within same county (%) - White
Geographical mobility - Moved within same county (%) - Black or African American
Geographical mobility - Moved within same county (%) - Asian
Geographical mobility - Moved within same county (%) - Hispanic or Latino
Geographical mobility - Moved within same county (%) - American Indian and Alaska Native
Geographical mobility - Moved within same county (%) - Multirace
Geographical mobility - Moved within same county (%) - Other Race
Geographical mobility - Moved from different county within same state (%)
Geographical mobility - Moved from different county within same state (%) - White
Geographical mobility - Moved from different county within same state (%) - Black or African American
Geographical mobility - Moved from different county within same state (%) - Asian
Geographical mobility - Moved from different county within same state (%) - Hispanic or Latino
Geographical mobility - Moved from different county within same state (%) - American Indian and Alaska Native
Geographical mobility - Moved from different county within same state (%) - Multirace
Geographical mobility - Moved from different county within same state (%) - Other Race
Geographical mobility - Moved from different state (%)
Geographical mobility - Moved from different state (%) - White
Geographical mobility - Moved from different state (%) - Black or African American
Geographical mobility - Moved from different state (%) - Asian
Geographical mobility - Moved from different state (%) - Hispanic or Latino
Geographical mobility - Moved from different state (%) - American Indian and Alaska Native
Geographical mobility - Moved from different state (%) - Multirace
Geographical mobility - Moved from different state (%) - Other Race
Geographical mobility - Moved from abroad (%)
Geographical mobility - Moved from abroad (%) - White
Geographical mobility - Moved from abroad (%) - Black or African American
Geographical mobility - Moved from abroad (%) - Asian
Geographical mobility - Moved from abroad (%) - Hispanic or Latino
Geographical mobility - Moved from abroad (%) - American Indian and Alaska Native
Geographical mobility - Moved from abroad (%) - Multirace
Geographical mobility - Moved from abroad (%) - Other Race
Place of birth for the foreign-born population - Ireland (%)
Place of birth for the foreign-born population - Denmark (%)
Place of birth for the foreign-born population - Norway (%)
Place of birth for the foreign-born population - Sweden (%)
Place of birth for the foreign-born population - United Kingdom (%)
Place of birth for the foreign-born population - England (%)
Place of birth for the foreign-born population - Scotland (%)
Place of birth for the foreign-born population - Other Northern Europe (%)
Place of birth for the foreign-born population - Austria (%)
Place of birth for the foreign-born population - Belgium (%)
Place of birth for the foreign-born population - France (%)
Place of birth for the foreign-born population - Germany (%)
Place of birth for the foreign-born population - Netherlands (%)
Place of birth for the foreign-born population - Switzerland (%)
Place of birth for the foreign-born population - Other Western Europe (%)
Place of birth for the foreign-born population - Greece (%)
Place of birth for the foreign-born population - Italy (%)
Place of birth for the foreign-born population - Portugal (%)
Place of birth for the foreign-born population - Spain (%)
Place of birth for the foreign-born population - Other Southern Europe (%)
Place of birth for the foreign-born population - Albania (%)
Place of birth for the foreign-born population - Belarus (%)
Place of birth for the foreign-born population - Bosnia and Herzegovina (%)
Place of birth for the foreign-born population - Bulgaria (%)
Place of birth for the foreign-born population - Croatia (%)
Place of birth for the foreign-born population - Czechoslovakia (%)
Place of birth for the foreign-born population - Hungary (%)
Place of birth for the foreign-born population - Latvia (%)
Place of birth for the foreign-born population - Lithuania (%)
Place of birth for the foreign-born population - North Macedonia (Macedonia) (%)
Place of birth for the foreign-born population - Moldova (%)
Place of birth for the foreign-born population - Poland (%)
Place of birth for the foreign-born population - Romania (%)
Place of birth for the foreign-born population - Russia (%)
Place of birth for the foreign-born population - Serbia (%)
Place of birth for the foreign-born population - Ukraine (%)
Place of birth for the foreign-born population - Other Eastern Europe (%)
Place of birth for the foreign-born population - China (%)
Place of birth for the foreign-born population - Hong Kong (%)
Place of birth for the foreign-born population - Taiwan (%)
Place of birth for the foreign-born population - Japan (%)
Place of birth for the foreign-born population - Korea (%)
Place of birth for the foreign-born population - Other Eastern Asia (%)
Place of birth for the foreign-born population - Afghanistan (%)
Place of birth for the foreign-born population - Bangladesh (%)
Place of birth for the foreign-born population - India (%)
Place of birth for the foreign-born population - Iran (%)
Place of birth for the foreign-born population - Kazakhstan (%)
Place of birth for the foreign-born population - Nepal (%)
Place of birth for the foreign-born population - Pakistan (%)
Place of birth for the foreign-born population - Sri Lanka (%)
Place of birth for the foreign-born population - Uzbekistan (%)
Place of birth for the foreign-born population - Other South Central Asia (%)
Place of birth for the foreign-born population - Burma (%)
Place of birth for the foreign-born population - Cambodia (%)
Place of birth for the foreign-born population - Indonesia (%)
Place of birth for the foreign-born population - Laos (%)
Place of birth for the foreign-born population - Malaysia (%)
Place of birth for the foreign-born population - Philippines (%)
Place of birth for the foreign-born population - Singapore (%)
Place of birth for the foreign-born population - Thailand (%)
Place of birth for the foreign-born population - Vietnam (%)
Place of birth for the foreign-born population - Other South Eastern Asia (%)
Place of birth for the foreign-born population - Armenia (%)
Place of birth for the foreign-born population - Iraq (%)
Place of birth for the foreign-born population - Israel (%)
Place of birth for the foreign-born population - Jordan (%)
Place of birth for the foreign-born population - Kuwait (%)
Place of birth for the foreign-born population - Lebanon (%)
Place of birth for the foreign-born population - Saudi Arabia (%)
Place of birth for the foreign-born population - Syria (%)
Place of birth for the foreign-born population - Turkey (%)
Place of birth for the foreign-born population - Yemen (%)
Place of birth for the foreign-born population - Other Western Asia (%)
Place of birth for the foreign-born population - Eritrea (%)
Place of birth for the foreign-born population - Ethiopia (%)
Place of birth for the foreign-born population - Kenya (%)
Place of birth for the foreign-born population - Somalia (%)
Place of birth for the foreign-born population - Uganda (%)
Place of birth for the foreign-born population - Zimbabwe (%)
Place of birth for the foreign-born population - Other Eastern Africa (%)
Place of birth for the foreign-born population - Cameroon (%)
Place of birth for the foreign-born population - Congo (%)
Place of birth for the foreign-born population - Democratic Republic of Congo (Zaire) (%)
Place of birth for the foreign-born population - Other Middle Africa (%)
Place of birth for the foreign-born population - Egypt (%)
Place of birth for the foreign-born population - Morocco (%)
Place of birth for the foreign-born population - Sudan (%)
Place of birth for the foreign-born population - Other Northern Africa (%)
Place of birth for the foreign-born population - South Africa (%)
Place of birth for the foreign-born population - Other Southern Africa (%)
Place of birth for the foreign-born population - Cabo Verde (%)
Place of birth for the foreign-born population - Ghana (%)
Place of birth for the foreign-born population - Liberia (%)
Place of birth for the foreign-born population - Nigeria (%)
Place of birth for the foreign-born population - Senegal (%)
Place of birth for the foreign-born population - Sierra Leone (%)
Place of birth for the foreign-born population - Other Western Africa (%)
Place of birth for the foreign-born population - Australia (%)
Place of birth for the foreign-born population - New Zealand (%)
Place of birth for the foreign-born population - Fiji (%)
Place of birth for the foreign-born population - Micronesia (%)
Place of birth for the foreign-born population - Bahamas (%)
Place of birth for the foreign-born population - Barbados (%)
Place of birth for the foreign-born population - Cuba (%)
Place of birth for the foreign-born population - Dominica (%)
Place of birth for the foreign-born population - Dominican Republic (%)
Place of birth for the foreign-born population - Grenada (%)
Place of birth for the foreign-born population - Haiti (%)
Place of birth for the foreign-born population - Jamaica (%)
Place of birth for the foreign-born population - St. Vincent and the Grenadines (%)
Place of birth for the foreign-born population - Trinidad and Tobago (%)
Place of birth for the foreign-born population - West Indies (%)
Place of birth for the foreign-born population - Other Caribbean (%)
Place of birth for the foreign-born population - Belize (%)
Place of birth for the foreign-born population - Costa Rica (%)
Place of birth for the foreign-born population - El Salvador (%)
Place of birth for the foreign-born population - Guatemala (%)
Place of birth for the foreign-born population - Honduras (%)
Place of birth for the foreign-born population - Mexico (%)
Place of birth for the foreign-born population - Nicaragua (%)
Place of birth for the foreign-born population - Panama (%)
Place of birth for the foreign-born population - Other Central America (%)
Place of birth for the foreign-born population - Argentina (%)
Place of birth for the foreign-born population - Bolivia (%)
Place of birth for the foreign-born population - Brazil (%)
Place of birth for the foreign-born population - Chile (%)
Place of birth for the foreign-born population - Colombia (%)
Place of birth for the foreign-born population - Ecuador (%)
Place of birth for the foreign-born population - Guyana (%)
Place of birth for the foreign-born population - Peru (%)
Place of birth for the foreign-born population - Uruguay (%)
Place of birth for the foreign-born population - Venezuela (%)
Place of birth for the foreign-born population - Other South America (%)
Place of birth for the foreign-born population - Canada (%)
Place of birth for the foreign-born population - Other Northern America (%)
Place of birth for the foreign-born population - Other (%)
Latest news about races in Castroville, CA collected exclusively by city-data.com from local newspapers, TV, and radio stations
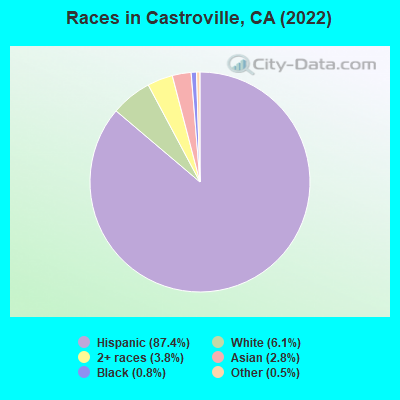
According to 2022 data, the most numerous races in Castroville, CA are Hispanic (6,013 residents), White alone (498 residents), and Asian alone (179 residents). 16.0% of Castroville residents speak English at home. 48.3% of Castroville, CA residents are foreign-born (46.5% born in Latin America), which is 46.1% greater than the foreign-born rate of 26.0% across the entire state of California.
Race distribution in Castroville
2000 2022
15,816,790 46.7% White alone 10,966,556 32.4% Hispanic 3,648,860 10.8% Asian alone 2,181,926 6.4% Black alone 903,115 2.7% Two or more races 178,984 0.5% American Indian alone 103,736 0.3% Native Hawaiian and Other 71,681 0.2% Other race alone
15,732,184 40.3% Hispanic 13,160,426 33.7% White alone 5,957,867 15.3% Asian alone 2,025,218 5.2% Black alone 1,663,222 4.3% Two or more races 251,618 0.6% Other race alone 135,777 0.3% Native Hawaiian and Other 103,030 0.3% American Indian alone
Income and house value in Castroville Median household income in 2022 $79,310 White non-Hispanic householders$79,042 Black householdersover $200,000 American Indian and Alaska Native householders$124,562 Asian householders$73,039 Some other race householders$23,159 Two or more races householders$75,366 Hispanic or Latino race householdersMedian 2022 house value $706,541 White Non-Hispanic householders$341,933 American Indian or Alaska Native householders $513,619 Asian householders$616,919 Some other race householders$648,233 Two or more races householders$614,399 Hispanic or Latino householders
Median age by race in Castroville
34.7 Median age for White residents36.5 31.0 52.0 Median age for Black or African American residents17.1 Median age for American Indian / Alaska Native residents47.6 Median age for Asian residents46.5 65.4 36.3 Median age for Native Hawaiian / Pacific Islander residents27.2 Median age for Other race residents28.4 26.1 67.4 Median age for Two or more races residents37.6 Median age for White alone residents38.3 33.3 28.4 Median age for Hispanic or Latino residents30.7 27.1
Owner/renter occupied households by race in Castroville
House owners and renters - White residents 202 45.7% Owner occupied240 54.3% Renter occupiedHouse owners and renters - Asian residents 72 100.0% Owner occupiedHouse owners and renters - Other race residents 312 27.0% Owner occupied844 73.0% Renter occupiedHouse owners and renters - Two or more races residents 68 71.5% Owner occupied27 28.5% Renter occupiedHouse owners and renters - White alone residents 103 50.0% Owner occupied103 50.0% Renter occupiedHouse owners and renters - Hispanic or Latino residents 395 31.6% Owner occupied856 68.4% Renter occupied
Language usage in Castroville
English speakers - Total 16.0% of residents of Castroville speak English at home.
79.7% of residents speak Spanish at home 2,055 44.0% Speak English very well2,619 56.0% Speak English less than very well2.3% of residents speak other language at home 22 16.5% Speak English very well111 83.5% Speak English less than very well
English speakers - Born in the United States 65.1% of residents of Castroville speak English at home.
22.9% of residents speak Spanish at home 9 47.4% Speak English very well10 52.6% Speak English less than very well9.6% of residents speak other language at home 8 100.0% Speak English very well
All residents speak only English at home
English speakers - Foreign-born 5.6% of residents of Castroville speak English at home.
86.6% of residents speak Spanish at home 405 15.4% Speak English very well2,231 84.6% Speak English less than very well4.1% of residents speak other language at home 14 11.3% Speak English very well110 88.7% Speak English less than very well
White (Caucasian) - Speak only English Native:
45.8% (429)Foreign-born:
9.0% (36)
White (Caucasian) - Speak another language Native:
37.0% (346)Foreign-born:
85.3% (340)
Asian - Speak only English Native:
100.0% (136)Foreign-born:
36.8% (26)
Other race - Speak only English Native:
13.5% (238)Foreign-born:
6.0% (139)
Other race - Speak another language Native:
83.7% (1,477)Foreign-born:
94.1% (2,170)
Two or more races - Speak another language Native:
99.4% (44)Foreign-born:
100.0% (138)
White alone - Speak another language Native:
8.6% (32)Foreign-born:
96.5% (122)
Hispanic or Latino - Speak only English Native:
14.5% (372)Foreign-born:
8.1% (215)
Hispanic or Latino - Speak another language Native:
82.8% (2,116)Foreign-born:
93.0% (2,478)
Foreign-born residents in Castroville 3,157 residents are foreign born (46.5% Latin America ).
This city:
48.3%California:
100.0%
Marital status for residents in Castroville Marital status - White (Caucasian) population 15 years and over
Males 40.7% Never married45.5% Now married0.8% Separated3.3% Widowed9.8% DivorcedFemales 23.6% Never married46.0% Now married1.0% Separated2.3% Widowed27.1% DivorcedWomen who gave birth in the past 12 months Now married:
80.6% (19)Unmarried:
19.4% (4)
Women who did not give birth in the past 12 months Now married:
39.6% (137)Unmarried:
60.4% (209)
Marital status - Asian population 15 years and over
Males 51.4% Never married48.6% Now married0.0% Separated0.0% Widowed0.0% DivorcedFemales 44.2% Never married10.5% Now married0.0% Separated45.3% Widowed0.0% DivorcedWomen who did not give birth in the past 12 months Now married:
0.0% (0)Unmarried:
100.0% (34)
Marital status - Other race population 15 years and over
Males 44.9% Never married47.3% Now married0.0% Separated5.9% Widowed1.8% DivorcedFemales 36.4% Never married51.2% Now married0.0% Separated7.5% Widowed4.9% DivorcedWomen who gave birth in the past 12 months Now married:
100.0% (46)Unmarried:
0.0% (0)
Women who did not give birth in the past 12 months Now married:
50.0% (658)Unmarried:
50.0% (658)
Marital status - Two or more races population 15 years and over
Males 0.0% Never married47.1% Now married0.0% Separated52.9% Widowed0.0% DivorcedFemales 34.6% Never married26.9% Now married0.0% Separated0.0% Widowed38.5% DivorcedWomen who did not give birth in the past 12 months Now married:
0.0% (0)Unmarried:
100.0% (21)
Marital status - White alone, not Hispanic / Latino population 15 years and over
Males 38.8% Never married29.8% Now married0.0% Separated9.6% Widowed21.8% DivorcedFemales 16.5% Never married36.2% Now married0.0% Separated4.3% Widowed43.1% DivorcedWomen who gave birth in the past 12 months Now married:
0.0% (0)Unmarried:
100.0% (6)
Women who did not give birth in the past 12 months Now married:
18.0% (20)Unmarried:
82.0% (93)
Marital status - Hispanic or Latino population 15 years and over
Males 43.5% Never married49.3% Now married0.4% Separated4.5% Widowed2.4% DivorcedFemales 33.2% Never married50.4% Now married0.4% Separated5.6% Widowed10.3% DivorcedWomen who gave birth in the past 12 months Now married:
100.0% (63)Unmarried:
0.0% (0)
Women who did not give birth in the past 12 months Now married:
48.6% (679)Unmarried:
51.4% (719)
Ancestries in Castroville
56 1.1% English39 0.8% Irish35 0.7% Italian25 0.5% Swiss23 0.5% Polish7 0.1% American
Children Nativity (place of birth) in Castroville
Children under 6 years - Living with two parents Both parents native 72 100.0% NativeBoth parents foreign-born 216 87.1% Native32 12.9% Foreign-bornOne native, one foreign-born parent 127 100.0% NativeChildren under 6 years - Living with one parent Native parent 209 99.9% Native0 0.1% Foreign-bornForeign-born parent 119 72.5% Native45 27.5% Foreign-bornChildren 6 to 17 years - Living with two parents Both parents native 185 99.4% Native1 0.6% Foreign-bornBoth parents foreign-born 505 73.2% Native185 26.8% Foreign-bornOne native, one foreign-born parent 79 100.0% NativeChildren 6 to 17 years - Living with one parent Native parent 107 100.0% NativeForeign-born parent 80 58.3% Native57 41.7% Foreign-born
Grandparents responsible for own grandchildren in Castroville
Grandparents (30 to 59 years) White / Caucasian 12 16.5% Responsible for grandchildren59 83.5% Not responsible for grandchildrenOther race 58 41.6% Responsible for grandchildren82 58.4% Not responsible for grandchildrenHispanic or Latino 66 28.1% Responsible for grandchildren169 71.9% Not responsible for grandchildrenGrandparents (60 years and over) White / Caucasian 10 31.2% Responsible for grandchildren23 68.8% Not responsible for grandchildrenOther race 61 100.0% Not responsible for grandchildrenHispanic or Latino 15 15.7% Responsible for grandchildren79 84.3% Not responsible for grandchildren