Races in Cedar Hills, Oregon (OR) Detailed Stats
Data:
Races - White alone (%)
Races - White alone (% change since 2000)
Races - Black alone (%)
Races - Black alone (% change since 2000)
Races - American Indian alone (%)
Races - American Indian alone (% change since 2000)
Races - Asian alone (%)
Races - Asian alone (% change since 2000)
Races - Hispanic (%)
Races - Hispanic (% change since 2000)
Races - Native Hawaiian and Other Pacific Islander alone (%)
Races - Native Hawaiian and Other Pacific Islander alone (% change since 2000)
Races - Two or more races(%)
Races - Two or more races(% change since 2000)
Races - Other race alone (%)
Races - Other race alone (% change since 2000)
Racial diversity
Place of birth - Born in state of residence (%)
Place of birth - Born in state of residence (%) - White
Place of birth - Born in state of residence (%) - Black or African American
Place of birth - Born in state of residence (%) - Asian
Place of birth - Born in state of residence (%) - Hispanic or Latino
Place of birth - Born in state of residence (%) - American Indian and Alaska Native
Place of birth - Born in state of residence (%) - Multirace
Place of birth - Born in state of residence (%) - Other Race
Place of birth - Born in other state (%)
Place of birth - Born in other state (%) - White
Place of birth - Born in other state (%) - Black or African American
Place of birth - Born in other state (%) - Asian
Place of birth - Born in other state (%) - Hispanic or Latino
Place of birth - Born in other state (%) - American Indian and Alaska Native
Place of birth - Born in other state (%) - Multirace
Place of birth - Born in other state (%) - Other Race
Place of birth - Native, outside of US (%)
Place of birth - Native, outside of US (%) - White
Place of birth - Native, outside of US (%) - Black or African American
Place of birth - Native, outside of US (%) - Asian
Place of birth - Native, outside of US (%) - Hispanic or Latino
Place of birth - Native, outside of US (%) - American Indian and Alaska Native
Place of birth - Native, outside of US (%) - Multirace
Place of birth - Native, outside of US (%) - Other Race
Place of birth - Foreign born (%)
Place of birth - Foreign born (%) - White
Place of birth - Foreign born (%) - Black or African American
Place of birth - Foreign born (%) - Asian
Place of birth - Foreign born (%) - Hispanic or Latino
Place of birth - Foreign born (%) - American Indian and Alaska Native
Place of birth - Foreign born (%) - Multirace
Place of birth - Foreign born (%) - Other Race
Residents speaking English at home (%)
Residents speaking English at home - Born in the United States (%)
Residents speaking English at home - Native, born elsewhere (%)
Residents speaking English at home - Foreign born (%)
Residents speaking Spanish at home (%)
Residents speaking Spanish at home - Born in the United States (%)
Residents speaking Spanish at home - Native, born elsewhere (%)
Residents speaking Spanish at home - Foreign born (%)
Residents speaking other language at home (%)
Residents speaking other language at home - Born in the United States (%)
Residents speaking other language at home - Native, born elsewhere (%)
Residents speaking other language at home - Foreign born (%)
Marital status - Never married (%)
Marital status - Now married (%)
Marital status - Separated (%)
Marital status - Widowed (%)
Marital status - Divorced (%)
Ancestries Reported - Arab (%)
Ancestries Reported - Czech (%)
Ancestries Reported - Danish (%)
Ancestries Reported - Dutch (%)
Ancestries Reported - English (%)
Ancestries Reported - French (%)
Ancestries Reported - French Canadian (%)
Ancestries Reported - German (%)
Ancestries Reported - Greek (%)
Ancestries Reported - Hungarian (%)
Ancestries Reported - Irish (%)
Ancestries Reported - Italian (%)
Ancestries Reported - Lithuanian (%)
Ancestries Reported - Norwegian (%)
Ancestries Reported - Polish (%)
Ancestries Reported - Portuguese (%)
Ancestries Reported - Russian (%)
Ancestries Reported - Scotch-Irish (%)
Ancestries Reported - Scottish (%)
Ancestries Reported - Slovak (%)
Ancestries Reported - Subsaharan African (%)
Ancestries Reported - Swedish (%)
Ancestries Reported - Swiss (%)
Ancestries Reported - Ukrainian (%)
Ancestries Reported - United States (%)
Ancestries Reported - Welsh (%)
Ancestries Reported - West Indian (%)
Ancestries Reported - Other (%)
Geographical mobility - Same house 1 year ago (%)
Geographical mobility - Same house 1 year ago (%) - White
Geographical mobility - Same house 1 year ago (%) - Black or African American
Geographical mobility - Same house 1 year ago (%) - Asian
Geographical mobility - Same house 1 year ago (%) - Hispanic or Latino
Geographical mobility - Same house 1 year ago (%) - American Indian and Alaska Native
Geographical mobility - Same house 1 year ago (%) - Multirace
Geographical mobility - Same house 1 year ago (%) - Other Race
Geographical mobility - Moved within same county (%)
Geographical mobility - Moved within same county (%) - White
Geographical mobility - Moved within same county (%) - Black or African American
Geographical mobility - Moved within same county (%) - Asian
Geographical mobility - Moved within same county (%) - Hispanic or Latino
Geographical mobility - Moved within same county (%) - American Indian and Alaska Native
Geographical mobility - Moved within same county (%) - Multirace
Geographical mobility - Moved within same county (%) - Other Race
Geographical mobility - Moved from different county within same state (%)
Geographical mobility - Moved from different county within same state (%) - White
Geographical mobility - Moved from different county within same state (%) - Black or African American
Geographical mobility - Moved from different county within same state (%) - Asian
Geographical mobility - Moved from different county within same state (%) - Hispanic or Latino
Geographical mobility - Moved from different county within same state (%) - American Indian and Alaska Native
Geographical mobility - Moved from different county within same state (%) - Multirace
Geographical mobility - Moved from different county within same state (%) - Other Race
Geographical mobility - Moved from different state (%)
Geographical mobility - Moved from different state (%) - White
Geographical mobility - Moved from different state (%) - Black or African American
Geographical mobility - Moved from different state (%) - Asian
Geographical mobility - Moved from different state (%) - Hispanic or Latino
Geographical mobility - Moved from different state (%) - American Indian and Alaska Native
Geographical mobility - Moved from different state (%) - Multirace
Geographical mobility - Moved from different state (%) - Other Race
Geographical mobility - Moved from abroad (%)
Geographical mobility - Moved from abroad (%) - White
Geographical mobility - Moved from abroad (%) - Black or African American
Geographical mobility - Moved from abroad (%) - Asian
Geographical mobility - Moved from abroad (%) - Hispanic or Latino
Geographical mobility - Moved from abroad (%) - American Indian and Alaska Native
Geographical mobility - Moved from abroad (%) - Multirace
Geographical mobility - Moved from abroad (%) - Other Race
Place of birth for the foreign-born population - Ireland (%)
Place of birth for the foreign-born population - Denmark (%)
Place of birth for the foreign-born population - Norway (%)
Place of birth for the foreign-born population - Sweden (%)
Place of birth for the foreign-born population - United Kingdom (%)
Place of birth for the foreign-born population - England (%)
Place of birth for the foreign-born population - Scotland (%)
Place of birth for the foreign-born population - Other Northern Europe (%)
Place of birth for the foreign-born population - Austria (%)
Place of birth for the foreign-born population - Belgium (%)
Place of birth for the foreign-born population - France (%)
Place of birth for the foreign-born population - Germany (%)
Place of birth for the foreign-born population - Netherlands (%)
Place of birth for the foreign-born population - Switzerland (%)
Place of birth for the foreign-born population - Other Western Europe (%)
Place of birth for the foreign-born population - Greece (%)
Place of birth for the foreign-born population - Italy (%)
Place of birth for the foreign-born population - Portugal (%)
Place of birth for the foreign-born population - Spain (%)
Place of birth for the foreign-born population - Other Southern Europe (%)
Place of birth for the foreign-born population - Albania (%)
Place of birth for the foreign-born population - Belarus (%)
Place of birth for the foreign-born population - Bosnia and Herzegovina (%)
Place of birth for the foreign-born population - Bulgaria (%)
Place of birth for the foreign-born population - Croatia (%)
Place of birth for the foreign-born population - Czechoslovakia (%)
Place of birth for the foreign-born population - Hungary (%)
Place of birth for the foreign-born population - Latvia (%)
Place of birth for the foreign-born population - Lithuania (%)
Place of birth for the foreign-born population - North Macedonia (Macedonia) (%)
Place of birth for the foreign-born population - Moldova (%)
Place of birth for the foreign-born population - Poland (%)
Place of birth for the foreign-born population - Romania (%)
Place of birth for the foreign-born population - Russia (%)
Place of birth for the foreign-born population - Serbia (%)
Place of birth for the foreign-born population - Ukraine (%)
Place of birth for the foreign-born population - Other Eastern Europe (%)
Place of birth for the foreign-born population - China (%)
Place of birth for the foreign-born population - Hong Kong (%)
Place of birth for the foreign-born population - Taiwan (%)
Place of birth for the foreign-born population - Japan (%)
Place of birth for the foreign-born population - Korea (%)
Place of birth for the foreign-born population - Other Eastern Asia (%)
Place of birth for the foreign-born population - Afghanistan (%)
Place of birth for the foreign-born population - Bangladesh (%)
Place of birth for the foreign-born population - India (%)
Place of birth for the foreign-born population - Iran (%)
Place of birth for the foreign-born population - Kazakhstan (%)
Place of birth for the foreign-born population - Nepal (%)
Place of birth for the foreign-born population - Pakistan (%)
Place of birth for the foreign-born population - Sri Lanka (%)
Place of birth for the foreign-born population - Uzbekistan (%)
Place of birth for the foreign-born population - Other South Central Asia (%)
Place of birth for the foreign-born population - Burma (%)
Place of birth for the foreign-born population - Cambodia (%)
Place of birth for the foreign-born population - Indonesia (%)
Place of birth for the foreign-born population - Laos (%)
Place of birth for the foreign-born population - Malaysia (%)
Place of birth for the foreign-born population - Philippines (%)
Place of birth for the foreign-born population - Singapore (%)
Place of birth for the foreign-born population - Thailand (%)
Place of birth for the foreign-born population - Vietnam (%)
Place of birth for the foreign-born population - Other South Eastern Asia (%)
Place of birth for the foreign-born population - Armenia (%)
Place of birth for the foreign-born population - Iraq (%)
Place of birth for the foreign-born population - Israel (%)
Place of birth for the foreign-born population - Jordan (%)
Place of birth for the foreign-born population - Kuwait (%)
Place of birth for the foreign-born population - Lebanon (%)
Place of birth for the foreign-born population - Saudi Arabia (%)
Place of birth for the foreign-born population - Syria (%)
Place of birth for the foreign-born population - Turkey (%)
Place of birth for the foreign-born population - Yemen (%)
Place of birth for the foreign-born population - Other Western Asia (%)
Place of birth for the foreign-born population - Eritrea (%)
Place of birth for the foreign-born population - Ethiopia (%)
Place of birth for the foreign-born population - Kenya (%)
Place of birth for the foreign-born population - Somalia (%)
Place of birth for the foreign-born population - Uganda (%)
Place of birth for the foreign-born population - Zimbabwe (%)
Place of birth for the foreign-born population - Other Eastern Africa (%)
Place of birth for the foreign-born population - Cameroon (%)
Place of birth for the foreign-born population - Congo (%)
Place of birth for the foreign-born population - Democratic Republic of Congo (Zaire) (%)
Place of birth for the foreign-born population - Other Middle Africa (%)
Place of birth for the foreign-born population - Egypt (%)
Place of birth for the foreign-born population - Morocco (%)
Place of birth for the foreign-born population - Sudan (%)
Place of birth for the foreign-born population - Other Northern Africa (%)
Place of birth for the foreign-born population - South Africa (%)
Place of birth for the foreign-born population - Other Southern Africa (%)
Place of birth for the foreign-born population - Cabo Verde (%)
Place of birth for the foreign-born population - Ghana (%)
Place of birth for the foreign-born population - Liberia (%)
Place of birth for the foreign-born population - Nigeria (%)
Place of birth for the foreign-born population - Senegal (%)
Place of birth for the foreign-born population - Sierra Leone (%)
Place of birth for the foreign-born population - Other Western Africa (%)
Place of birth for the foreign-born population - Australia (%)
Place of birth for the foreign-born population - New Zealand (%)
Place of birth for the foreign-born population - Fiji (%)
Place of birth for the foreign-born population - Micronesia (%)
Place of birth for the foreign-born population - Bahamas (%)
Place of birth for the foreign-born population - Barbados (%)
Place of birth for the foreign-born population - Cuba (%)
Place of birth for the foreign-born population - Dominica (%)
Place of birth for the foreign-born population - Dominican Republic (%)
Place of birth for the foreign-born population - Grenada (%)
Place of birth for the foreign-born population - Haiti (%)
Place of birth for the foreign-born population - Jamaica (%)
Place of birth for the foreign-born population - St. Vincent and the Grenadines (%)
Place of birth for the foreign-born population - Trinidad and Tobago (%)
Place of birth for the foreign-born population - West Indies (%)
Place of birth for the foreign-born population - Other Caribbean (%)
Place of birth for the foreign-born population - Belize (%)
Place of birth for the foreign-born population - Costa Rica (%)
Place of birth for the foreign-born population - El Salvador (%)
Place of birth for the foreign-born population - Guatemala (%)
Place of birth for the foreign-born population - Honduras (%)
Place of birth for the foreign-born population - Mexico (%)
Place of birth for the foreign-born population - Nicaragua (%)
Place of birth for the foreign-born population - Panama (%)
Place of birth for the foreign-born population - Other Central America (%)
Place of birth for the foreign-born population - Argentina (%)
Place of birth for the foreign-born population - Bolivia (%)
Place of birth for the foreign-born population - Brazil (%)
Place of birth for the foreign-born population - Chile (%)
Place of birth for the foreign-born population - Colombia (%)
Place of birth for the foreign-born population - Ecuador (%)
Place of birth for the foreign-born population - Guyana (%)
Place of birth for the foreign-born population - Peru (%)
Place of birth for the foreign-born population - Uruguay (%)
Place of birth for the foreign-born population - Venezuela (%)
Place of birth for the foreign-born population - Other South America (%)
Place of birth for the foreign-born population - Canada (%)
Place of birth for the foreign-born population - Other Northern America (%)
Place of birth for the foreign-born population - Other (%)
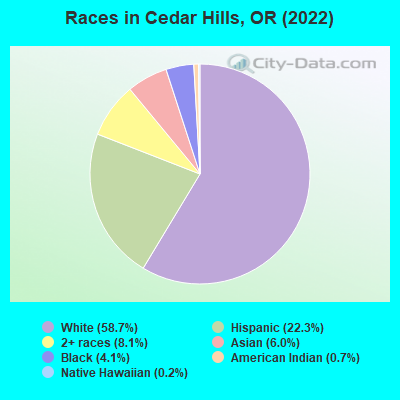
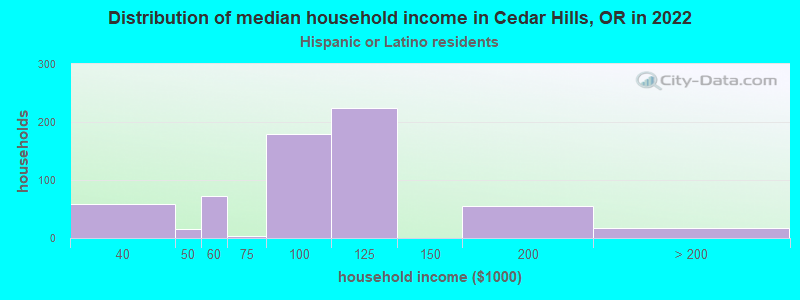
According to 2022 data, the most numerous races in Cedar Hills, OR are White alone (5,333 residents), Hispanic (2,023 residents), and Two or more races (738 residents). 73.9% of Cedar Hills residents speak English at home. 18.3% of Cedar Hills, OR residents are foreign-born (7.7% born in Latin America, 4.4% born in Europe, 3.9% born in Asia), which is 50.8% greater than the foreign-born rate of 9.0% across the entire state of Oregon.
Race distribution in Cedar Hills
2000 2022
2,857,616 83.5% White alone 275,314 8.0% Hispanic 100,333 2.9% Asian alone 82,733 2.4% Two or more races 53,325 1.6% Black alone 40,130 1.2% American Indian alone 7,398 0.2% Native Hawaiian and Other 4,550 0.1% Other race alone
3,037,571 71.6% White alone 609,538 14.4% Hispanic 252,744 6.0% Two or more races 191,283 4.5% Asian alone 78,228 1.8% Black alone 29,399 0.7% American Indian alone 25,731 0.6% Other race alone 15,643 0.4% Native Hawaiian and Other
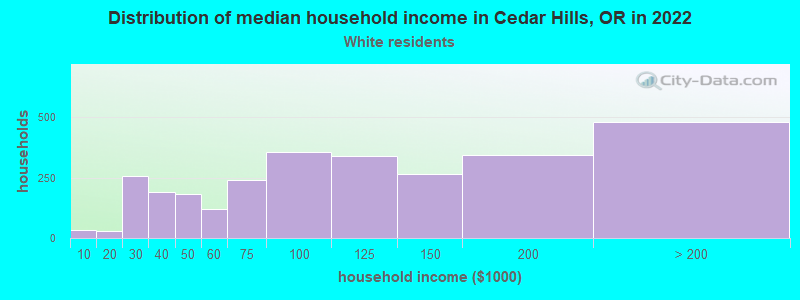
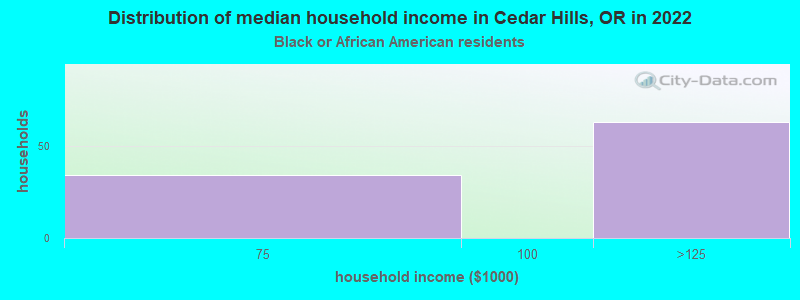
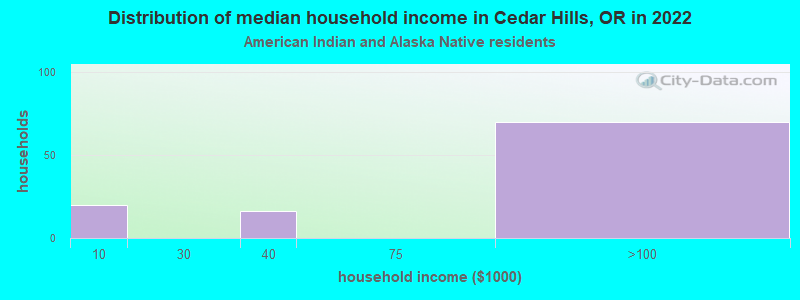
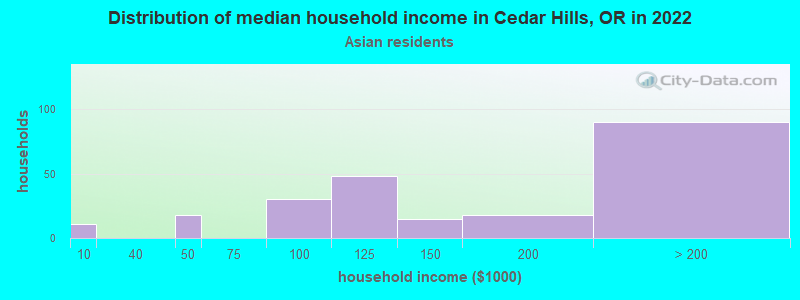
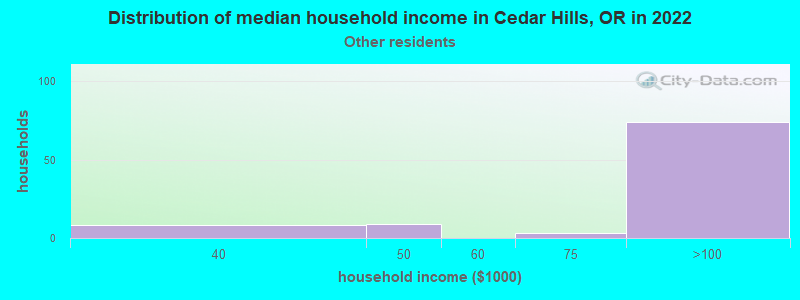
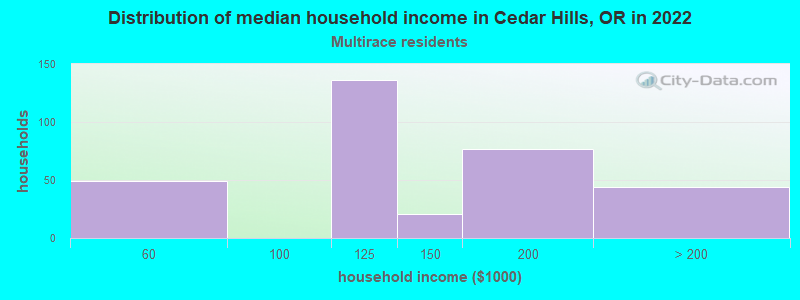
Income and house value in Cedar Hills Median household income in 2022 $101,551 White non-Hispanic householders$89,102 American Indian and Alaska Native householders$126,072 Asian householders$77,396 Some other race householders$97,756 Two or more races householders$87,225 Hispanic or Latino race householdersMedian 2022 house value $667,094 White Non-Hispanic householders$893,430 Black or African American householders$668,285 American Indian or Alaska Native householders $636,519 Asian householders$589,266 Native Hawaiian and other Pacific Islander householders$631,754 Some other race householders$701,243 Two or more races householders$636,122 Hispanic or Latino householders
Median age by race in Cedar Hills
45.9 Median age for White residents45.9 44.2 33.1 Median age for Black or African American residents33.9 28.2 31.7 Median age for American Indian / Alaska Native residents61.4 27.7 43.9 Median age for Asian residents46.5 39.7 -642,169,728.1 Median age for Native Hawaiian / Pacific Islander residents-476,923,076.4 -850,649,349.8 30.3 Median age for Other race residents42.7 29.4 29.6 Median age for Two or more races residents32.8 28.9 46.8 Median age for White alone residents45.6 48.9 29.3 Median age for Hispanic or Latino residents42.9 20.2
Owner/renter occupied households by race in Cedar Hills
House owners and renters - White residents 1,858 66.0% Owner occupied958 34.0% Renter occupiedHouse owners and renters - Black or African American residents 92 100.0% Renter occupiedHouse owners and renters - American Indian / Alaska Native residents 117 100.0% Renter occupiedHouse owners and renters - Asian residents 163 67.5% Owner occupied78 32.5% Renter occupiedHouse owners and renters - Other race residents 149 100.0% Renter occupiedHouse owners and renters - Two or more races residents 178 46.1% Owner occupied208 53.9% Renter occupiedHouse owners and renters - White alone residents 1,855 70.9% Owner occupied763 29.1% Renter occupiedHouse owners and renters - Hispanic or Latino residents 68 10.4% Owner occupied585 89.6% Renter occupied
Language usage in Cedar Hills
English speakers - Total 73.9% of residents of Cedar Hills speak English at home.
16.5% of residents speak Spanish at home 749 53.3% Speak English very well655 46.7% Speak English less than very well9.4% of residents speak other language at home 534 66.9% Speak English very well264 33.1% Speak English less than very well
English speakers - Born in the United States 80.0% of residents of Cedar Hills speak English at home.
19.0% of residents speak Spanish at home 637 79.8% Speak English very well161 20.2% Speak English less than very well3.1% of residents speak other language at home 98 75.4% Speak English very well32 24.6% Speak English less than very well
English speakers - Native, born elsewhere 90.3% of residents of Cedar Hills speak English at home.
English speakers - Foreign-born 23.4% of residents of Cedar Hills speak English at home.
37.7% of residents speak Spanish at home 91 15.4% Speak English very well498 84.6% Speak English less than very well35.6% of residents speak other language at home 321 57.7% Speak English very well235 42.3% Speak English less than very well
White (Caucasian) - Speak only English Native:
88.7% (4,585)Foreign-born:
28.0% (165)
White (Caucasian) - Speak another language Native:
10.7% (553)Foreign-born:
72.1% (424)
Black or African American - Speak only English Native:
57.8% (125)Foreign-born:
31.1% (49)
Black or African American - Speak another language Native:
55.4% (120)Foreign-born:
68.4% (107)
American Indian / Alaska Native - Speak another language Native:
16.6% (26)Foreign-born:
100.0% (39)
Asian - Speak only English Native:
85.7% (248)Foreign-born:
27.6% (73)
Asian - Speak another language Native:
8.9% (26)Foreign-born:
68.9% (181)
Other race - Speak only English Native:
32.7% (28)Foreign-born:
1.7% (2)
Other race - Speak another language Native:
67.3% (58)Foreign-born:
99.0% (146)
Two or more races - Speak only English Native:
83.1% (768)Foreign-born:
49.4% (97)
Two or more races - Speak another language Native:
16.4% (152)Foreign-born:
49.4% (97)
White alone - Speak only English Native:
96.1% (4,610)Foreign-born:
46.5% (183)
White alone - Speak another language Native:
4.0% (190)Foreign-born:
53.7% (211)
Hispanic or Latino - Speak only English Native:
35.8% (361)Foreign-born:
6.9% (48)
Hispanic or Latino - Speak another language Native:
65.5% (660)Foreign-born:
92.8% (643)
Foreign-born residents in Cedar Hills 1,663 residents are foreign born (7.7% Latin America , 4.4% Europe , 3.9% Asia ).
This city:
18.3%Oregon:
9.8%
Marital status for residents in Cedar Hills Marital status - White (Caucasian) population 15 years and over
Males 29.7% Never married58.0% Now married0.0% Separated4.0% Widowed8.3% DivorcedFemales 22.6% Never married53.2% Now married0.0% Separated2.2% Widowed21.9% DivorcedWomen who gave birth in the past 12 months Now married:
100.0% (25)Unmarried:
0.0% (0)
Women who did not give birth in the past 12 months Now married:
50.9% (633)Unmarried:
49.1% (611)
Marital status - Black or African American population 15 years and over
Males 47.6% Never married52.4% Now married0.0% Separated0.0% Widowed0.0% DivorcedFemales 73.3% Never married19.8% Now married0.0% Separated0.0% Widowed6.9% DivorcedWomen who gave birth in the past 12 months Now married:
100.0% (25)Unmarried:
0.0% (0)
Women who did not give birth in the past 12 months Now married:
0.0% (0)Unmarried:
100.0% (99)
Marital status - American Indian / Alaska Native population 15 years and over
Males 11.8% Never married68.4% Now married0.0% Separated0.0% Widowed19.7% DivorcedFemales 81.0% Never married9.8% Now married0.0% Separated0.0% Widowed9.2% DivorcedWomen who did not give birth in the past 12 months Now married:
9.8% (16)Unmarried:
90.2% (151)
Marital status - Asian population 15 years and over
Males 40.3% Never married52.4% Now married0.0% Separated0.0% Widowed7.3% DivorcedFemales 25.2% Never married71.9% Now married0.0% Separated2.5% Widowed0.4% DivorcedWomen who did not give birth in the past 12 months Now married:
66.8% (150)Unmarried:
33.2% (75)
Marital status - Other race population 15 years and over
Males 67.2% Never married32.8% Now married0.0% Separated0.0% Widowed0.0% DivorcedFemales 10.5% Never married89.5% Now married0.0% Separated0.0% Widowed0.0% DivorcedWomen who did not give birth in the past 12 months Now married:
88.9% (120)Unmarried:
11.1% (15)
Marital status - Two or more races population 15 years and over
Males 46.4% Never married35.3% Now married18.3% Separated0.0% Widowed0.0% DivorcedFemales 44.4% Never married42.3% Now married0.0% Separated9.4% Widowed3.9% DivorcedWomen who gave birth in the past 12 months Now married:
100.0% (65)Unmarried:
0.0% (0)
Women who did not give birth in the past 12 months Now married:
30.3% (98)Unmarried:
69.7% (225)
Marital status - White alone, not Hispanic / Latino population 15 years and over
Males 30.6% Never married55.9% Now married0.0% Separated4.4% Widowed9.1% DivorcedFemales 19.7% Never married55.3% Now married0.0% Separated2.6% Widowed22.3% DivorcedWomen who gave birth in the past 12 months Now married:
100.0% (27)Unmarried:
0.0% (0)
Women who did not give birth in the past 12 months Now married:
52.8% (525)Unmarried:
47.2% (469)
Marital status - Hispanic or Latino population 15 years and over
Males 40.0% Never married60.0% Now married0.0% Separated0.0% Widowed0.0% DivorcedFemales 49.0% Never married41.4% Now married0.0% Separated0.0% Widowed9.6% DivorcedWomen who gave birth in the past 12 months Now married:
100.0% (9)Unmarried:
0.0% (0)
Women who did not give birth in the past 12 months Now married:
42.3% (311)Unmarried:
57.7% (425)
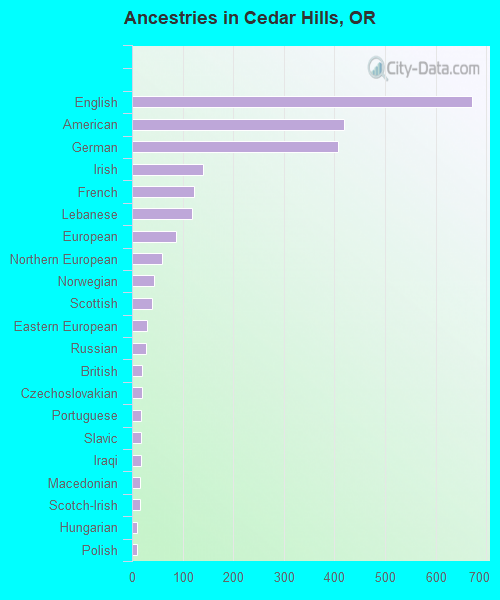
Ancestries in Cedar Hills
672 16.6% English419 10.3% American408 10.1% German141 3.5% Irish122 3.0% French119 2.9% Lebanese87 2.1% European60 1.5% Northern European44 1.1% Norwegian40 1.0% Scottish30 0.7% Eastern European27 0.7% Russian20 0.5% British20 0.5% Czechoslovakian18 0.4% Portuguese18 0.4% Slavic17 0.4% Iraqi16 0.4% Macedonian15 0.4% Scotch-Irish10 0.2% Hungarian10 0.2% Polish5 0.1% Romanian3 0.07% Iranian
Children Nativity (place of birth) in Cedar Hills
Children under 6 years - Living with two parents Both parents native 391 100.0% NativeBoth parents foreign-born 88 100.0% NativeOne native, one foreign-born parent 80 100.0% NativeChildren under 6 years - Living with one parent Native parent 23 100.0% NativeForeign-born parent 4 3.3% Native114 96.7% Foreign-bornChildren 6 to 17 years - Living with two parents Both parents native 682 99.8% Native1 0.2% Foreign-bornBoth parents foreign-born 474 88.7% Native60 11.3% Foreign-bornOne native, one foreign-born parent 55 100.0% NativeChildren 6 to 17 years - Living with one parent Native parent 99 100.0% NativeForeign-born parent 21 58.2% Native15 41.8% Foreign-born
Grandparents responsible for own grandchildren in Cedar Hills
Grandparents (30 to 59 years) Two or more races 13 100.0% Not responsible for grandchildren
Grandparents (60 years and over)