Races in Central Coast, California (CA) Detailed Stats
Ancestries, Foreign-born residents, place of birth
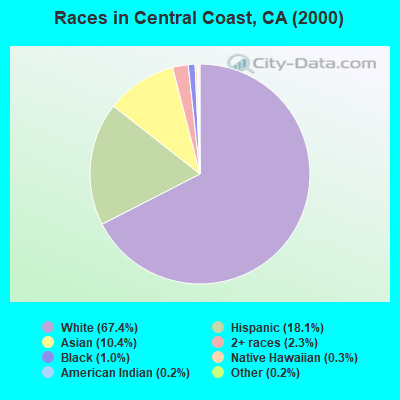
Race distribution in Central Coast

- 155,18267.4%White alone
- 41,57718.1%Hispanic
- 24,03010.4%Asian alone
- 5,3652.3%Two or more races
- 2,3281.0%Black alone
- 7570.3%Native Hawaiian and Other
Pacific Islander alone - 4720.2%Other race alone
- 5390.2%American Indian alone
2000
2022
-
- 15,816,79046.7%White alone
- 10,966,55632.4%Hispanic
- 3,648,86010.8%Asian alone
- 2,181,9266.4%Black alone
- 903,1152.7%Two or more races
- 178,9840.5%American Indian alone
- 103,7360.3%Native Hawaiian and Other
Pacific Islander alone - 71,6810.2%Other race alone

-
- 15,732,18440.3%Hispanic
- 13,160,42633.7%White alone
- 5,957,86715.3%Asian alone
- 2,025,2185.2%Black alone
- 1,663,2224.3%Two or more races
- 251,6180.6%Other race alone
- 135,7770.3%Native Hawaiian and Other
Pacific Islander alone - 103,0300.3%American Indian alone

Income and house value in Central Coast
- Median household income in 2022
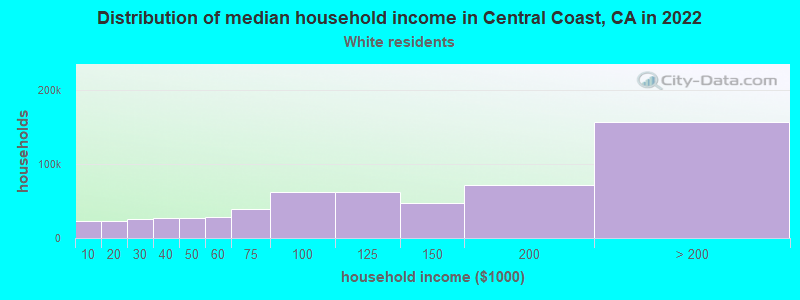
- $132,154White non-Hispanic householders
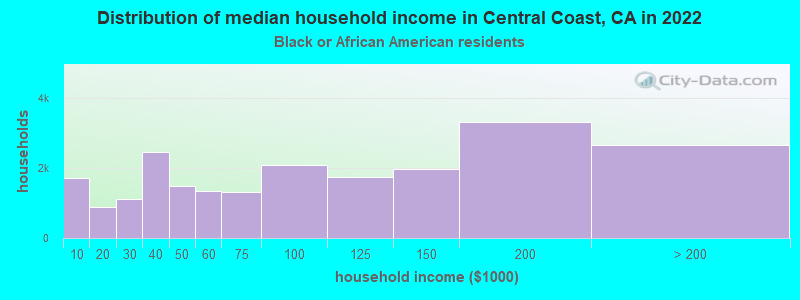
- $106,142Black householders
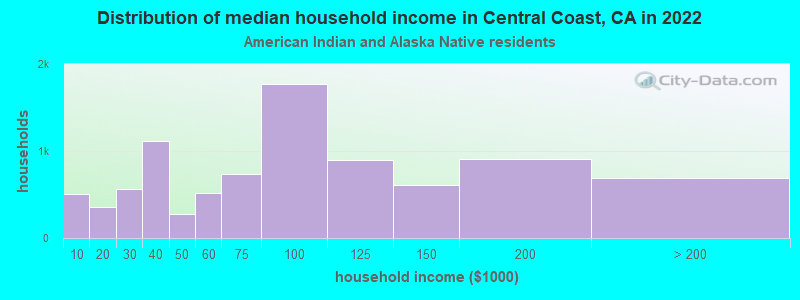
- $104,038American Indian and Alaska Native householders
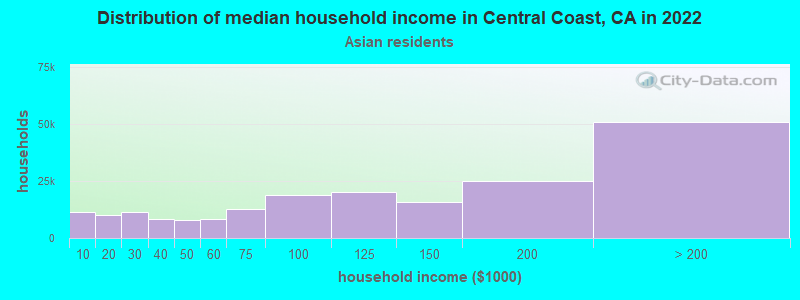
- $106,703Asian householders
- $101,751Native Hawaiian and other Pacific Islander householders
- $80,993Some other race householders
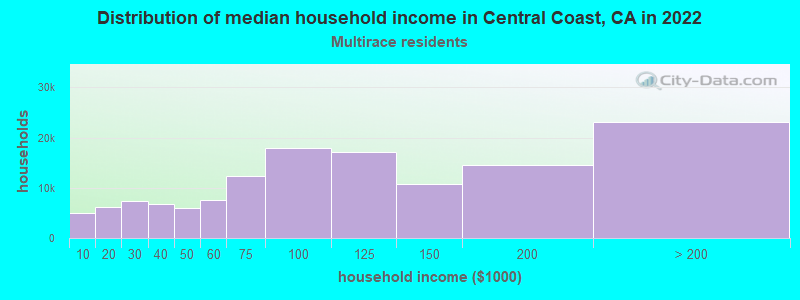
- $92,564Two or more races householders
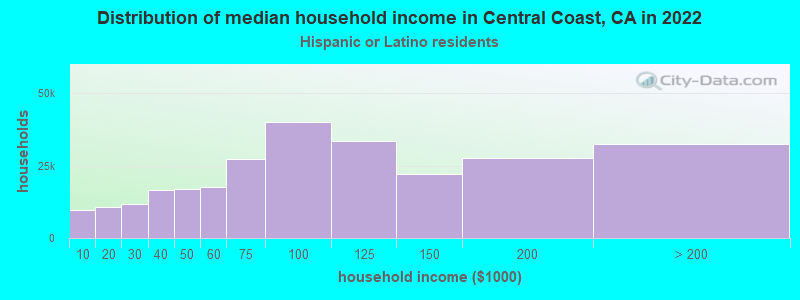
- $89,521Hispanic or Latino race householders
- Median 2022 house value
- over $1,000,000White Non-Hispanic householders
- over $1,000,000Black or African American householders
- over $1,000,000American Indian or Alaska Native householders
- over $1,000,000Asian householders
- $835,396Native Hawaiian and other Pacific Islander householders
- $822,799Some other race householders
- over $1,000,000Two or more races householders
- $972,889Hispanic or Latino householders
Household income for White non-Hispanic householders
Household income for Black householders
Household income for American Indian and Alaska Native householders
Household income for Asian householders
Household income for Native Hawaiian and other Pacific Islander householders

Household income for Two or more races householders
Household income for Hispanic or Latino race householders
Zip code: 92627