Races in Chalmette, Louisiana (LA) Detailed Stats
Data:
Races - White alone (%)
Races - White alone (% change since 2000)
Races - Black alone (%)
Races - Black alone (% change since 2000)
Races - American Indian alone (%)
Races - American Indian alone (% change since 2000)
Races - Asian alone (%)
Races - Asian alone (% change since 2000)
Races - Hispanic (%)
Races - Hispanic (% change since 2000)
Races - Native Hawaiian and Other Pacific Islander alone (%)
Races - Native Hawaiian and Other Pacific Islander alone (% change since 2000)
Races - Two or more races(%)
Races - Two or more races(% change since 2000)
Races - Other race alone (%)
Races - Other race alone (% change since 2000)
Racial diversity
Place of birth - Born in state of residence (%)
Place of birth - Born in state of residence (%) - White
Place of birth - Born in state of residence (%) - Black or African American
Place of birth - Born in state of residence (%) - Asian
Place of birth - Born in state of residence (%) - Hispanic or Latino
Place of birth - Born in state of residence (%) - American Indian and Alaska Native
Place of birth - Born in state of residence (%) - Multirace
Place of birth - Born in state of residence (%) - Other Race
Place of birth - Born in other state (%)
Place of birth - Born in other state (%) - White
Place of birth - Born in other state (%) - Black or African American
Place of birth - Born in other state (%) - Asian
Place of birth - Born in other state (%) - Hispanic or Latino
Place of birth - Born in other state (%) - American Indian and Alaska Native
Place of birth - Born in other state (%) - Multirace
Place of birth - Born in other state (%) - Other Race
Place of birth - Native, outside of US (%)
Place of birth - Native, outside of US (%) - White
Place of birth - Native, outside of US (%) - Black or African American
Place of birth - Native, outside of US (%) - Asian
Place of birth - Native, outside of US (%) - Hispanic or Latino
Place of birth - Native, outside of US (%) - American Indian and Alaska Native
Place of birth - Native, outside of US (%) - Multirace
Place of birth - Native, outside of US (%) - Other Race
Place of birth - Foreign born (%)
Place of birth - Foreign born (%) - White
Place of birth - Foreign born (%) - Black or African American
Place of birth - Foreign born (%) - Asian
Place of birth - Foreign born (%) - Hispanic or Latino
Place of birth - Foreign born (%) - American Indian and Alaska Native
Place of birth - Foreign born (%) - Multirace
Place of birth - Foreign born (%) - Other Race
Residents speaking English at home (%)
Residents speaking English at home - Born in the United States (%)
Residents speaking English at home - Native, born elsewhere (%)
Residents speaking English at home - Foreign born (%)
Residents speaking Spanish at home (%)
Residents speaking Spanish at home - Born in the United States (%)
Residents speaking Spanish at home - Native, born elsewhere (%)
Residents speaking Spanish at home - Foreign born (%)
Residents speaking other language at home (%)
Residents speaking other language at home - Born in the United States (%)
Residents speaking other language at home - Native, born elsewhere (%)
Residents speaking other language at home - Foreign born (%)
Marital status - Never married (%)
Marital status - Now married (%)
Marital status - Separated (%)
Marital status - Widowed (%)
Marital status - Divorced (%)
Ancestries Reported - Arab (%)
Ancestries Reported - Czech (%)
Ancestries Reported - Danish (%)
Ancestries Reported - Dutch (%)
Ancestries Reported - English (%)
Ancestries Reported - French (%)
Ancestries Reported - French Canadian (%)
Ancestries Reported - German (%)
Ancestries Reported - Greek (%)
Ancestries Reported - Hungarian (%)
Ancestries Reported - Irish (%)
Ancestries Reported - Italian (%)
Ancestries Reported - Lithuanian (%)
Ancestries Reported - Norwegian (%)
Ancestries Reported - Polish (%)
Ancestries Reported - Portuguese (%)
Ancestries Reported - Russian (%)
Ancestries Reported - Scotch-Irish (%)
Ancestries Reported - Scottish (%)
Ancestries Reported - Slovak (%)
Ancestries Reported - Subsaharan African (%)
Ancestries Reported - Swedish (%)
Ancestries Reported - Swiss (%)
Ancestries Reported - Ukrainian (%)
Ancestries Reported - United States (%)
Ancestries Reported - Welsh (%)
Ancestries Reported - West Indian (%)
Ancestries Reported - Other (%)
Geographical mobility - Same house 1 year ago (%)
Geographical mobility - Same house 1 year ago (%) - White
Geographical mobility - Same house 1 year ago (%) - Black or African American
Geographical mobility - Same house 1 year ago (%) - Asian
Geographical mobility - Same house 1 year ago (%) - Hispanic or Latino
Geographical mobility - Same house 1 year ago (%) - American Indian and Alaska Native
Geographical mobility - Same house 1 year ago (%) - Multirace
Geographical mobility - Same house 1 year ago (%) - Other Race
Geographical mobility - Moved within same county (%)
Geographical mobility - Moved within same county (%) - White
Geographical mobility - Moved within same county (%) - Black or African American
Geographical mobility - Moved within same county (%) - Asian
Geographical mobility - Moved within same county (%) - Hispanic or Latino
Geographical mobility - Moved within same county (%) - American Indian and Alaska Native
Geographical mobility - Moved within same county (%) - Multirace
Geographical mobility - Moved within same county (%) - Other Race
Geographical mobility - Moved from different county within same state (%)
Geographical mobility - Moved from different county within same state (%) - White
Geographical mobility - Moved from different county within same state (%) - Black or African American
Geographical mobility - Moved from different county within same state (%) - Asian
Geographical mobility - Moved from different county within same state (%) - Hispanic or Latino
Geographical mobility - Moved from different county within same state (%) - American Indian and Alaska Native
Geographical mobility - Moved from different county within same state (%) - Multirace
Geographical mobility - Moved from different county within same state (%) - Other Race
Geographical mobility - Moved from different state (%)
Geographical mobility - Moved from different state (%) - White
Geographical mobility - Moved from different state (%) - Black or African American
Geographical mobility - Moved from different state (%) - Asian
Geographical mobility - Moved from different state (%) - Hispanic or Latino
Geographical mobility - Moved from different state (%) - American Indian and Alaska Native
Geographical mobility - Moved from different state (%) - Multirace
Geographical mobility - Moved from different state (%) - Other Race
Geographical mobility - Moved from abroad (%)
Geographical mobility - Moved from abroad (%) - White
Geographical mobility - Moved from abroad (%) - Black or African American
Geographical mobility - Moved from abroad (%) - Asian
Geographical mobility - Moved from abroad (%) - Hispanic or Latino
Geographical mobility - Moved from abroad (%) - American Indian and Alaska Native
Geographical mobility - Moved from abroad (%) - Multirace
Geographical mobility - Moved from abroad (%) - Other Race
Place of birth for the foreign-born population - Ireland (%)
Place of birth for the foreign-born population - Denmark (%)
Place of birth for the foreign-born population - Norway (%)
Place of birth for the foreign-born population - Sweden (%)
Place of birth for the foreign-born population - United Kingdom (%)
Place of birth for the foreign-born population - England (%)
Place of birth for the foreign-born population - Scotland (%)
Place of birth for the foreign-born population - Other Northern Europe (%)
Place of birth for the foreign-born population - Austria (%)
Place of birth for the foreign-born population - Belgium (%)
Place of birth for the foreign-born population - France (%)
Place of birth for the foreign-born population - Germany (%)
Place of birth for the foreign-born population - Netherlands (%)
Place of birth for the foreign-born population - Switzerland (%)
Place of birth for the foreign-born population - Other Western Europe (%)
Place of birth for the foreign-born population - Greece (%)
Place of birth for the foreign-born population - Italy (%)
Place of birth for the foreign-born population - Portugal (%)
Place of birth for the foreign-born population - Spain (%)
Place of birth for the foreign-born population - Other Southern Europe (%)
Place of birth for the foreign-born population - Albania (%)
Place of birth for the foreign-born population - Belarus (%)
Place of birth for the foreign-born population - Bosnia and Herzegovina (%)
Place of birth for the foreign-born population - Bulgaria (%)
Place of birth for the foreign-born population - Croatia (%)
Place of birth for the foreign-born population - Czechoslovakia (%)
Place of birth for the foreign-born population - Hungary (%)
Place of birth for the foreign-born population - Latvia (%)
Place of birth for the foreign-born population - Lithuania (%)
Place of birth for the foreign-born population - North Macedonia (Macedonia) (%)
Place of birth for the foreign-born population - Moldova (%)
Place of birth for the foreign-born population - Poland (%)
Place of birth for the foreign-born population - Romania (%)
Place of birth for the foreign-born population - Russia (%)
Place of birth for the foreign-born population - Serbia (%)
Place of birth for the foreign-born population - Ukraine (%)
Place of birth for the foreign-born population - Other Eastern Europe (%)
Place of birth for the foreign-born population - China (%)
Place of birth for the foreign-born population - Hong Kong (%)
Place of birth for the foreign-born population - Taiwan (%)
Place of birth for the foreign-born population - Japan (%)
Place of birth for the foreign-born population - Korea (%)
Place of birth for the foreign-born population - Other Eastern Asia (%)
Place of birth for the foreign-born population - Afghanistan (%)
Place of birth for the foreign-born population - Bangladesh (%)
Place of birth for the foreign-born population - India (%)
Place of birth for the foreign-born population - Iran (%)
Place of birth for the foreign-born population - Kazakhstan (%)
Place of birth for the foreign-born population - Nepal (%)
Place of birth for the foreign-born population - Pakistan (%)
Place of birth for the foreign-born population - Sri Lanka (%)
Place of birth for the foreign-born population - Uzbekistan (%)
Place of birth for the foreign-born population - Other South Central Asia (%)
Place of birth for the foreign-born population - Burma (%)
Place of birth for the foreign-born population - Cambodia (%)
Place of birth for the foreign-born population - Indonesia (%)
Place of birth for the foreign-born population - Laos (%)
Place of birth for the foreign-born population - Malaysia (%)
Place of birth for the foreign-born population - Philippines (%)
Place of birth for the foreign-born population - Singapore (%)
Place of birth for the foreign-born population - Thailand (%)
Place of birth for the foreign-born population - Vietnam (%)
Place of birth for the foreign-born population - Other South Eastern Asia (%)
Place of birth for the foreign-born population - Armenia (%)
Place of birth for the foreign-born population - Iraq (%)
Place of birth for the foreign-born population - Israel (%)
Place of birth for the foreign-born population - Jordan (%)
Place of birth for the foreign-born population - Kuwait (%)
Place of birth for the foreign-born population - Lebanon (%)
Place of birth for the foreign-born population - Saudi Arabia (%)
Place of birth for the foreign-born population - Syria (%)
Place of birth for the foreign-born population - Turkey (%)
Place of birth for the foreign-born population - Yemen (%)
Place of birth for the foreign-born population - Other Western Asia (%)
Place of birth for the foreign-born population - Eritrea (%)
Place of birth for the foreign-born population - Ethiopia (%)
Place of birth for the foreign-born population - Kenya (%)
Place of birth for the foreign-born population - Somalia (%)
Place of birth for the foreign-born population - Uganda (%)
Place of birth for the foreign-born population - Zimbabwe (%)
Place of birth for the foreign-born population - Other Eastern Africa (%)
Place of birth for the foreign-born population - Cameroon (%)
Place of birth for the foreign-born population - Congo (%)
Place of birth for the foreign-born population - Democratic Republic of Congo (Zaire) (%)
Place of birth for the foreign-born population - Other Middle Africa (%)
Place of birth for the foreign-born population - Egypt (%)
Place of birth for the foreign-born population - Morocco (%)
Place of birth for the foreign-born population - Sudan (%)
Place of birth for the foreign-born population - Other Northern Africa (%)
Place of birth for the foreign-born population - South Africa (%)
Place of birth for the foreign-born population - Other Southern Africa (%)
Place of birth for the foreign-born population - Cabo Verde (%)
Place of birth for the foreign-born population - Ghana (%)
Place of birth for the foreign-born population - Liberia (%)
Place of birth for the foreign-born population - Nigeria (%)
Place of birth for the foreign-born population - Senegal (%)
Place of birth for the foreign-born population - Sierra Leone (%)
Place of birth for the foreign-born population - Other Western Africa (%)
Place of birth for the foreign-born population - Australia (%)
Place of birth for the foreign-born population - New Zealand (%)
Place of birth for the foreign-born population - Fiji (%)
Place of birth for the foreign-born population - Micronesia (%)
Place of birth for the foreign-born population - Bahamas (%)
Place of birth for the foreign-born population - Barbados (%)
Place of birth for the foreign-born population - Cuba (%)
Place of birth for the foreign-born population - Dominica (%)
Place of birth for the foreign-born population - Dominican Republic (%)
Place of birth for the foreign-born population - Grenada (%)
Place of birth for the foreign-born population - Haiti (%)
Place of birth for the foreign-born population - Jamaica (%)
Place of birth for the foreign-born population - St. Vincent and the Grenadines (%)
Place of birth for the foreign-born population - Trinidad and Tobago (%)
Place of birth for the foreign-born population - West Indies (%)
Place of birth for the foreign-born population - Other Caribbean (%)
Place of birth for the foreign-born population - Belize (%)
Place of birth for the foreign-born population - Costa Rica (%)
Place of birth for the foreign-born population - El Salvador (%)
Place of birth for the foreign-born population - Guatemala (%)
Place of birth for the foreign-born population - Honduras (%)
Place of birth for the foreign-born population - Mexico (%)
Place of birth for the foreign-born population - Nicaragua (%)
Place of birth for the foreign-born population - Panama (%)
Place of birth for the foreign-born population - Other Central America (%)
Place of birth for the foreign-born population - Argentina (%)
Place of birth for the foreign-born population - Bolivia (%)
Place of birth for the foreign-born population - Brazil (%)
Place of birth for the foreign-born population - Chile (%)
Place of birth for the foreign-born population - Colombia (%)
Place of birth for the foreign-born population - Ecuador (%)
Place of birth for the foreign-born population - Guyana (%)
Place of birth for the foreign-born population - Peru (%)
Place of birth for the foreign-born population - Uruguay (%)
Place of birth for the foreign-born population - Venezuela (%)
Place of birth for the foreign-born population - Other South America (%)
Place of birth for the foreign-born population - Canada (%)
Place of birth for the foreign-born population - Other Northern America (%)
Place of birth for the foreign-born population - Other (%)
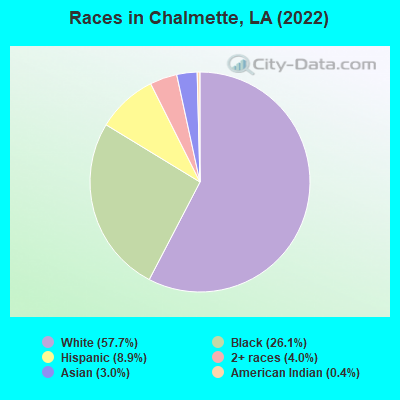
According to 2022 data, the most numerous races in Chalmette, LA are White alone (12,670 residents), Black alone (5,720 residents), and Hispanic (1,954 residents). 89.6% of Chalmette residents speak English at home. 5.3% of Chalmette, LA residents are foreign-born (3.3% born in Latin America, 1.6% born in Asia), which is 25.1% greater than the foreign-born rate of 4.0% across the entire state of Louisiana.
Race distribution in Chalmette
2000 2022
2,794,391 62.5% White alone 1,443,390 32.3% Black alone 107,738 2.4% Hispanic 54,256 1.2% Asian alone 39,260 0.9% Two or more races 24,129 0.5% American Indian alone 4,736 0.1% Other race alone 1,076 0.02% Native Hawaiian and Other
2,603,221 56.7% White alone 1,420,055 30.9% Black alone 262,213 5.7% Hispanic 183,270 4.0% Two or more races 81,169 1.8% Asian alone 19,991 0.4% American Indian alone 18,043 0.4% Other race alone 2,279 0.05% Native Hawaiian and Other
Income and house value in Chalmette Median household income in 2022 $65,233 White non-Hispanic householders$33,781 Black householders$69,871 Asian householders$33,403 Some other race householders$23,175 Two or more races householders$34,152 Hispanic or Latino race householdersMedian 2022 house value $205,698 White Non-Hispanic householders$218,583 Black or African American householders$101,238 American Indian or Alaska Native householders $236,530 Asian householders$265,521 Some other race householders$232,618 Two or more races householders$221,114 Hispanic or Latino householders
Median age by race in Chalmette
38.3 Median age for White residents37.9 38.8 29.6 Median age for Black or African American residents26.7 31.7 32.3 Median age for American Indian / Alaska Native residents-739,906,102.5 37.6 36.1 Median age for Asian residents35.4 38.7 -821,138,210.6 Median age for Native Hawaiian / Pacific Islander residents-868,167,201.7 -599,999,999.4 42.6 Median age for Other race residents40.1 45.8 24.6 Median age for Two or more races residents32.5 14.8 39.5 Median age for White alone residents39.4 39.5 26.1 Median age for Hispanic or Latino residents26.8 22.5
Owner/renter occupied households by race in Chalmette
House owners and renters - White residents 3,938 73.9% Owner occupied1,394 26.1% Renter occupiedHouse owners and renters - Black or African American residents 605 31.7% Owner occupied1,302 68.3% Renter occupiedHouse owners and renters - American Indian / Alaska Native residents 70 100.0% Renter occupiedHouse owners and renters - Asian residents 203 91.0% Owner occupied20 9.0% Renter occupiedHouse owners and renters - Other race residents 69 55.9% Owner occupied55 44.1% Renter occupiedHouse owners and renters - Two or more races residents 214 43.4% Owner occupied280 56.6% Renter occupiedHouse owners and renters - White alone residents 3,916 75.7% Owner occupied1,257 24.3% Renter occupiedHouse owners and renters - Hispanic or Latino residents 183 37.6% Owner occupied304 62.4% Renter occupied
Language usage in Chalmette
English speakers - Total 89.6% of residents of Chalmette speak English at home.
6.6% of residents speak Spanish at home 845 62.3% Speak English very well512 37.7% Speak English less than very well3.8% of residents speak other language at home 472 61.1% Speak English very well301 38.9% Speak English less than very well
English speakers - Born in the United States 88.8% of residents of Chalmette speak English at home.
8.2% of residents speak Spanish at home 239 100.0% Speak English very well3.3% of residents speak other language at home 73 75.3% Speak English very well24 24.7% Speak English less than very well
All residents speak only English at home
English speakers - Foreign-born 17.7% of residents of Chalmette speak English at home.
51.6% of residents speak Spanish at home 220 38.2% Speak English very well356 61.8% Speak English less than very well30.0% of residents speak other language at home 128 38.2% Speak English very well207 61.8% Speak English less than very well
White (Caucasian) - Speak only English Native:
94.6% (11,601)Foreign-born:
41.3% (136)
White (Caucasian) - Speak another language Native:
5.1% (629)Foreign-born:
61.4% (203)
Black or African American - Speak another language Native:
3.6% (197)Foreign-born:
100.0% (5)
Asian - Speak only English Native:
43.0% (146)Foreign-born:
6.9% (21)
Asian - Speak another language Native:
57.6% (196)Foreign-born:
94.0% (283)
Other race - Speak another language Native:
19.0% (18)Foreign-born:
100.0% (124)
Two or more races - Speak only English Native:
84.5% (1,062)Foreign-born:
12.2% (33)
Two or more races - Speak another language Native:
15.7% (198)Foreign-born:
85.8% (231)
White alone - Speak only English Native:
95.8% (11,399)Foreign-born:
58.6% (57)
White alone - Speak another language Native:
4.1% (488)Foreign-born:
41.6% (41)
Hispanic or Latino - Speak only English Native:
66.5% (689)Foreign-born:
18.8% (133)
Hispanic or Latino - Speak another language Native:
33.3% (345)Foreign-born:
81.3% (574)
Foreign-born residents in Chalmette 1,172 residents are foreign born (3.3% Latin America , 1.6% Asia ).
This city:
5.3%Louisiana:
4.2%
Marital status for residents in Chalmette Marital status - White (Caucasian) population 15 years and over
Males 38.0% Never married41.2% Now married2.2% Separated5.8% Widowed12.8% DivorcedFemales 29.8% Never married38.9% Now married3.6% Separated11.2% Widowed16.5% DivorcedWomen who gave birth in the past 12 months Now married:
67.5% (108)Unmarried:
32.5% (52)
Women who did not give birth in the past 12 months Now married:
40.1% (1,179)Unmarried:
59.9% (1,764)
Marital status - Black or African American population 15 years and over
Males 57.1% Never married30.5% Now married1.3% Separated0.4% Widowed10.7% DivorcedFemales 59.3% Never married22.4% Now married4.8% Separated2.3% Widowed11.2% DivorcedWomen who gave birth in the past 12 months Now married:
0.0% (0)Unmarried:
100.0% (12)
Women who did not give birth in the past 12 months Now married:
23.6% (452)Unmarried:
76.4% (1,464)
Marital status - American Indian / Alaska Native population 15 years and over
Males 86.7% Never married13.3% Now married0.0% Separated0.0% Widowed0.0% DivorcedFemales 100.0% Never married0.0% Now married0.0% Separated0.0% Widowed0.0% DivorcedWomen who did not give birth in the past 12 months Now married:
0.0% (0)Unmarried:
100.0% (33)
Marital status - Asian population 15 years and over
Males 42.1% Never married57.9% Now married0.0% Separated0.0% Widowed0.0% DivorcedFemales 20.1% Never married66.4% Now married0.0% Separated2.3% Widowed11.2% DivorcedWomen who gave birth in the past 12 months Now married:
0.0% (0)Unmarried:
100.0% (5)
Women who did not give birth in the past 12 months Now married:
63.8% (101)Unmarried:
36.2% (57)
Marital status - Other race population 15 years and over
Males 88.3% Never married11.7% Now married0.0% Separated0.0% Widowed0.0% DivorcedFemales 30.9% Never married25.7% Now married0.0% Separated27.2% Widowed16.2% DivorcedWomen who did not give birth in the past 12 months Now married:
45.5% (37)Unmarried:
54.5% (45)
Marital status - Two or more races population 15 years and over
Males 42.5% Never married46.3% Now married0.0% Separated0.0% Widowed11.2% DivorcedFemales 37.5% Never married28.0% Now married8.8% Separated13.6% Widowed12.1% DivorcedWomen who gave birth in the past 12 months Now married:
56.8% (29)Unmarried:
43.2% (22)
Women who did not give birth in the past 12 months Now married:
18.9% (42)Unmarried:
81.1% (180)
Marital status - White alone, not Hispanic / Latino population 15 years and over
Males 36.9% Never married41.3% Now married2.1% Separated6.2% Widowed13.6% DivorcedFemales 28.8% Never married39.7% Now married3.2% Separated11.1% Widowed17.2% DivorcedWomen who gave birth in the past 12 months Now married:
67.5% (110)Unmarried:
32.5% (53)
Women who did not give birth in the past 12 months Now married:
39.9% (1,092)Unmarried:
60.1% (1,643)
Marital status - Hispanic or Latino population 15 years and over
Males 52.2% Never married41.0% Now married1.9% Separated0.0% Widowed4.9% DivorcedFemales 38.4% Never married31.8% Now married8.1% Separated17.4% Widowed4.4% DivorcedWomen who gave birth in the past 12 months Now married:
100.0% (11)Unmarried:
0.0% (0)
Women who did not give birth in the past 12 months Now married:
42.2% (197)Unmarried:
57.8% (270)
Ancestries in Chalmette
1,175 11.6% Italian684 6.8% American424 4.2% German358 3.5% Irish335 3.3% French192 1.9% English152 1.5% Palestinian117 1.2% Cajun47 0.5% African37 0.4% Belizean35 0.3% French Canadian33 0.3% Scotch-Irish24 0.2% European24 0.2% Scottish13 0.1% Czech12 0.1% Russian11 0.1% Greek10 0.10% Austrian10 0.10% Hungarian10 0.10% Welsh8 0.08% Danish7 0.07% Dutch6 0.06% Egyptian5 0.05% British1 0.01% Polish
Geographical mobility in Chalmette Same house 1 year ago 12,519 94.5% White (Caucasian)5,277 91.5% Black or African American107 99.4% American Indian / Alaska Native601 93.9% Asian195 86.8% Other race1,553 89.3% Two or more races11,851 94.6% White alone, not Hispanic / Latino1,785 92.5% Hispanic or LatinoMoved within same county 382 2.9% White / Caucasian207 3.6% Black or African American178 10.2% Two or more races346 2.8% White alone, not Hispanic / Latino70 3.6% Hispanic or LatinoMoved within same state 302 2.3% White / Caucasian249 4.3% Black or African American27 4.2% Asian6 2.8% Other race275 2.2% White alone, not Hispanic / Latino50 2.6% Hispanic or LatinoMoved from different state 34 0.3% White / Caucasian71 1.2% Black or African American22 9.8% Other race1 0.1% Two or more races36 0.3% White alone, not Hispanic / Latino26 1.3% Hispanic or LatinoMoved from abroad 9 0.1% White11 0.1% White alone, not Hispanic / Latino
Children Nativity (place of birth) in Chalmette
Children under 6 years - Living with two parents Both parents native 641 100.0% NativeBoth parents foreign-born 132 100.0% NativeOne native, one foreign-born parent 20 100.0% NativeChildren under 6 years - Living with one parent Native parent 951 100.0% Native0 0.0% Foreign-bornForeign-born parent 24 64.3% Native13 35.7% Foreign-bornChildren 6 to 17 years - Living with two parents Both parents native 1,246 100.0% NativeBoth parents foreign-born 96 65.2% Native51 34.8% Foreign-bornOne native, one foreign-born parent 162 100.0% NativeChildren 6 to 17 years - Living with one parent Native parent 1,828 100.0% NativeForeign-born parent 185 57.1% Native139 42.9% Foreign-born
Grandparents responsible for own grandchildren in Chalmette
Grandparents (30 to 59 years) White / Caucasian 39 50.9% Responsible for grandchildren38 49.1% Not responsible for grandchildrenBlack or African American 62 48.6% Responsible for grandchildren66 51.4% Not responsible for grandchildrenAsian 11 58.7% Responsible for grandchildren8 41.3% Not responsible for grandchildrenTwo or more races 30 78.6% Responsible for grandchildren8 21.4% Not responsible for grandchildrenWhite alone, not Hispanic / Latino 40 50.2% Responsible for grandchildren40 49.8% Not responsible for grandchildrenHispanic or Latino 4 100.0% Not responsible for grandchildrenGrandparents (60 years and over) White / Caucasian 47 22.8% Responsible for grandchildren160 77.2% Not responsible for grandchildrenBlack or African American 5 100.0% Not responsible for grandchildrenAsian 33 100.0% Not responsible for grandchildrenTwo or more races 9 100.0% Not responsible for grandchildrenWhite alone, not Hispanic / Latino 48 27.9% Responsible for grandchildren124 72.1% Not responsible for grandchildrenHispanic or Latino 40 100.0% Not responsible for grandchildren