Races in Chapel Hill, North Carolina (NC) Detailed Stats
Data:
Races - White alone (%)
Races - White alone (% change since 2000)
Races - Black alone (%)
Races - Black alone (% change since 2000)
Races - American Indian alone (%)
Races - American Indian alone (% change since 2000)
Races - Asian alone (%)
Races - Asian alone (% change since 2000)
Races - Hispanic (%)
Races - Hispanic (% change since 2000)
Races - Native Hawaiian and Other Pacific Islander alone (%)
Races - Native Hawaiian and Other Pacific Islander alone (% change since 2000)
Races - Two or more races(%)
Races - Two or more races(% change since 2000)
Races - Other race alone (%)
Races - Other race alone (% change since 2000)
Racial diversity
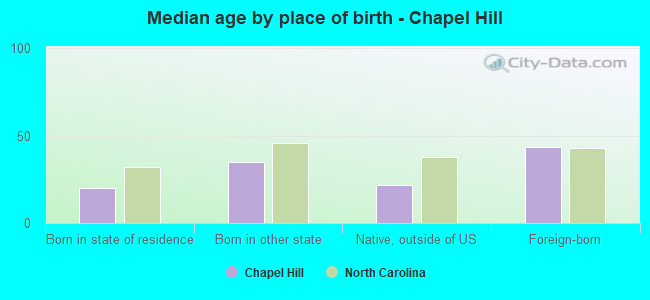
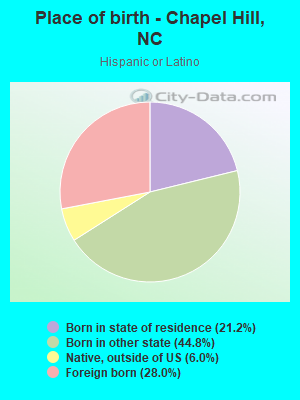
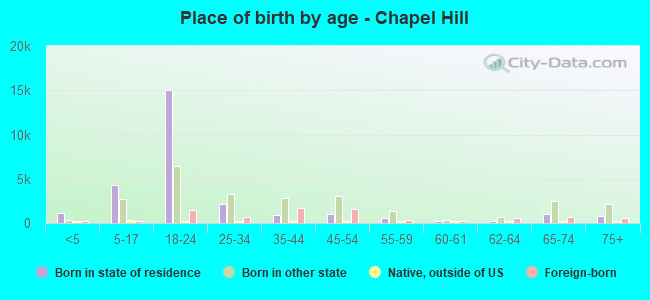
Place of birth - Born in state of residence (%)
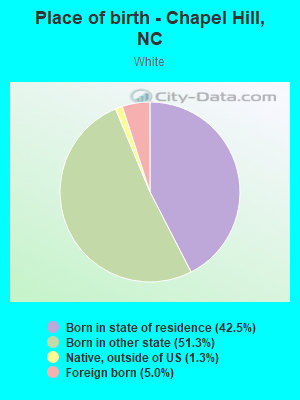
Place of birth - Born in state of residence (%) - White
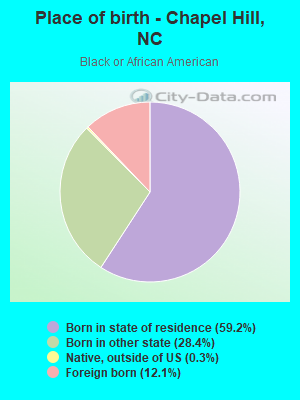
Place of birth - Born in state of residence (%) - Black or African American
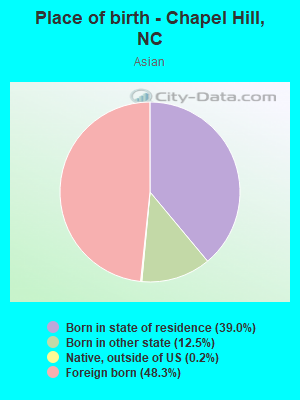
Place of birth - Born in state of residence (%) - Asian
Place of birth - Born in state of residence (%) - Hispanic or Latino
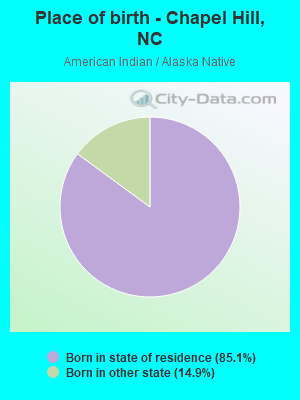
Place of birth - Born in state of residence (%) - American Indian and Alaska Native
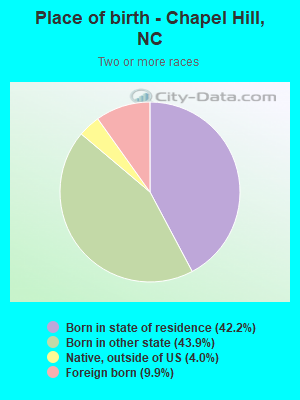
Place of birth - Born in state of residence (%) - Multirace
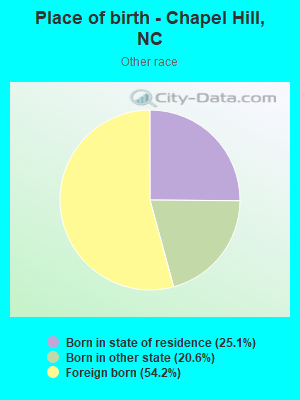
Place of birth - Born in state of residence (%) - Other Race
Place of birth - Born in other state (%)
Place of birth - Born in other state (%) - White
Place of birth - Born in other state (%) - Black or African American
Place of birth - Born in other state (%) - Asian
Place of birth - Born in other state (%) - Hispanic or Latino
Place of birth - Born in other state (%) - American Indian and Alaska Native
Place of birth - Born in other state (%) - Multirace
Place of birth - Born in other state (%) - Other Race
Place of birth - Native, outside of US (%)
Place of birth - Native, outside of US (%) - White
Place of birth - Native, outside of US (%) - Black or African American
Place of birth - Native, outside of US (%) - Asian
Place of birth - Native, outside of US (%) - Hispanic or Latino
Place of birth - Native, outside of US (%) - American Indian and Alaska Native
Place of birth - Native, outside of US (%) - Multirace
Place of birth - Native, outside of US (%) - Other Race
Place of birth - Foreign born (%)
Place of birth - Foreign born (%) - White
Place of birth - Foreign born (%) - Black or African American
Place of birth - Foreign born (%) - Asian
Place of birth - Foreign born (%) - Hispanic or Latino
Place of birth - Foreign born (%) - American Indian and Alaska Native
Place of birth - Foreign born (%) - Multirace
Place of birth - Foreign born (%) - Other Race
Residents speaking English at home (%)
Residents speaking English at home - Born in the United States (%)
Residents speaking English at home - Native, born elsewhere (%)
Residents speaking English at home - Foreign born (%)
Residents speaking Spanish at home (%)
Residents speaking Spanish at home - Born in the United States (%)
Residents speaking Spanish at home - Native, born elsewhere (%)
Residents speaking Spanish at home - Foreign born (%)
Residents speaking other language at home (%)
Residents speaking other language at home - Born in the United States (%)
Residents speaking other language at home - Native, born elsewhere (%)
Residents speaking other language at home - Foreign born (%)
Marital status - Never married (%)
Marital status - Now married (%)
Marital status - Separated (%)
Marital status - Widowed (%)
Marital status - Divorced (%)
Ancestries Reported - Arab (%)
Ancestries Reported - Czech (%)
Ancestries Reported - Danish (%)
Ancestries Reported - Dutch (%)
Ancestries Reported - English (%)
Ancestries Reported - French (%)
Ancestries Reported - French Canadian (%)
Ancestries Reported - German (%)
Ancestries Reported - Greek (%)
Ancestries Reported - Hungarian (%)
Ancestries Reported - Irish (%)
Ancestries Reported - Italian (%)
Ancestries Reported - Lithuanian (%)
Ancestries Reported - Norwegian (%)
Ancestries Reported - Polish (%)
Ancestries Reported - Portuguese (%)
Ancestries Reported - Russian (%)
Ancestries Reported - Scotch-Irish (%)
Ancestries Reported - Scottish (%)
Ancestries Reported - Slovak (%)
Ancestries Reported - Subsaharan African (%)
Ancestries Reported - Swedish (%)
Ancestries Reported - Swiss (%)
Ancestries Reported - Ukrainian (%)
Ancestries Reported - United States (%)
Ancestries Reported - Welsh (%)
Ancestries Reported - West Indian (%)
Ancestries Reported - Other (%)
Geographical mobility - Same house 1 year ago (%)
Geographical mobility - Same house 1 year ago (%) - White
Geographical mobility - Same house 1 year ago (%) - Black or African American
Geographical mobility - Same house 1 year ago (%) - Asian
Geographical mobility - Same house 1 year ago (%) - Hispanic or Latino
Geographical mobility - Same house 1 year ago (%) - American Indian and Alaska Native
Geographical mobility - Same house 1 year ago (%) - Multirace
Geographical mobility - Same house 1 year ago (%) - Other Race
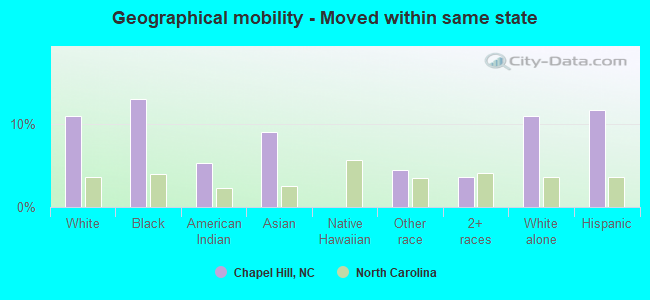
Geographical mobility - Moved within same county (%)
Geographical mobility - Moved within same county (%) - White
Geographical mobility - Moved within same county (%) - Black or African American
Geographical mobility - Moved within same county (%) - Asian
Geographical mobility - Moved within same county (%) - Hispanic or Latino
Geographical mobility - Moved within same county (%) - American Indian and Alaska Native
Geographical mobility - Moved within same county (%) - Multirace
Geographical mobility - Moved within same county (%) - Other Race
Geographical mobility - Moved from different county within same state (%)
Geographical mobility - Moved from different county within same state (%) - White
Geographical mobility - Moved from different county within same state (%) - Black or African American
Geographical mobility - Moved from different county within same state (%) - Asian
Geographical mobility - Moved from different county within same state (%) - Hispanic or Latino
Geographical mobility - Moved from different county within same state (%) - American Indian and Alaska Native
Geographical mobility - Moved from different county within same state (%) - Multirace
Geographical mobility - Moved from different county within same state (%) - Other Race
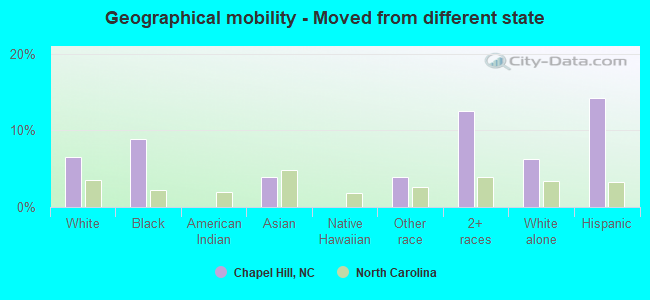
Geographical mobility - Moved from different state (%)
Geographical mobility - Moved from different state (%) - White
Geographical mobility - Moved from different state (%) - Black or African American
Geographical mobility - Moved from different state (%) - Asian
Geographical mobility - Moved from different state (%) - Hispanic or Latino
Geographical mobility - Moved from different state (%) - American Indian and Alaska Native
Geographical mobility - Moved from different state (%) - Multirace
Geographical mobility - Moved from different state (%) - Other Race
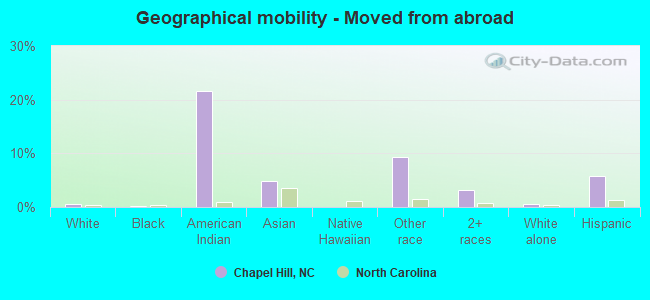
Geographical mobility - Moved from abroad (%)
Geographical mobility - Moved from abroad (%) - White
Geographical mobility - Moved from abroad (%) - Black or African American
Geographical mobility - Moved from abroad (%) - Asian
Geographical mobility - Moved from abroad (%) - Hispanic or Latino
Geographical mobility - Moved from abroad (%) - American Indian and Alaska Native
Geographical mobility - Moved from abroad (%) - Multirace
Geographical mobility - Moved from abroad (%) - Other Race
Place of birth for the foreign-born population - Ireland (%)
Place of birth for the foreign-born population - Denmark (%)
Place of birth for the foreign-born population - Norway (%)
Place of birth for the foreign-born population - Sweden (%)
Place of birth for the foreign-born population - United Kingdom (%)
Place of birth for the foreign-born population - England (%)
Place of birth for the foreign-born population - Scotland (%)
Place of birth for the foreign-born population - Other Northern Europe (%)
Place of birth for the foreign-born population - Austria (%)
Place of birth for the foreign-born population - Belgium (%)
Place of birth for the foreign-born population - France (%)
Place of birth for the foreign-born population - Germany (%)
Place of birth for the foreign-born population - Netherlands (%)
Place of birth for the foreign-born population - Switzerland (%)
Place of birth for the foreign-born population - Other Western Europe (%)
Place of birth for the foreign-born population - Greece (%)
Place of birth for the foreign-born population - Italy (%)
Place of birth for the foreign-born population - Portugal (%)
Place of birth for the foreign-born population - Spain (%)
Place of birth for the foreign-born population - Other Southern Europe (%)
Place of birth for the foreign-born population - Albania (%)
Place of birth for the foreign-born population - Belarus (%)
Place of birth for the foreign-born population - Bosnia and Herzegovina (%)
Place of birth for the foreign-born population - Bulgaria (%)
Place of birth for the foreign-born population - Croatia (%)
Place of birth for the foreign-born population - Czechoslovakia (%)
Place of birth for the foreign-born population - Hungary (%)
Place of birth for the foreign-born population - Latvia (%)
Place of birth for the foreign-born population - Lithuania (%)
Place of birth for the foreign-born population - North Macedonia (Macedonia) (%)
Place of birth for the foreign-born population - Moldova (%)
Place of birth for the foreign-born population - Poland (%)
Place of birth for the foreign-born population - Romania (%)
Place of birth for the foreign-born population - Russia (%)
Place of birth for the foreign-born population - Serbia (%)
Place of birth for the foreign-born population - Ukraine (%)
Place of birth for the foreign-born population - Other Eastern Europe (%)
Place of birth for the foreign-born population - China (%)
Place of birth for the foreign-born population - Hong Kong (%)
Place of birth for the foreign-born population - Taiwan (%)
Place of birth for the foreign-born population - Japan (%)
Place of birth for the foreign-born population - Korea (%)
Place of birth for the foreign-born population - Other Eastern Asia (%)
Place of birth for the foreign-born population - Afghanistan (%)
Place of birth for the foreign-born population - Bangladesh (%)
Place of birth for the foreign-born population - India (%)
Place of birth for the foreign-born population - Iran (%)
Place of birth for the foreign-born population - Kazakhstan (%)
Place of birth for the foreign-born population - Nepal (%)
Place of birth for the foreign-born population - Pakistan (%)
Place of birth for the foreign-born population - Sri Lanka (%)
Place of birth for the foreign-born population - Uzbekistan (%)
Place of birth for the foreign-born population - Other South Central Asia (%)
Place of birth for the foreign-born population - Burma (%)
Place of birth for the foreign-born population - Cambodia (%)
Place of birth for the foreign-born population - Indonesia (%)
Place of birth for the foreign-born population - Laos (%)
Place of birth for the foreign-born population - Malaysia (%)
Place of birth for the foreign-born population - Philippines (%)
Place of birth for the foreign-born population - Singapore (%)
Place of birth for the foreign-born population - Thailand (%)
Place of birth for the foreign-born population - Vietnam (%)
Place of birth for the foreign-born population - Other South Eastern Asia (%)
Place of birth for the foreign-born population - Armenia (%)
Place of birth for the foreign-born population - Iraq (%)
Place of birth for the foreign-born population - Israel (%)
Place of birth for the foreign-born population - Jordan (%)
Place of birth for the foreign-born population - Kuwait (%)
Place of birth for the foreign-born population - Lebanon (%)
Place of birth for the foreign-born population - Saudi Arabia (%)
Place of birth for the foreign-born population - Syria (%)
Place of birth for the foreign-born population - Turkey (%)
Place of birth for the foreign-born population - Yemen (%)
Place of birth for the foreign-born population - Other Western Asia (%)
Place of birth for the foreign-born population - Eritrea (%)
Place of birth for the foreign-born population - Ethiopia (%)
Place of birth for the foreign-born population - Kenya (%)
Place of birth for the foreign-born population - Somalia (%)
Place of birth for the foreign-born population - Uganda (%)
Place of birth for the foreign-born population - Zimbabwe (%)
Place of birth for the foreign-born population - Other Eastern Africa (%)
Place of birth for the foreign-born population - Cameroon (%)
Place of birth for the foreign-born population - Congo (%)
Place of birth for the foreign-born population - Democratic Republic of Congo (Zaire) (%)
Place of birth for the foreign-born population - Other Middle Africa (%)
Place of birth for the foreign-born population - Egypt (%)
Place of birth for the foreign-born population - Morocco (%)
Place of birth for the foreign-born population - Sudan (%)
Place of birth for the foreign-born population - Other Northern Africa (%)
Place of birth for the foreign-born population - South Africa (%)
Place of birth for the foreign-born population - Other Southern Africa (%)
Place of birth for the foreign-born population - Cabo Verde (%)
Place of birth for the foreign-born population - Ghana (%)
Place of birth for the foreign-born population - Liberia (%)
Place of birth for the foreign-born population - Nigeria (%)
Place of birth for the foreign-born population - Senegal (%)
Place of birth for the foreign-born population - Sierra Leone (%)
Place of birth for the foreign-born population - Other Western Africa (%)
Place of birth for the foreign-born population - Australia (%)
Place of birth for the foreign-born population - New Zealand (%)
Place of birth for the foreign-born population - Fiji (%)
Place of birth for the foreign-born population - Micronesia (%)
Place of birth for the foreign-born population - Bahamas (%)
Place of birth for the foreign-born population - Barbados (%)
Place of birth for the foreign-born population - Cuba (%)
Place of birth for the foreign-born population - Dominica (%)
Place of birth for the foreign-born population - Dominican Republic (%)
Place of birth for the foreign-born population - Grenada (%)
Place of birth for the foreign-born population - Haiti (%)
Place of birth for the foreign-born population - Jamaica (%)
Place of birth for the foreign-born population - St. Vincent and the Grenadines (%)
Place of birth for the foreign-born population - Trinidad and Tobago (%)
Place of birth for the foreign-born population - West Indies (%)
Place of birth for the foreign-born population - Other Caribbean (%)
Place of birth for the foreign-born population - Belize (%)
Place of birth for the foreign-born population - Costa Rica (%)
Place of birth for the foreign-born population - El Salvador (%)
Place of birth for the foreign-born population - Guatemala (%)
Place of birth for the foreign-born population - Honduras (%)
Place of birth for the foreign-born population - Mexico (%)
Place of birth for the foreign-born population - Nicaragua (%)
Place of birth for the foreign-born population - Panama (%)
Place of birth for the foreign-born population - Other Central America (%)
Place of birth for the foreign-born population - Argentina (%)
Place of birth for the foreign-born population - Bolivia (%)
Place of birth for the foreign-born population - Brazil (%)
Place of birth for the foreign-born population - Chile (%)
Place of birth for the foreign-born population - Colombia (%)
Place of birth for the foreign-born population - Ecuador (%)
Place of birth for the foreign-born population - Guyana (%)
Place of birth for the foreign-born population - Peru (%)
Place of birth for the foreign-born population - Uruguay (%)
Place of birth for the foreign-born population - Venezuela (%)
Place of birth for the foreign-born population - Other South America (%)
Place of birth for the foreign-born population - Canada (%)
Place of birth for the foreign-born population - Other Northern America (%)
Place of birth for the foreign-born population - Other (%)
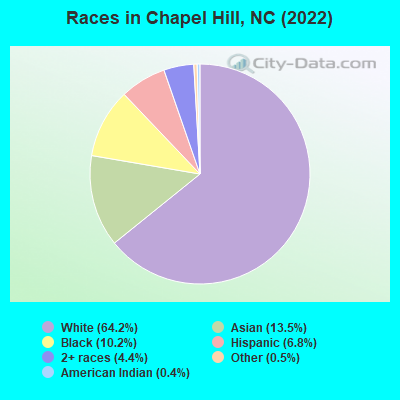
According to 2022 data, the most numerous races in Chapel Hill, NC are White alone (38,996 residents), Black alone (6,224 residents), and Hispanic (4,151 residents). 80.5% of Chapel Hill residents speak English at home. 16.4% of Chapel Hill, NC residents are foreign-born (8.9% born in Asia, 2.5% born in Europe, 2.4% born in Latin America, 1.8% born in Africa), which is 51.1% greater than the foreign-born rate of 8.0% across the entire state of North Carolina.
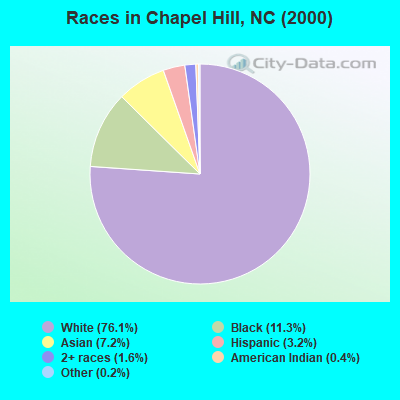
Race distribution in Chapel Hill
2000 2022
5,647,155 70.2% White alone 1,723,301 21.4% Black alone 378,963 4.7% Hispanic 112,416 1.4% Asian alone 95,333 1.2% American Indian alone 79,965 1.0% Two or more races 9,015 0.1% Other race alone 3,165 0.04% Native Hawaiian and Other
6,497,519 60.7% White alone 2,155,650 20.1% Black alone 1,114,799 10.4% Hispanic 438,061 4.1% Two or more races 341,052 3.2% Asian alone 91,758 0.9% American Indian alone 50,180 0.5% Other race alone 9,954 0.09% Native Hawaiian and Other
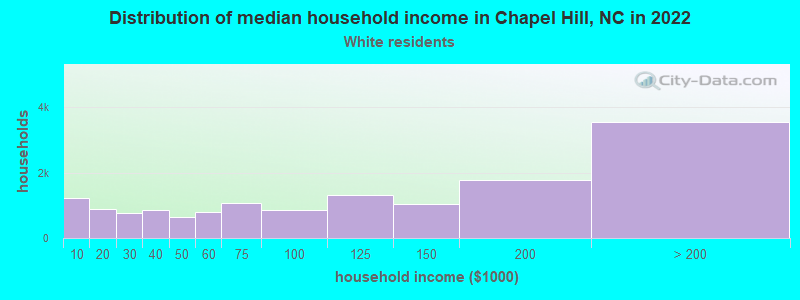
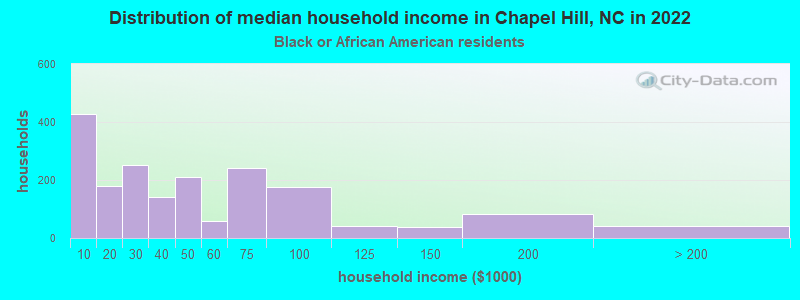
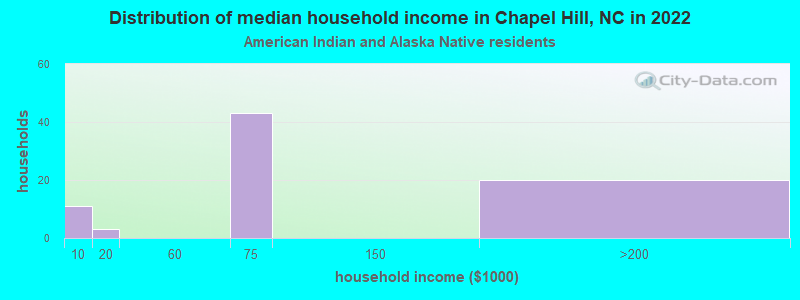
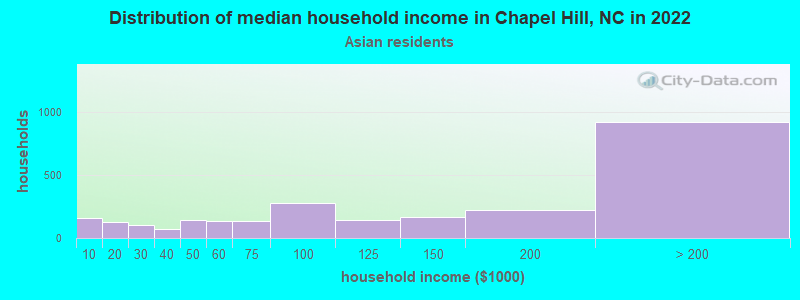
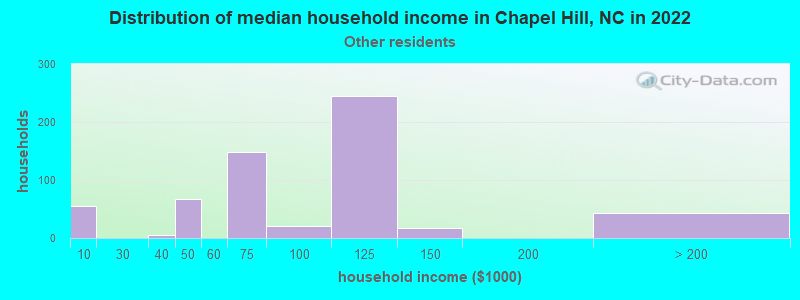
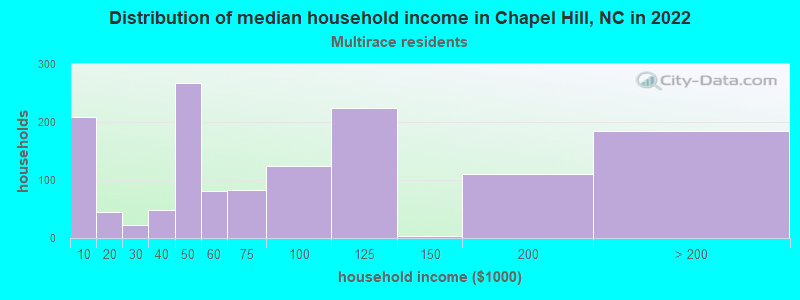
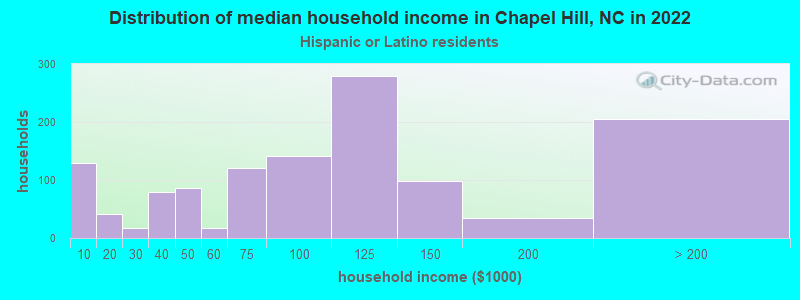
Income and house value in Chapel Hill Median household income in 2022 $104,858 White non-Hispanic householders$33,851 Black householders$69,650 American Indian and Alaska Native householders$108,974 Asian householders$92,414 Some other race householders$84,435 Two or more races householders$89,157 Hispanic or Latino race householdersMedian 2022 house value $664,909 White Non-Hispanic householders$316,888 Black or African American householders$180,682 American Indian or Alaska Native householders $603,199 Asian householders$284,921 Some other race householders$429,467 Two or more races householders$360,530 Hispanic or Latino householders
Median age by race in Chapel Hill
26.3 Median age for White residents26.1 26.7 22.8 Median age for Black or African American residents20.4 25.4 45.8 Median age for American Indian / Alaska Native residents75.4 44.5 19.0 Median age for Asian residents16.9 20.1 -609,884,331.7 Median age for Native Hawaiian / Pacific Islander residents-666,666,666.0 -612,403,100.2 20.2 Median age for Other race residents24.7 16.5 21.1 Median age for Two or more races residents17.5 24.1 26.4 Median age for White alone residents26.1 26.4 21.6 Median age for Hispanic or Latino residents21.3 20.8
Owner/renter occupied households by race in Chapel Hill
House owners and renters - White residents 8,211 55.2% Owner occupied6,657 44.8% Renter occupiedHouse owners and renters - Black or African American residents 460 26.3% Owner occupied1,291 73.7% Renter occupiedHouse owners and renters - American Indian / Alaska Native residents 32 58.2% Owner occupied23 41.8% Renter occupiedHouse owners and renters - Asian residents 1,414 70.9% Owner occupied579 29.1% Renter occupiedHouse owners and renters - Other race residents 107 18.4% Owner occupied477 81.6% Renter occupiedHouse owners and renters - Two or more races residents 341 36.2% Owner occupied601 63.8% Renter occupiedHouse owners and renters - White alone residents 8,141 55.9% Owner occupied6,418 44.1% Renter occupiedHouse owners and renters - Hispanic or Latino residents 292 28.8% Owner occupied722 71.2% Renter occupied
Language usage in Chapel Hill
English speakers - Total 80.5% of residents of Chapel Hill speak English at home.
5.3% of residents speak Spanish at home 1,780 56.4% Speak English very well1,377 43.6% Speak English less than very well13.4% of residents speak other language at home 5,703 71.8% Speak English very well2,237 28.2% Speak English less than very well
English speakers - Born in the United States 91.7% of residents of Chapel Hill speak English at home.
3.7% of residents speak Spanish at home 900 96.8% Speak English very well30 3.2% Speak English less than very well4.8% of residents speak other language at home 1,195 98.3% Speak English very well21 1.7% Speak English less than very well
English speakers - Native, born elsewhere 65.6% of residents of Chapel Hill speak English at home.
14.0% of residents speak Spanish at home 59 52.7% Speak English very well53 47.3% Speak English less than very well14.8% of residents speak other language at home 118 100.0% Speak English very well
English speakers - Foreign-born 21.6% of residents of Chapel Hill speak English at home.
14.0% of residents speak Spanish at home 300 27.1% Speak English very well809 72.9% Speak English less than very well62.1% of residents speak other language at home 2,695 54.9% Speak English very well2,211 45.1% Speak English less than very well
White (Caucasian) - Speak only English Native:
94.8% (35,154)Foreign-born:
37.2% (734)
White (Caucasian) - Speak another language Native:
4.8% (1,795)Foreign-born:
62.8% (1,239)
Black or African American - Speak only English Native:
96.6% (4,971)Foreign-born:
36.3% (307)
Black or African American - Speak another language Native:
3.3% (168)Foreign-born:
63.6% (538)
Asian - Speak only English Native:
43.6% (1,735)Foreign-born:
15.9% (643)
Asian - Speak another language Native:
56.4% (2,245)Foreign-born:
84.2% (3,395)
Other race - Speak only English Native:
42.8% (537)Foreign-born:
2.0% (27)
Other race - Speak another language Native:
56.0% (702)Foreign-born:
98.3% (1,307)
Two or more races - Speak only English Native:
90.7% (2,741)Foreign-born:
41.7% (146)
Two or more races - Speak another language Native:
9.5% (286)Foreign-born:
62.1% (217)
White alone - Speak only English Native:
95.9% (34,477)Foreign-born:
35.5% (741)
White alone - Speak another language Native:
4.3% (1,528)Foreign-born:
65.5% (1,370)
Hispanic or Latino - Speak only English Native:
57.0% (1,694)Foreign-born:
10.3% (125)
Hispanic or Latino - Speak another language Native:
44.6% (1,327)Foreign-born:
89.7% (1,086)
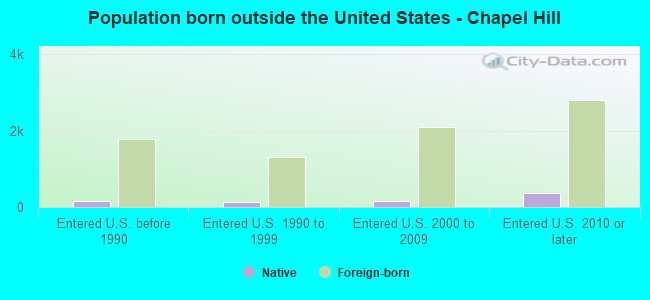
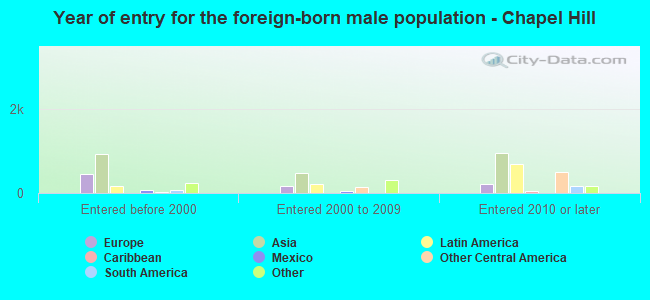
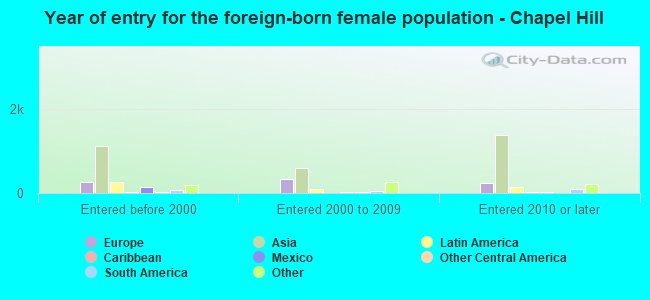
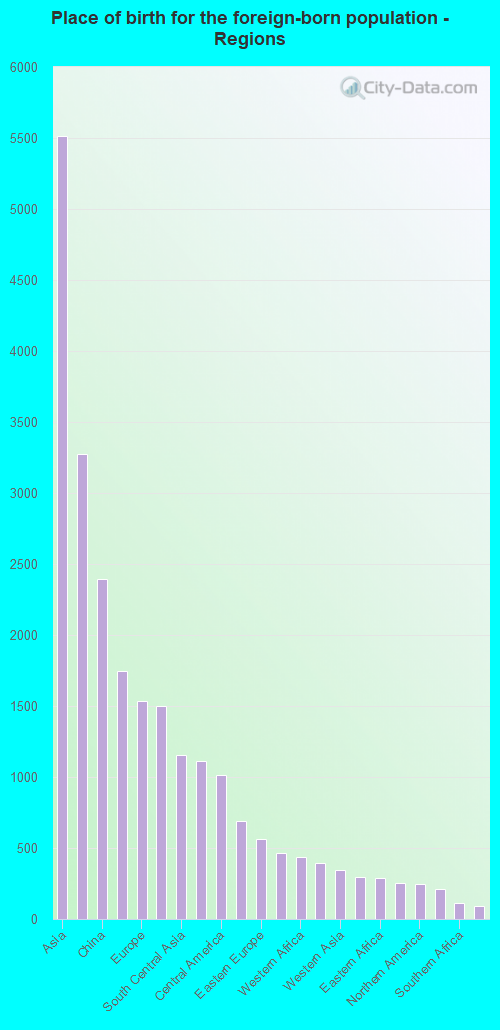
Foreign-born residents in Chapel Hill 9,943 residents are foreign born (8.9% Asia , 2.5% Europe , 2.4% Latin America , 1.8% Africa ).
This city:
16.4%North Carolina:
8.3%
Marital status for residents in Chapel Hill Marital status - White (Caucasian) population 15 years and over
Males 53.8% Never married37.7% Now married0.7% Separated1.6% Widowed6.3% DivorcedFemales 54.6% Never married32.8% Now married0.7% Separated4.4% Widowed7.5% DivorcedWomen who gave birth in the past 12 months Now married:
100.0% (132)Unmarried:
0.0% (0)
Women who did not give birth in the past 12 months Now married:
22.6% (3,119)Unmarried:
77.4% (10,672)
Marital status - Black or African American population 15 years and over
Males 70.5% Never married24.0% Now married2.0% Separated1.1% Widowed2.4% DivorcedFemales 69.1% Never married14.8% Now married4.1% Separated5.4% Widowed6.6% DivorcedWomen who gave birth in the past 12 months Now married:
100.0% (13)Unmarried:
0.0% (0)
Women who did not give birth in the past 12 months Now married:
11.0% (244)Unmarried:
89.0% (1,979)
Marital status - American Indian / Alaska Native population 15 years and over
Males 26.5% Never married64.7% Now married8.8% Separated0.0% Widowed0.0% DivorcedFemales 58.2% Never married29.1% Now married0.0% Separated0.0% Widowed12.7% DivorcedWomen who did not give birth in the past 12 months Now married:
0.0% (0)Unmarried:
100.0% (79)
Marital status - Asian population 15 years and over
Males 48.6% Never married48.5% Now married0.2% Separated0.9% Widowed1.9% DivorcedFemales 47.4% Never married45.6% Now married0.1% Separated4.3% Widowed2.6% DivorcedWomen who gave birth in the past 12 months Now married:
100.0% (42)Unmarried:
0.0% (0)
Women who did not give birth in the past 12 months Now married:
39.0% (1,679)Unmarried:
61.0% (2,623)
Marital status - Other race population 15 years and over
Males 88.2% Never married5.5% Now married1.1% Separated0.0% Widowed5.3% DivorcedFemales 66.9% Never married7.7% Now married4.7% Separated12.9% Widowed7.7% DivorcedWomen who gave birth in the past 12 months Now married:
66.7% (20)Unmarried:
33.3% (10)
Women who did not give birth in the past 12 months Now married:
4.5% (26)Unmarried:
95.5% (561)
Marital status - Two or more races population 15 years and over
Males 54.5% Never married40.9% Now married4.6% Separated0.0% Widowed0.0% DivorcedFemales 60.9% Never married29.0% Now married0.0% Separated1.2% Widowed8.9% DivorcedWomen who gave birth in the past 12 months Now married:
90.9% (14)Unmarried:
9.1% (1)
Women who did not give birth in the past 12 months Now married:
15.4% (171)Unmarried:
84.6% (937)
Marital status - White alone, not Hispanic / Latino population 15 years and over
Males 53.7% Never married37.9% Now married0.7% Separated1.7% Widowed6.1% DivorcedFemales 53.9% Never married33.3% Now married0.4% Separated4.6% Widowed7.7% DivorcedWomen who gave birth in the past 12 months Now married:
100.0% (124)Unmarried:
0.0% (0)
Women who did not give birth in the past 12 months Now married:
22.7% (3,058)Unmarried:
77.3% (10,421)
Marital status - Hispanic or Latino population 15 years and over
Males 71.0% Never married19.1% Now married3.2% Separated0.0% Widowed6.7% DivorcedFemales 68.1% Never married17.7% Now married5.6% Separated3.7% Widowed4.9% DivorcedWomen who gave birth in the past 12 months Now married:
66.7% (12)Unmarried:
33.3% (6)
Women who did not give birth in the past 12 months Now married:
17.4% (214)Unmarried:
82.6% (1,018)
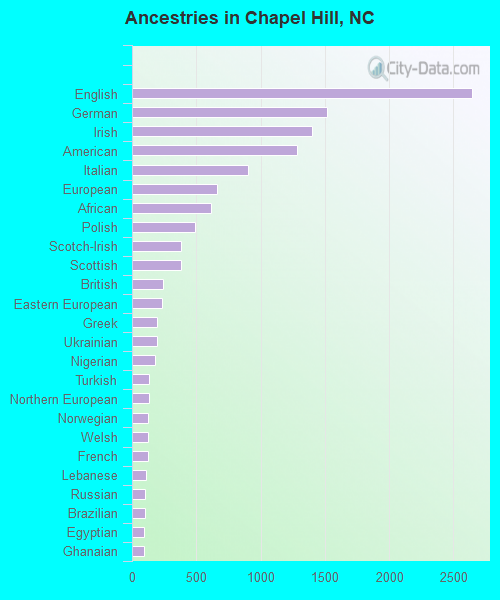
Ancestries in Chapel Hill
2,644 7.8% English1,515 4.5% German1,397 4.1% Irish1,282 3.8% American901 2.7% Italian660 2.0% European611 1.8% African488 1.4% Polish384 1.1% Scotch-Irish383 1.1% Scottish242 0.7% British231 0.7% Eastern European195 0.6% Greek194 0.6% Ukrainian182 0.5% Nigerian135 0.4% Turkish132 0.4% Northern European127 0.4% Norwegian122 0.4% Welsh121 0.4% French105 0.3% Lebanese100 0.3% Russian99 0.3% Brazilian97 0.3% Egyptian95 0.3% Ghanaian86 0.3% Hungarian83 0.2% Iranian71 0.2% Dutch71 0.2% Canadian66 0.2% Scandinavian58 0.2% Slovak56 0.2% Arab54 0.2% Finnish51 0.2% Kenyan46 0.1% British West Indian44 0.1% Swedish42 0.1% Palestinian38 0.1% Lithuanian37 0.1% Austrian37 0.1% Romanian36 0.1% Swiss34 0.1% Jamaican33 0.10% Armenian31 0.09% South African26 0.08% Yugoslavian23 0.07% Macedonian23 0.07% French Canadian17 0.05% Bulgarian16 0.05% Estonian15 0.04% Serbian14 0.04% Czechoslovakian13 0.04% West Indian12 0.04% Slovene11 0.03% Assyrian9 0.03% Trinidadian and Tobagonian5 0.01% Danish5 0.01% Czech5 0.01% Belgian4 0.01% Barbadian2 0.01% Ugandan2 0.01% Haitian
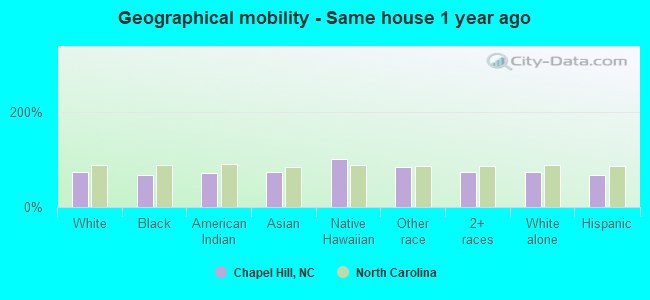
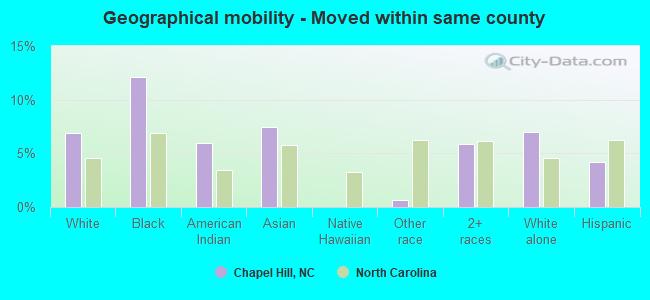
Geographical mobility in Chapel Hill Same house 1 year ago 29,422 73.9% White (Caucasian)4,355 67.0% Black or African American176 71.8% American Indian / Alaska Native6,092 74.1% Asian2 100.0% Native Hawaiian / Pacific Islander1,757 83.9% Other race2,550 74.5% Two or more races28,836 74.1% White alone, not Hispanic / Latino2,760 68.3% Hispanic or LatinoMoved within same county 2,757 6.9% White / Caucasian787 12.1% Black or African American15 5.9% American Indian / Alaska Native613 7.5% Asian15 0.7% Other race200 5.8% Two or more races2,702 6.9% White alone, not Hispanic / Latino169 4.2% Hispanic or LatinoMoved within same state 4,377 11.0% White / Caucasian850 13.1% Black or African American13 5.4% American Indian / Alaska Native749 9.1% Asian93 4.4% Other race123 3.6% Two or more races4,311 11.1% White alone, not Hispanic / Latino476 11.8% Hispanic or LatinoMoved from different state 2,595 6.5% White / Caucasian576 8.9% Black or African American325 4.0% Asian83 4.0% Other race430 12.6% Two or more races2,443 6.3% White alone, not Hispanic / Latino577 14.3% Hispanic or LatinoMoved from abroad 214 0.5% White12 0.2% Black or African American53 21.7% American Indian / Alaska Native400 4.9% Asian195 9.3% Other race109 3.2% Two or more races220 0.6% White alone, not Hispanic / Latino236 5.8% Hispanic or Latino
Children Nativity (place of birth) in Chapel Hill
Children under 6 years - Living with two parents Both parents native 907 98.2% Native17 1.8% Foreign-bornBoth parents foreign-born 168 75.7% Native54 24.3% Foreign-bornOne native, one foreign-born parent 212 98.0% Native4 2.0% Foreign-bornChildren under 6 years - Living with one parent Native parent 248 100.0% NativeForeign-born parent 149 100.0% NativeChildren 6 to 17 years - Living with two parents Both parents native 2,934 97.1% Native87 2.9% Foreign-bornBoth parents foreign-born 713 76.6% Native218 23.4% Foreign-bornOne native, one foreign-born parent 1,012 100.0% NativeChildren 6 to 17 years - Living with one parent Native parent 1,801 100.0% NativeForeign-born parent 428 54.7% Native355 45.3% Foreign-born
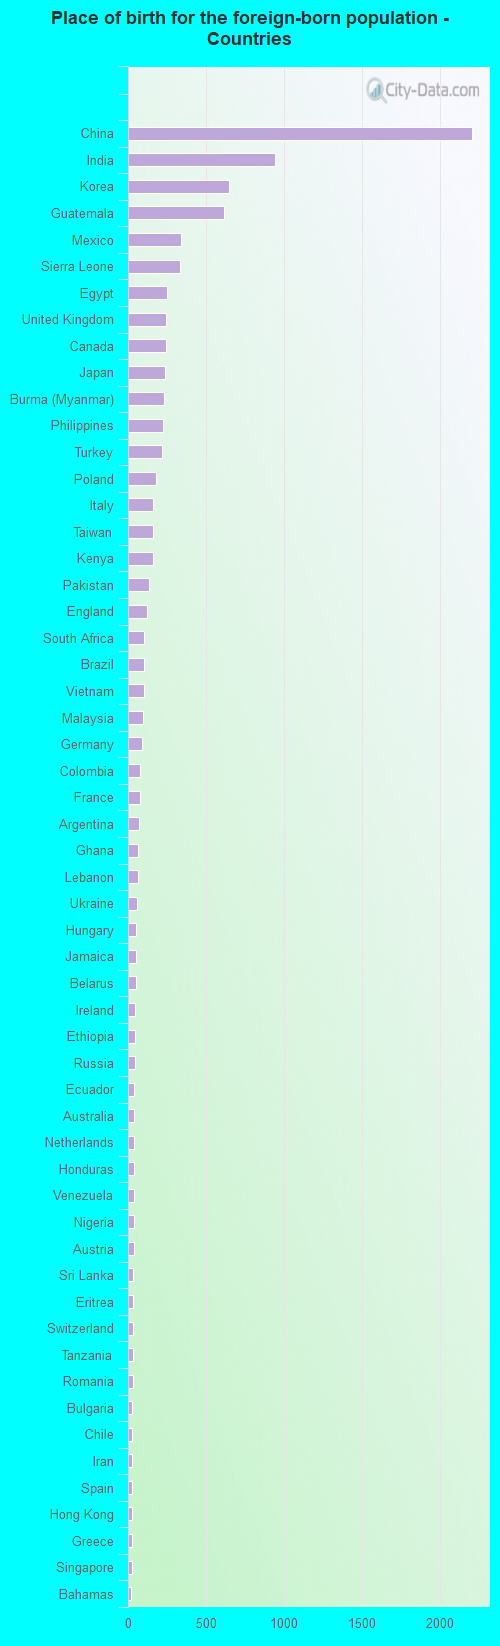
Place of birth for residents in Chapel Hill 5,513 Asia3,278 Eastern Asia2,392 China1,746 Americas1,532 Europe1,500 Latin America1,152 South Central Asia1,110 Africa1,012 Central America689 South Eastern Asia566 Eastern Europe462 Northern Europe435 Western Africa395 South America346 Western Asia293 Western Europe289 Eastern Africa252 Northern Africa245 Northern America210 Southern Europe114 Southern Africa92 Caribbean41 Oceania41 Australia and New Zealand Subregion19 Middle Africa2,206 China944 India647 Korea616 Guatemala341 Mexico333 Sierra Leone248 Egypt246 United Kingdom245 Canada238 Japan228 Burma (Myanmar)223 Philippines221 Turkey178 Poland162 Italy161 Taiwan159 Kenya137 Pakistan124 England103 South Africa102 Brazil101 Vietnam98 Malaysia91 Germany76 Colombia74 France71 Argentina63 Ghana62 Lebanon55 Ukraine54 Hungary53 Jamaica53 Belarus46 Ireland43 Ethiopia42 Russia41 Ecuador41 Australia41 Netherlands40 Honduras39 Venezuela38 Nigeria38 Austria35 Sri Lanka34 Eritrea33 Switzerland33 Tanzania32 Romania27 Bulgaria27 Chile25 Iran24 Spain24 Hong Kong23 Greece23 Singapore21 Bahamas19 Cameroon19 Serbia16 Armenia15 Scotland14 Costa Rica13 Belgium11 Kuwait10 Georgia10 Thailand9 Trinidad and Tobago8 Iraq8 Israel8 Dominican Republic7 Croatia7 Uruguay7 Bangladesh6 Saudi Arabia6 Uganda6 Czechoslovakia4 Cambodia4 Algeria2 Uzbekistan
Grandparents responsible for own grandchildren in Chapel Hill
Grandparents (30 to 59 years) White / Caucasian 88 86.0% Responsible for grandchildren14 14.0% Not responsible for grandchildrenBlack or African American 48 100.0% Not responsible for grandchildrenWhite alone, not Hispanic / Latino 94 86.4% Responsible for grandchildren15 13.6% Not responsible for grandchildrenGrandparents (60 years and over) White / Caucasian 10 7.0% Responsible for grandchildren136 93.0% Not responsible for grandchildrenBlack or African American 122 63.9% Responsible for grandchildren69 36.1% Not responsible for grandchildrenWhite alone, not Hispanic / Latino 10 8.1% Responsible for grandchildren119 91.9% Not responsible for grandchildren