Races in Chattanooga, Tennessee (TN) Detailed Stats
Data:
Races - White alone (%)
Races - White alone (% change since 2000)
Races - Black alone (%)
Races - Black alone (% change since 2000)
Races - American Indian alone (%)
Races - American Indian alone (% change since 2000)
Races - Asian alone (%)
Races - Asian alone (% change since 2000)
Races - Hispanic (%)
Races - Hispanic (% change since 2000)
Races - Native Hawaiian and Other Pacific Islander alone (%)
Races - Native Hawaiian and Other Pacific Islander alone (% change since 2000)
Races - Two or more races(%)
Races - Two or more races(% change since 2000)
Races - Other race alone (%)
Races - Other race alone (% change since 2000)
Racial diversity
Place of birth - Born in state of residence (%)
Place of birth - Born in state of residence (%) - White
Place of birth - Born in state of residence (%) - Black or African American
Place of birth - Born in state of residence (%) - Asian
Place of birth - Born in state of residence (%) - Hispanic or Latino
Place of birth - Born in state of residence (%) - American Indian and Alaska Native
Place of birth - Born in state of residence (%) - Multirace
Place of birth - Born in state of residence (%) - Other Race
Place of birth - Born in other state (%)
Place of birth - Born in other state (%) - White
Place of birth - Born in other state (%) - Black or African American
Place of birth - Born in other state (%) - Asian
Place of birth - Born in other state (%) - Hispanic or Latino
Place of birth - Born in other state (%) - American Indian and Alaska Native
Place of birth - Born in other state (%) - Multirace
Place of birth - Born in other state (%) - Other Race
Place of birth - Native, outside of US (%)
Place of birth - Native, outside of US (%) - White
Place of birth - Native, outside of US (%) - Black or African American
Place of birth - Native, outside of US (%) - Asian
Place of birth - Native, outside of US (%) - Hispanic or Latino
Place of birth - Native, outside of US (%) - American Indian and Alaska Native
Place of birth - Native, outside of US (%) - Multirace
Place of birth - Native, outside of US (%) - Other Race
Place of birth - Foreign born (%)
Place of birth - Foreign born (%) - White
Place of birth - Foreign born (%) - Black or African American
Place of birth - Foreign born (%) - Asian
Place of birth - Foreign born (%) - Hispanic or Latino
Place of birth - Foreign born (%) - American Indian and Alaska Native
Place of birth - Foreign born (%) - Multirace
Place of birth - Foreign born (%) - Other Race
Residents speaking English at home (%)
Residents speaking English at home - Born in the United States (%)
Residents speaking English at home - Native, born elsewhere (%)
Residents speaking English at home - Foreign born (%)
Residents speaking Spanish at home (%)
Residents speaking Spanish at home - Born in the United States (%)
Residents speaking Spanish at home - Native, born elsewhere (%)
Residents speaking Spanish at home - Foreign born (%)
Residents speaking other language at home (%)
Residents speaking other language at home - Born in the United States (%)
Residents speaking other language at home - Native, born elsewhere (%)
Residents speaking other language at home - Foreign born (%)
Marital status - Never married (%)
Marital status - Now married (%)
Marital status - Separated (%)
Marital status - Widowed (%)
Marital status - Divorced (%)
Ancestries Reported - Arab (%)
Ancestries Reported - Czech (%)
Ancestries Reported - Danish (%)
Ancestries Reported - Dutch (%)
Ancestries Reported - English (%)
Ancestries Reported - French (%)
Ancestries Reported - French Canadian (%)
Ancestries Reported - German (%)
Ancestries Reported - Greek (%)
Ancestries Reported - Hungarian (%)
Ancestries Reported - Irish (%)
Ancestries Reported - Italian (%)
Ancestries Reported - Lithuanian (%)
Ancestries Reported - Norwegian (%)
Ancestries Reported - Polish (%)
Ancestries Reported - Portuguese (%)
Ancestries Reported - Russian (%)
Ancestries Reported - Scotch-Irish (%)
Ancestries Reported - Scottish (%)
Ancestries Reported - Slovak (%)
Ancestries Reported - Subsaharan African (%)
Ancestries Reported - Swedish (%)
Ancestries Reported - Swiss (%)
Ancestries Reported - Ukrainian (%)
Ancestries Reported - United States (%)
Ancestries Reported - Welsh (%)
Ancestries Reported - West Indian (%)
Ancestries Reported - Other (%)
Geographical mobility - Same house 1 year ago (%)
Geographical mobility - Same house 1 year ago (%) - White
Geographical mobility - Same house 1 year ago (%) - Black or African American
Geographical mobility - Same house 1 year ago (%) - Asian
Geographical mobility - Same house 1 year ago (%) - Hispanic or Latino
Geographical mobility - Same house 1 year ago (%) - American Indian and Alaska Native
Geographical mobility - Same house 1 year ago (%) - Multirace
Geographical mobility - Same house 1 year ago (%) - Other Race
Geographical mobility - Moved within same county (%)
Geographical mobility - Moved within same county (%) - White
Geographical mobility - Moved within same county (%) - Black or African American
Geographical mobility - Moved within same county (%) - Asian
Geographical mobility - Moved within same county (%) - Hispanic or Latino
Geographical mobility - Moved within same county (%) - American Indian and Alaska Native
Geographical mobility - Moved within same county (%) - Multirace
Geographical mobility - Moved within same county (%) - Other Race
Geographical mobility - Moved from different county within same state (%)
Geographical mobility - Moved from different county within same state (%) - White
Geographical mobility - Moved from different county within same state (%) - Black or African American
Geographical mobility - Moved from different county within same state (%) - Asian
Geographical mobility - Moved from different county within same state (%) - Hispanic or Latino
Geographical mobility - Moved from different county within same state (%) - American Indian and Alaska Native
Geographical mobility - Moved from different county within same state (%) - Multirace
Geographical mobility - Moved from different county within same state (%) - Other Race
Geographical mobility - Moved from different state (%)
Geographical mobility - Moved from different state (%) - White
Geographical mobility - Moved from different state (%) - Black or African American
Geographical mobility - Moved from different state (%) - Asian
Geographical mobility - Moved from different state (%) - Hispanic or Latino
Geographical mobility - Moved from different state (%) - American Indian and Alaska Native
Geographical mobility - Moved from different state (%) - Multirace
Geographical mobility - Moved from different state (%) - Other Race
Geographical mobility - Moved from abroad (%)
Geographical mobility - Moved from abroad (%) - White
Geographical mobility - Moved from abroad (%) - Black or African American
Geographical mobility - Moved from abroad (%) - Asian
Geographical mobility - Moved from abroad (%) - Hispanic or Latino
Geographical mobility - Moved from abroad (%) - American Indian and Alaska Native
Geographical mobility - Moved from abroad (%) - Multirace
Geographical mobility - Moved from abroad (%) - Other Race
Place of birth for the foreign-born population - Ireland (%)
Place of birth for the foreign-born population - Denmark (%)
Place of birth for the foreign-born population - Norway (%)
Place of birth for the foreign-born population - Sweden (%)
Place of birth for the foreign-born population - United Kingdom (%)
Place of birth for the foreign-born population - England (%)
Place of birth for the foreign-born population - Scotland (%)
Place of birth for the foreign-born population - Other Northern Europe (%)
Place of birth for the foreign-born population - Austria (%)
Place of birth for the foreign-born population - Belgium (%)
Place of birth for the foreign-born population - France (%)
Place of birth for the foreign-born population - Germany (%)
Place of birth for the foreign-born population - Netherlands (%)
Place of birth for the foreign-born population - Switzerland (%)
Place of birth for the foreign-born population - Other Western Europe (%)
Place of birth for the foreign-born population - Greece (%)
Place of birth for the foreign-born population - Italy (%)
Place of birth for the foreign-born population - Portugal (%)
Place of birth for the foreign-born population - Spain (%)
Place of birth for the foreign-born population - Other Southern Europe (%)
Place of birth for the foreign-born population - Albania (%)
Place of birth for the foreign-born population - Belarus (%)
Place of birth for the foreign-born population - Bosnia and Herzegovina (%)
Place of birth for the foreign-born population - Bulgaria (%)
Place of birth for the foreign-born population - Croatia (%)
Place of birth for the foreign-born population - Czechoslovakia (%)
Place of birth for the foreign-born population - Hungary (%)
Place of birth for the foreign-born population - Latvia (%)
Place of birth for the foreign-born population - Lithuania (%)
Place of birth for the foreign-born population - North Macedonia (Macedonia) (%)
Place of birth for the foreign-born population - Moldova (%)
Place of birth for the foreign-born population - Poland (%)
Place of birth for the foreign-born population - Romania (%)
Place of birth for the foreign-born population - Russia (%)
Place of birth for the foreign-born population - Serbia (%)
Place of birth for the foreign-born population - Ukraine (%)
Place of birth for the foreign-born population - Other Eastern Europe (%)
Place of birth for the foreign-born population - China (%)
Place of birth for the foreign-born population - Hong Kong (%)
Place of birth for the foreign-born population - Taiwan (%)
Place of birth for the foreign-born population - Japan (%)
Place of birth for the foreign-born population - Korea (%)
Place of birth for the foreign-born population - Other Eastern Asia (%)
Place of birth for the foreign-born population - Afghanistan (%)
Place of birth for the foreign-born population - Bangladesh (%)
Place of birth for the foreign-born population - India (%)
Place of birth for the foreign-born population - Iran (%)
Place of birth for the foreign-born population - Kazakhstan (%)
Place of birth for the foreign-born population - Nepal (%)
Place of birth for the foreign-born population - Pakistan (%)
Place of birth for the foreign-born population - Sri Lanka (%)
Place of birth for the foreign-born population - Uzbekistan (%)
Place of birth for the foreign-born population - Other South Central Asia (%)
Place of birth for the foreign-born population - Burma (%)
Place of birth for the foreign-born population - Cambodia (%)
Place of birth for the foreign-born population - Indonesia (%)
Place of birth for the foreign-born population - Laos (%)
Place of birth for the foreign-born population - Malaysia (%)
Place of birth for the foreign-born population - Philippines (%)
Place of birth for the foreign-born population - Singapore (%)
Place of birth for the foreign-born population - Thailand (%)
Place of birth for the foreign-born population - Vietnam (%)
Place of birth for the foreign-born population - Other South Eastern Asia (%)
Place of birth for the foreign-born population - Armenia (%)
Place of birth for the foreign-born population - Iraq (%)
Place of birth for the foreign-born population - Israel (%)
Place of birth for the foreign-born population - Jordan (%)
Place of birth for the foreign-born population - Kuwait (%)
Place of birth for the foreign-born population - Lebanon (%)
Place of birth for the foreign-born population - Saudi Arabia (%)
Place of birth for the foreign-born population - Syria (%)
Place of birth for the foreign-born population - Turkey (%)
Place of birth for the foreign-born population - Yemen (%)
Place of birth for the foreign-born population - Other Western Asia (%)
Place of birth for the foreign-born population - Eritrea (%)
Place of birth for the foreign-born population - Ethiopia (%)
Place of birth for the foreign-born population - Kenya (%)
Place of birth for the foreign-born population - Somalia (%)
Place of birth for the foreign-born population - Uganda (%)
Place of birth for the foreign-born population - Zimbabwe (%)
Place of birth for the foreign-born population - Other Eastern Africa (%)
Place of birth for the foreign-born population - Cameroon (%)
Place of birth for the foreign-born population - Congo (%)
Place of birth for the foreign-born population - Democratic Republic of Congo (Zaire) (%)
Place of birth for the foreign-born population - Other Middle Africa (%)
Place of birth for the foreign-born population - Egypt (%)
Place of birth for the foreign-born population - Morocco (%)
Place of birth for the foreign-born population - Sudan (%)
Place of birth for the foreign-born population - Other Northern Africa (%)
Place of birth for the foreign-born population - South Africa (%)
Place of birth for the foreign-born population - Other Southern Africa (%)
Place of birth for the foreign-born population - Cabo Verde (%)
Place of birth for the foreign-born population - Ghana (%)
Place of birth for the foreign-born population - Liberia (%)
Place of birth for the foreign-born population - Nigeria (%)
Place of birth for the foreign-born population - Senegal (%)
Place of birth for the foreign-born population - Sierra Leone (%)
Place of birth for the foreign-born population - Other Western Africa (%)
Place of birth for the foreign-born population - Australia (%)
Place of birth for the foreign-born population - New Zealand (%)
Place of birth for the foreign-born population - Fiji (%)
Place of birth for the foreign-born population - Micronesia (%)
Place of birth for the foreign-born population - Bahamas (%)
Place of birth for the foreign-born population - Barbados (%)
Place of birth for the foreign-born population - Cuba (%)
Place of birth for the foreign-born population - Dominica (%)
Place of birth for the foreign-born population - Dominican Republic (%)
Place of birth for the foreign-born population - Grenada (%)
Place of birth for the foreign-born population - Haiti (%)
Place of birth for the foreign-born population - Jamaica (%)
Place of birth for the foreign-born population - St. Vincent and the Grenadines (%)
Place of birth for the foreign-born population - Trinidad and Tobago (%)
Place of birth for the foreign-born population - West Indies (%)
Place of birth for the foreign-born population - Other Caribbean (%)
Place of birth for the foreign-born population - Belize (%)
Place of birth for the foreign-born population - Costa Rica (%)
Place of birth for the foreign-born population - El Salvador (%)
Place of birth for the foreign-born population - Guatemala (%)
Place of birth for the foreign-born population - Honduras (%)
Place of birth for the foreign-born population - Mexico (%)
Place of birth for the foreign-born population - Nicaragua (%)
Place of birth for the foreign-born population - Panama (%)
Place of birth for the foreign-born population - Other Central America (%)
Place of birth for the foreign-born population - Argentina (%)
Place of birth for the foreign-born population - Bolivia (%)
Place of birth for the foreign-born population - Brazil (%)
Place of birth for the foreign-born population - Chile (%)
Place of birth for the foreign-born population - Colombia (%)
Place of birth for the foreign-born population - Ecuador (%)
Place of birth for the foreign-born population - Guyana (%)
Place of birth for the foreign-born population - Peru (%)
Place of birth for the foreign-born population - Uruguay (%)
Place of birth for the foreign-born population - Venezuela (%)
Place of birth for the foreign-born population - Other South America (%)
Place of birth for the foreign-born population - Canada (%)
Place of birth for the foreign-born population - Other Northern America (%)
Place of birth for the foreign-born population - Other (%)
Latest news about races in Chattanooga, TN collected exclusively by city-data.com from local newspapers, TV, and radio stations
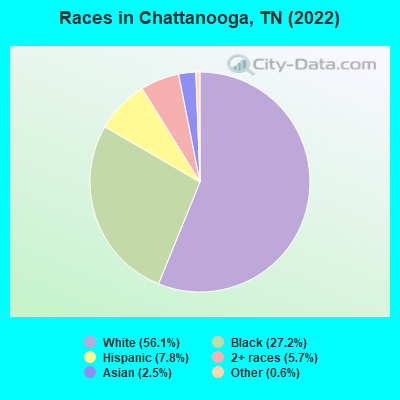
According to 2022 data, the most numerous races in Chattanooga, TN are White alone (103,219 residents), Black alone (50,052 residents), and Hispanic (14,444 residents). 89.5% of Chattanooga residents speak English at home. 7.5% of Chattanooga, TN residents are foreign-born (4.3% born in Latin America, 1.7% born in Asia), which is 33.3% greater than the foreign-born rate of 5.0% across the entire state of Tennessee.
Race distribution in Chattanooga
2000 2022
91,582 58.9% White alone 55,874 35.9% Black alone 3,281 2.1% Hispanic 2,384 1.5% Asian alone 1,773 1.1% Two or more races 395 0.3% American Indian alone 182 0.1% Other race alone 83 0.05% Native Hawaiian and Other
103,219 56.1% White alone 50,052 27.2% Black alone 14,444 7.8% Hispanic 10,456 5.7% Two or more races 4,659 2.5% Asian alone 1,065 0.6% Other race alone 117 0.06% Native Hawaiian and Other 59 0.03% American Indian alone
2000 2022
4,505,930 79.2% White alone 928,204 16.3% Black alone 123,838 2.2% Hispanic 54,824 1.0% Two or more races 56,077 1.0% Asian alone 13,820 0.2% American Indian alone 4,780 0.08% Other race alone 1,810 0.03% Native Hawaiian and Other
5,070,026 71.9% White alone 1,089,738 15.5% Black alone 442,629 6.3% Hispanic 279,381 4.0% Two or more races 131,817 1.9% Asian alone 26,972 0.4% Other race alone 6,387 0.09% American Indian alone 4,389 0.06% Native Hawaiian and Other
Income and house value in Chattanooga Median household income in 2022 $80,579 White non-Hispanic householders$41,351 Black householders$41,323 American Indian and Alaska Native householders$127,941 Asian householders$53,258 Some other race householders$72,132 Two or more races householders$53,840 Hispanic or Latino race householdersMedian 2022 house value $312,638 White Non-Hispanic householders$216,494 Black or African American householders$487,879 American Indian or Alaska Native householders $409,123 Asian householders$359,346 Native Hawaiian and other Pacific Islander householders$221,608 Some other race householders$248,542 Two or more races householders$235,927 Hispanic or Latino householders
Median age by race in Chattanooga
38.7 Median age for White residents37.3 39.6 39.7 Median age for Black or African American residents35.8 41.6 32.7 Median age for American Indian / Alaska Native residents32.7 -666,666,666.0 38.3 Median age for Asian residents30.2 46.9 -666,666,666.0 Median age for Native Hawaiian / Pacific Islander residents-666,666,666.0 -666,666,666.0 19.4 Median age for Other race residents16.8 29.1 22.0 Median age for Two or more races residents22.1 22.0 39.0 Median age for White alone residents37.7 40.2 20.3 Median age for Hispanic or Latino residents19.8 21.2
Owner/renter occupied households by race in Chattanooga
House owners and renters - White residents 30,331 62.0% Owner occupied18,596 38.0% Renter occupiedHouse owners and renters - Black or African American residents 10,285 49.5% Owner occupied10,512 50.5% Renter occupiedHouse owners and renters - American Indian / Alaska Native residents 78 51.3% Owner occupied74 48.7% Renter occupiedHouse owners and renters - Asian residents 928 68.9% Owner occupied419 31.1% Renter occupiedHouse owners and renters - Native Hawaiian / Pacific Islander residents 24 38.1% Owner occupied40 61.9% Renter occupiedHouse owners and renters - Other race residents 545 40.6% Owner occupied796 59.4% Renter occupiedHouse owners and renters - Two or more races residents 2,009 47.8% Owner occupied2,190 52.2% Renter occupiedHouse owners and renters - White alone residents 30,028 62.3% Owner occupied18,163 37.7% Renter occupiedHouse owners and renters - Hispanic or Latino residents 1,100 37.9% Owner occupied1,802 62.1% Renter occupied
Language usage in Chattanooga
English speakers - Total 89.5% of residents of Chattanooga speak English at home.
7.0% of residents speak Spanish at home 6,194 51.3% Speak English very well5,884 48.7% Speak English less than very well3.4% of residents speak other language at home 4,048 68.7% Speak English very well1,845 31.3% Speak English less than very well
English speakers - Born in the United States 96.1% of residents of Chattanooga speak English at home.
2.6% of residents speak Spanish at home 1,474 81.4% Speak English very well336 18.6% Speak English less than very well1.3% of residents speak other language at home 756 87.3% Speak English very well110 12.7% Speak English less than very well
English speakers - Native, born elsewhere 91.4% of residents of Chattanooga speak English at home.
8.6% of residents speak Spanish at home 121 100.0% Speak English very well
English speakers - Foreign-born 16.9% of residents of Chattanooga speak English at home.
54.6% of residents speak Spanish at home 2,077 29.9% Speak English very well4,864 70.1% Speak English less than very well28.5% of residents speak other language at home 1,970 54.4% Speak English very well1,653 45.6% Speak English less than very well
White (Caucasian) - Speak only English Native:
97.8% (95,336)Foreign-born:
29.2% (1,032)
White (Caucasian) - Speak another language Native:
2.2% (2,147)Foreign-born:
70.8% (2,503)
Black or African American - Speak only English Native:
98.2% (45,625)Foreign-born:
28.4% (601)
Black or African American - Speak another language Native:
1.8% (851)Foreign-born:
71.0% (1,500)
American Indian / Alaska Native - Speak another language Native:
30.3% (82)Foreign-born:
100.0% (40)
Asian - Speak only English Native:
50.1% (1,067)Foreign-born:
3.2% (74)
Asian - Speak another language Native:
49.9% (1,064)Foreign-born:
96.8% (2,263)
Native Hawaiian / Pacific Islander - Speak only English Native:
100.0% (41)Foreign-born:
71.9% (13)
Other race - Speak only English Native:
31.3% (777)Foreign-born:
1.4% (39)
Other race - Speak another language Native:
68.7% (1,709)Foreign-born:
98.6% (2,817)
Two or more races - Speak only English Native:
88.0% (9,747)Foreign-born:
11.2% (309)
Two or more races - Speak another language Native:
12.0% (1,331)Foreign-born:
88.8% (2,458)
White alone - Speak only English Native:
98.3% (95,058)Foreign-born:
51.2% (1,032)
White alone - Speak another language Native:
1.7% (1,639)Foreign-born:
48.8% (982)
Hispanic or Latino - Speak only English Native:
34.7% (1,666)Foreign-born:
1.5% (106)
Hispanic or Latino - Speak another language Native:
65.3% (3,142)Foreign-born:
98.5% (6,953)
Foreign-born residents in Chattanooga 13,877 residents are foreign born (4.3% Latin America , 1.7% Asia ).
This city:
7.5%Tennessee:
5.4%
Marital status for residents in Chattanooga Marital status - White (Caucasian) population 15 years and over
Males 36.4% Never married46.7% Now married1.5% Separated2.7% Widowed12.7% DivorcedFemales 27.3% Never married46.5% Now married1.9% Separated11.7% Widowed12.6% DivorcedWomen who gave birth in the past 12 months Now married:
100.0% (1,248)Unmarried:
0.0% (0)
Women who did not give birth in the past 12 months Now married:
43.5% (10,679)Unmarried:
56.5% (13,854)
Marital status - Black or African American population 15 years and over
Males 47.6% Never married35.0% Now married3.8% Separated3.1% Widowed10.5% DivorcedFemales 42.9% Never married25.1% Now married2.7% Separated10.0% Widowed19.2% DivorcedWomen who gave birth in the past 12 months Now married:
18.7% (153)Unmarried:
81.3% (667)
Women who did not give birth in the past 12 months Now married:
25.4% (2,843)Unmarried:
74.6% (8,363)
Marital status - American Indian / Alaska Native population 15 years and over
Males 25.5% Never married44.5% Now married0.0% Separated6.6% Widowed23.4% DivorcedFemales 71.3% Never married20.9% Now married0.0% Separated0.0% Widowed7.8% DivorcedWomen who did not give birth in the past 12 months Now married:
12.0% (14)Unmarried:
88.0% (104)
Marital status - Asian population 15 years and over
Males 30.8% Never married67.8% Now married0.0% Separated0.3% Widowed1.1% DivorcedFemales 19.8% Never married60.6% Now married0.0% Separated12.0% Widowed7.7% DivorcedWomen who gave birth in the past 12 months Now married:
50.0% (7)Unmarried:
50.0% (7)
Women who did not give birth in the past 12 months Now married:
65.3% (787)Unmarried:
34.7% (418)
Marital status - Native Hawaiian / Pacific Islander population 15 years and over
Males 0.0% Never married100.0% Now married0.0% Separated0.0% Widowed0.0% DivorcedFemales 65.9% Never married34.1% Now married0.0% Separated0.0% Widowed0.0% DivorcedWomen who did not give birth in the past 12 months Now married:
34.1% (13)Unmarried:
65.9% (25)
Marital status - Other race population 15 years and over
Males 53.1% Never married41.6% Now married2.0% Separated0.0% Widowed3.2% DivorcedFemales 42.1% Never married49.7% Now married0.0% Separated2.0% Widowed6.2% DivorcedWomen who gave birth in the past 12 months Now married:
100.0% (126)Unmarried:
0.0% (0)
Women who did not give birth in the past 12 months Now married:
39.1% (479)Unmarried:
60.9% (747)
Marital status - Two or more races population 15 years and over
Males 41.7% Never married54.1% Now married0.0% Separated0.0% Widowed4.2% DivorcedFemales 52.8% Never married37.5% Now married0.0% Separated4.8% Widowed4.9% DivorcedWomen who gave birth in the past 12 months Now married:
52.6% (90)Unmarried:
47.4% (81)
Women who did not give birth in the past 12 months Now married:
36.4% (1,677)Unmarried:
63.6% (2,936)
Marital status - White alone, not Hispanic / Latino population 15 years and over
Males 35.7% Never married47.2% Now married1.5% Separated2.6% Widowed13.0% DivorcedFemales 26.7% Never married46.7% Now married1.8% Separated11.9% Widowed12.9% DivorcedWomen who gave birth in the past 12 months Now married:
100.0% (1,248)Unmarried:
0.0% (0)
Women who did not give birth in the past 12 months Now married:
44.0% (10,430)Unmarried:
56.0% (13,297)
Marital status - Hispanic or Latino population 15 years and over
Males 52.0% Never married38.0% Now married2.3% Separated0.3% Widowed7.5% DivorcedFemales 43.2% Never married48.0% Now married2.8% Separated1.7% Widowed4.3% DivorcedWomen who gave birth in the past 12 months Now married:
64.6% (148)Unmarried:
35.4% (81)
Women who did not give birth in the past 12 months Now married:
35.5% (1,195)Unmarried:
64.5% (2,169)
Ancestries in Chattanooga
12,135 12.0% American10,477 10.3% English5,273 5.2% Irish4,724 4.7% German2,156 2.1% Scottish1,935 1.9% European1,366 1.3% Scotch-Irish1,174 1.2% Italian948 0.9% Haitian899 0.9% African622 0.6% Ethiopian584 0.6% Dutch533 0.5% Polish450 0.4% British388 0.4% French366 0.4% Norwegian362 0.4% Sudanese316 0.3% Brazilian290 0.3% Swedish253 0.2% Welsh229 0.2% Ukrainian194 0.2% Jamaican188 0.2% Northern European165 0.2% Syrian156 0.2% Arab148 0.1% French Canadian125 0.1% Eastern European120 0.1% Canadian115 0.1% Swiss111 0.1% Greek106 0.1% Lebanese106 0.1% Iranian92 0.09% Scandinavian83 0.08% Egyptian83 0.08% Lithuanian73 0.07% Hungarian71 0.07% Czech61 0.06% Maltese60 0.06% Russian59 0.06% Romanian53 0.05% Israeli51 0.05% Portuguese47 0.05% Yugoslavian43 0.04% Australian41 0.04% Guyanese39 0.04% Armenian33 0.03% Kenyan32 0.03% Danish30 0.03% Serbian28 0.03% South African25 0.02% Slovak22 0.02% Bulgarian18 0.02% Turkish15 0.01% Palestinian15 0.01% Liberian14 0.01% Nigerian14 0.01% West Indian12 0.01% Pennsylvania German12 0.01% Bahamian12 0.01% Celtic11 0.01% Belgian10 0.01% Austrian8 0.01% Slovene7 0.01% Cajun6 0.01% Croatian
Geographical mobility in Chattanooga Same house 1 year ago 84,921 80.6% White (Caucasian)39,361 80.0% Black or African American295 98.6% American Indian / Alaska Native3,771 82.7% Asian29 56.9% Native Hawaiian / Pacific Islander3,957 81.8% Other race11,213 70.6% Two or more races82,775 80.6% White alone, not Hispanic / Latino10,926 74.9% Hispanic or LatinoMoved within same county 10,719 10.2% White / Caucasian6,495 13.2% Black or African American19 6.2% American Indian / Alaska Native120 2.6% Asian341 7.1% Other race3,404 21.4% Two or more races10,678 10.4% White alone, not Hispanic / Latino2,399 16.4% Hispanic or LatinoMoved within same state 1,907 1.8% White / Caucasian674 1.4% Black or African American96 2.1% Asian168 3.5% Other race403 2.5% Two or more races1,874 1.8% White alone, not Hispanic / Latino450 3.1% Hispanic or LatinoMoved from different state 6,828 6.5% White / Caucasian2,263 4.6% Black or African American435 9.5% Asian192 4.0% Other race777 4.9% Two or more races6,368 6.2% White alone, not Hispanic / Latino688 4.7% Hispanic or LatinoMoved from abroad 975 0.9% White430 0.9% Black or African American9 3.0% American Indian / Alaska Native164 3.6% Asian16 30.9% Native Hawaiian / Pacific Islander151 3.1% Other race84 0.5% Two or more races975 0.9% White alone, not Hispanic / Latino251 1.7% Hispanic or Latino
Children Nativity (place of birth) in Chattanooga
Children under 6 years - Living with two parents Both parents native 6,572 100.0% NativeBoth parents foreign-born 1,506 100.0% NativeOne native, one foreign-born parent 1,019 100.0% NativeChildren under 6 years - Living with one parent Native parent 4,139 100.0% NativeForeign-born parent 627 73.9% Native222 26.1% Foreign-bornChildren 6 to 17 years - Living with two parents Both parents native 8,732 100.0% NativeBoth parents foreign-born 2,583 90.1% Native283 9.9% Foreign-bornOne native, one foreign-born parent 655 70.8% Native270 29.2% Foreign-bornChildren 6 to 17 years - Living with one parent Native parent 8,081 100.0% NativeForeign-born parent 1,390 60.5% Native907 39.5% Foreign-born
Grandparents responsible for own grandchildren in Chattanooga
Grandparents (30 to 59 years) White / Caucasian 526 78.6% Responsible for grandchildren143 21.4% Not responsible for grandchildrenBlack or African American 217 49.9% Responsible for grandchildren218 50.1% Not responsible for grandchildrenAsian 65 91.6% Responsible for grandchildren6 8.4% Not responsible for grandchildrenOther race 63 79.7% Responsible for grandchildren16 20.3% Not responsible for grandchildrenTwo or more races 87 50.2% Responsible for grandchildren86 49.8% Not responsible for grandchildrenWhite alone, not Hispanic / Latino 286 66.7% Responsible for grandchildren143 33.3% Not responsible for grandchildrenHispanic or Latino 150 61.1% Responsible for grandchildren96 38.9% Not responsible for grandchildrenGrandparents (60 years and over) White / Caucasian 485 50.3% Responsible for grandchildren479 49.7% Not responsible for grandchildrenBlack or African American 188 33.6% Responsible for grandchildren372 66.4% Not responsible for grandchildrenAsian 91 100.0% Not responsible for grandchildrenOther race 62 100.0% Not responsible for grandchildrenTwo or more races 16 7.2% Responsible for grandchildren211 92.8% Not responsible for grandchildrenWhite alone, not Hispanic / Latino 485 50.3% Responsible for grandchildren479 49.7% Not responsible for grandchildrenHispanic or Latino 7 5.4% Responsible for grandchildren128 94.6% Not responsible for grandchildren
Zip codes: 37341 , 37343 , 37350 , 37351 , 37377 , 37379 , 37402 , 37403 , 37404 , 37405 , 37406 , 37407 , 37408 , 37409 , 37410 , 37411 , 37412 , 37415 , 37416 , 37419 , 37421 .